The Burrow

The rising cost of living has dominated conversation at family barbeques and around kitchen tables right across the nation this year. The pressure on our household budget has been immense. Whether it’s the rising price of everyday grocery staples or soaring fuel prices, the dramatic increase in our mortgage repayments or rent – we’ve been hit from every side.
With more than six million visitors to our website last year, the team at Compare the Market has a distinct insight into the pressure on household budgets.
Our inaugural Household Budget Barometer, powered by the research experts at Pureprofile, is a deep dive into how everyday Aussies are managing the cost-of-living crisis, and what they’re sacrificing to save.
The scourge of inflation isn’t just being felt here in Australia, with rising interest rates and soaring energy prices impacting people throughout the world. As champions of comparison, we decided to survey households in Canada and the United States, to understand how we fare differently.
The findings are startling, and vary dramatically across genders, levels of education, family composition and household income.
This report is a key learning tool for our team, to better understand how we can help more Australians in their time of need and to better equip us all for financial challenges that lay ahead.
Rob Clancy

Regardless of life stage, family composition, education or location – this is certainly a time of increased financial strain for everyone. 94% of Aussies have told us they are feeling the effects of cost of living increases over the last 12 months. An astonishing number, but definitely not an unexpected one.
The cost of living crisis is having a massive impact on our day-to-day lives. Making ends meet to cover everyday essentials makes budgeting difficult but it also limits what people are able to do to plan and prepare for the future.
Uncertainty plays a big part in the cost of living struggle – not just for consumers but also for the businesses who need to understand the changing needs of these consumers. That’s why conducting meaningful research is so critical right now.
We are absolutely delighted to have partnered with Compare The Market for research across Australia, the USA and Canada to bring this important research to life. Compare The Market are great consumer advocates – passionate about helping people stretch their dollar further – a cause we are glad to support.
It is my hope that this report and the insights presented within will encourage people to ask more questions and study their decisions – and in doing so perhaps they will discover some unexpected financial relief.
Martin Filz – CEO, Pureprofile

The pressure is rising

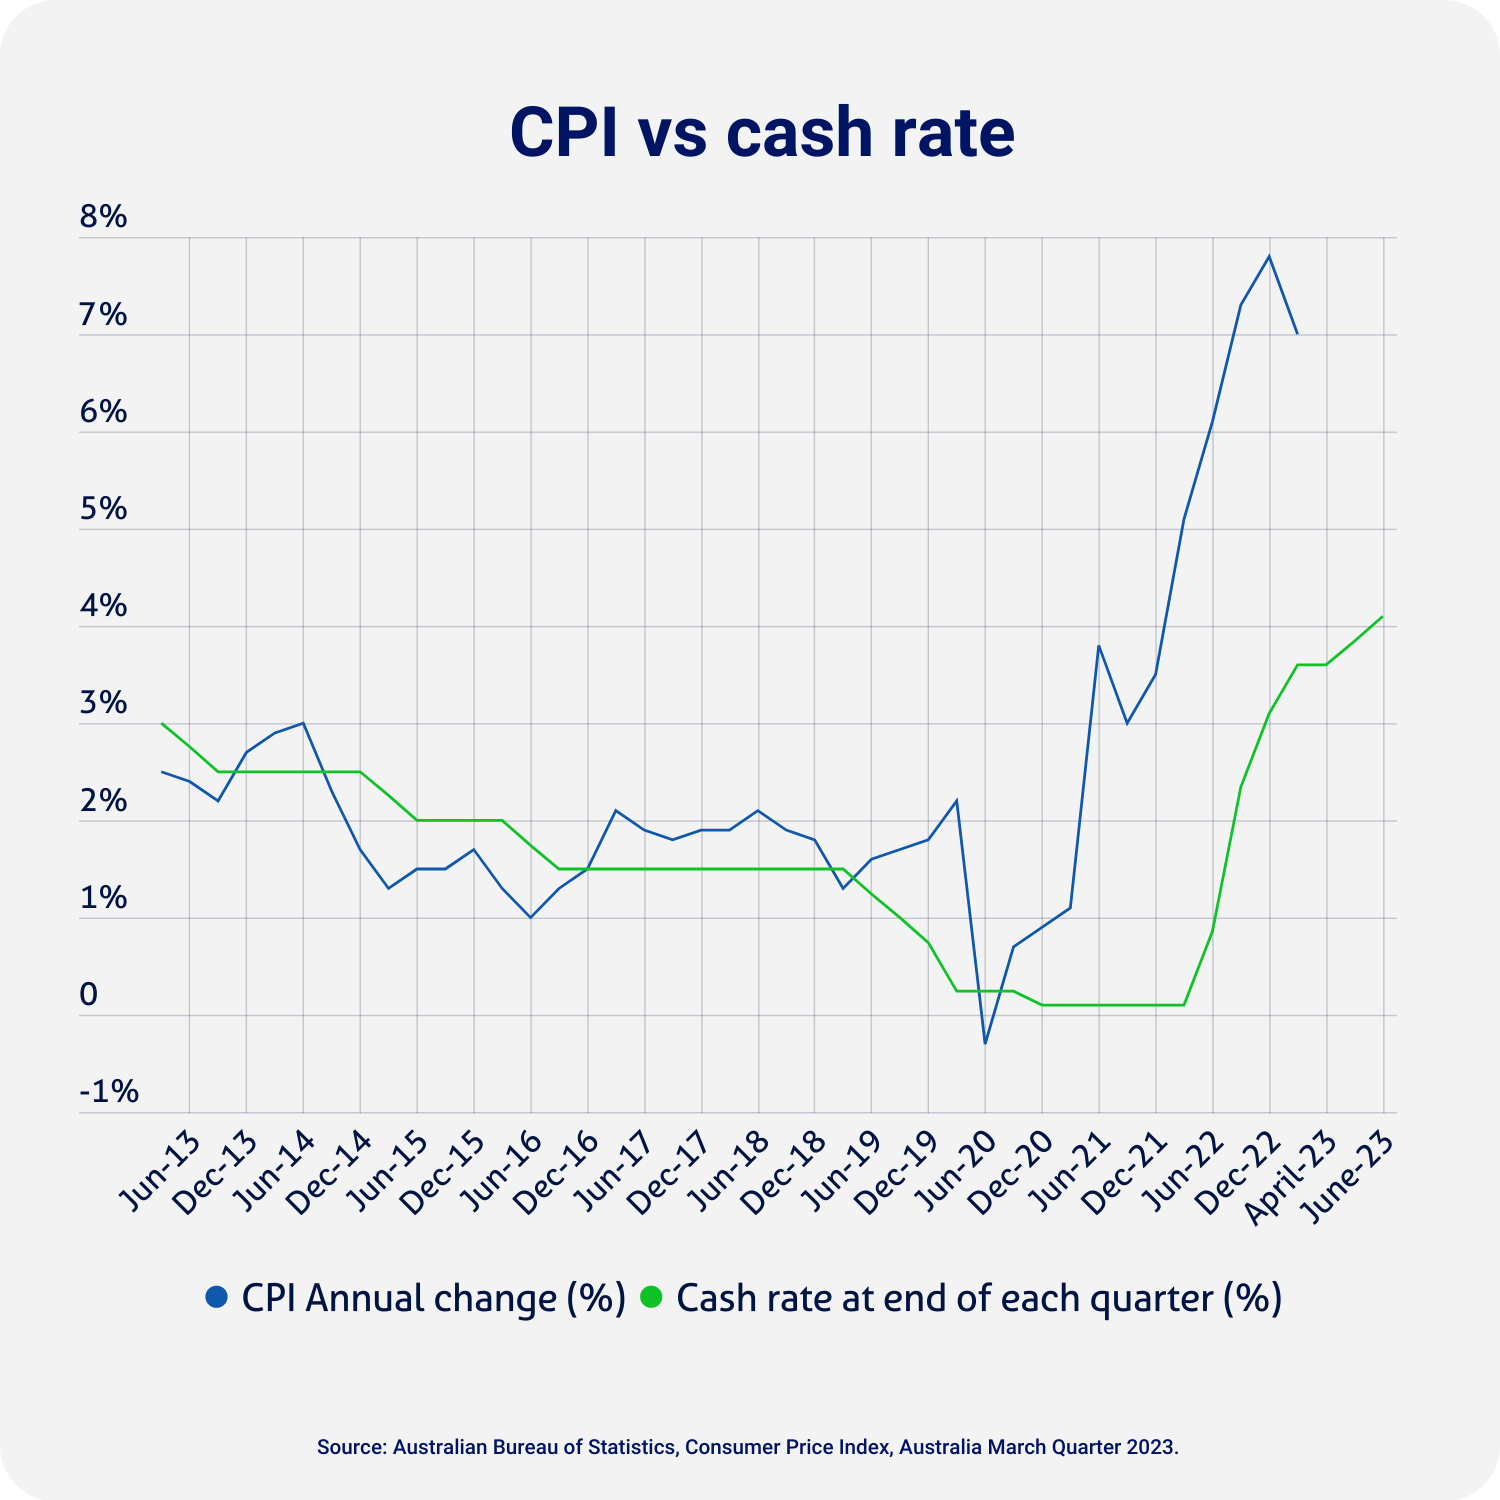
The Australian Consumer Price Index (CPI) has been growing at its fastest rate in more than 30 years.
The Covid-19 pandemic saw the index drop to an all-time low in June 2020.
But global factors, including supply and labour shortages and the war in Ukraine have seen inflation soar, with almost consistent growth through to 2023.
There were only signs of easing in April, following a series of cash rate hikes from the Reserve Bank.
Housing costs have experienced the brunt of that, with as much as a 10.7% increase year-on-year.
These economic changes were unexpected for many consumers who had spent the years prior contributing to their savings and investing in new homes.
Unemployment has dropped in Australia too with a tight job market an indicator for recent wage growth.
Unsurprisingly, an overwhelming majority of Australians surveyed (94%) felt that cost of living had increased in the last 12 months. This was consistent across almost all demographics.
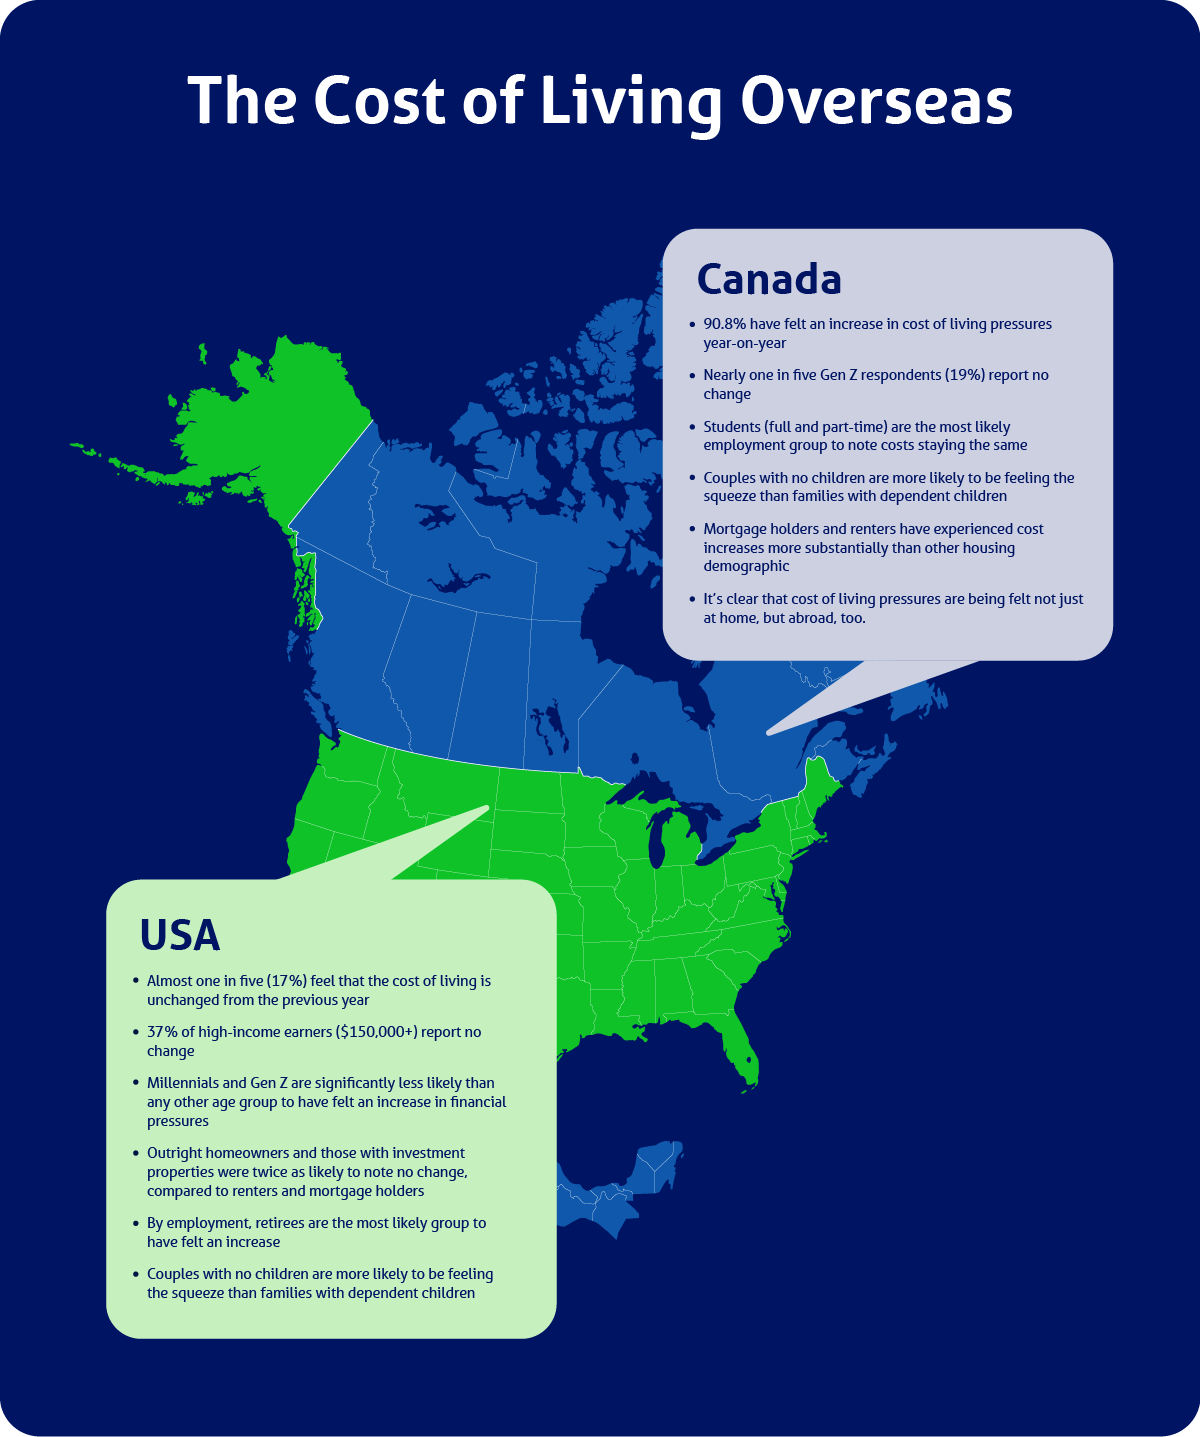
Internationally, things look a little different. Americans responding that cost of living pressures aren’t as severe as those being felt by Australians:
And as for Canadians:

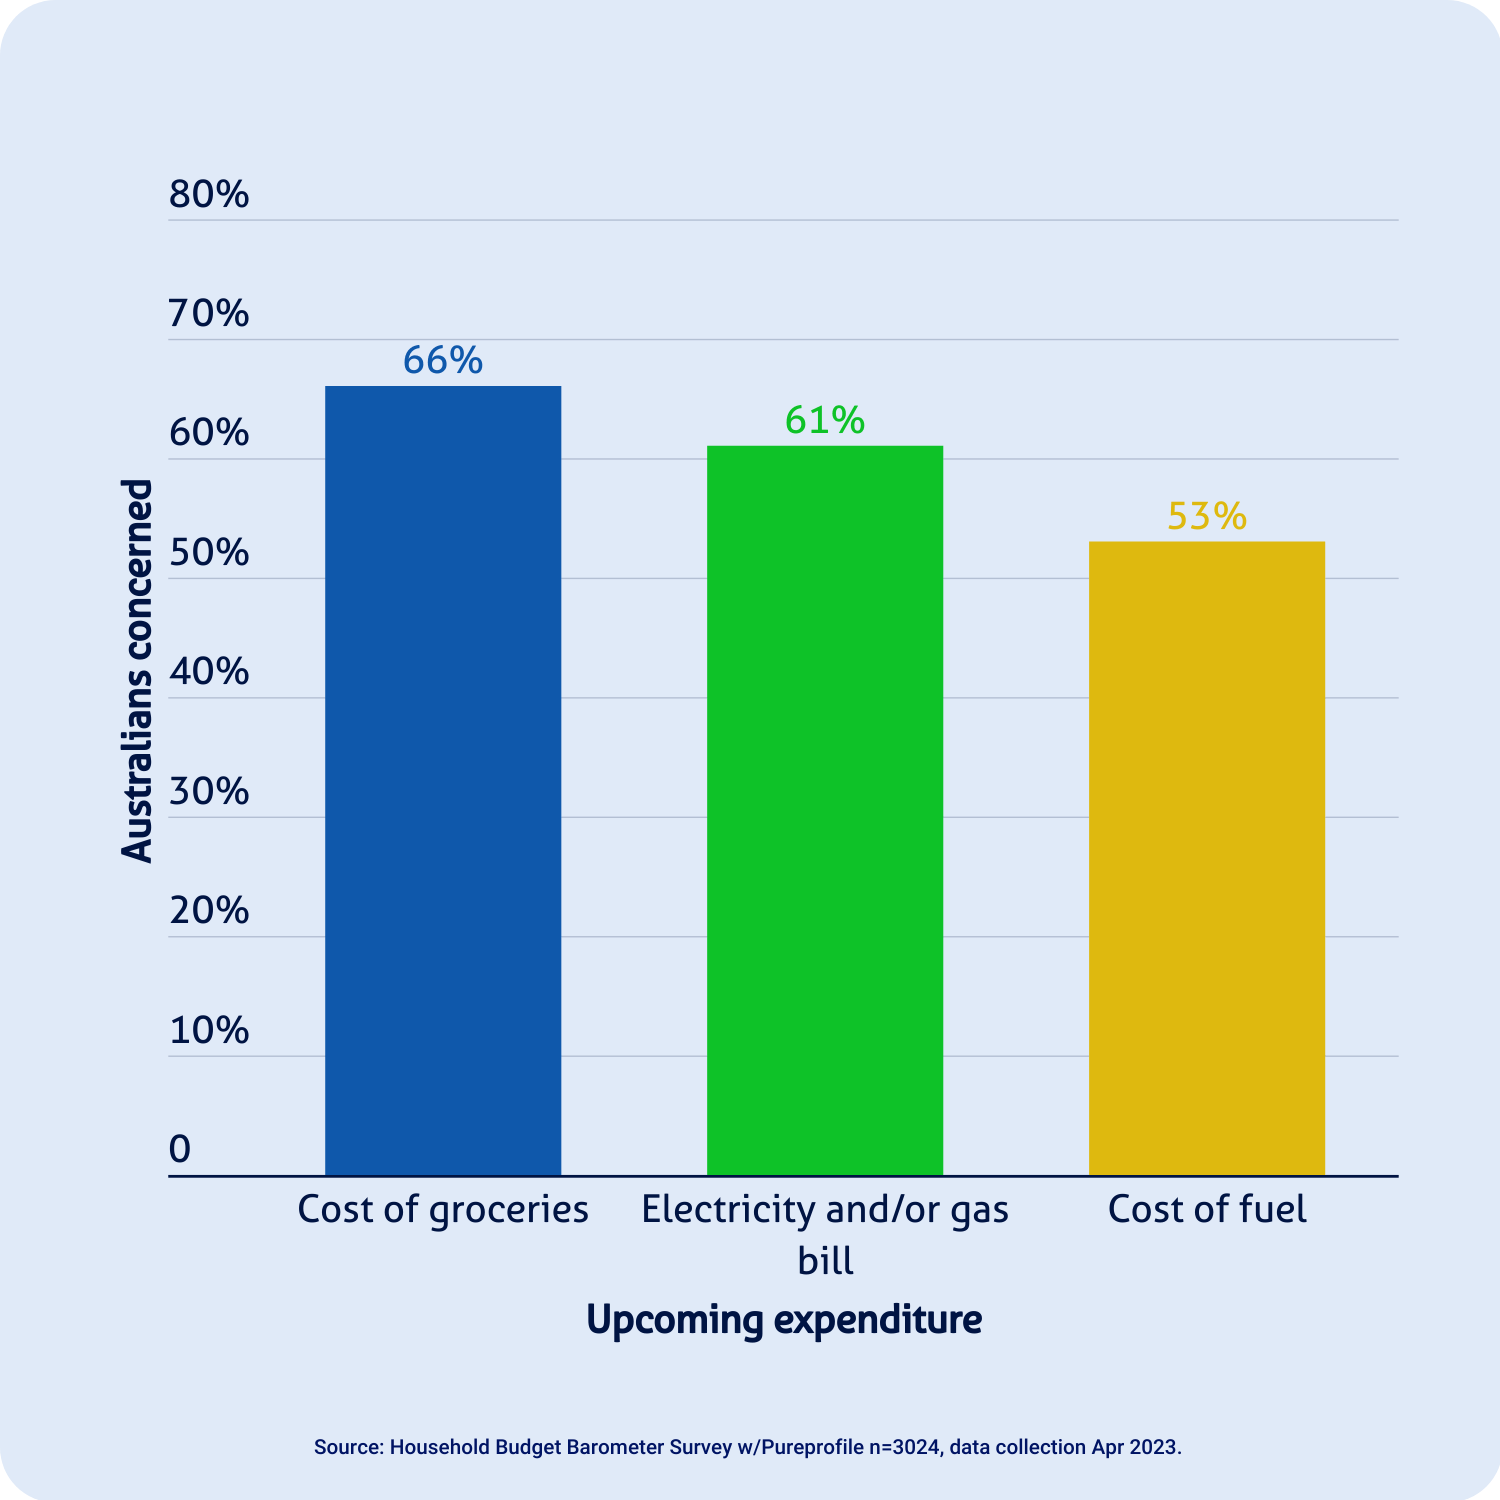
Worries across the budget

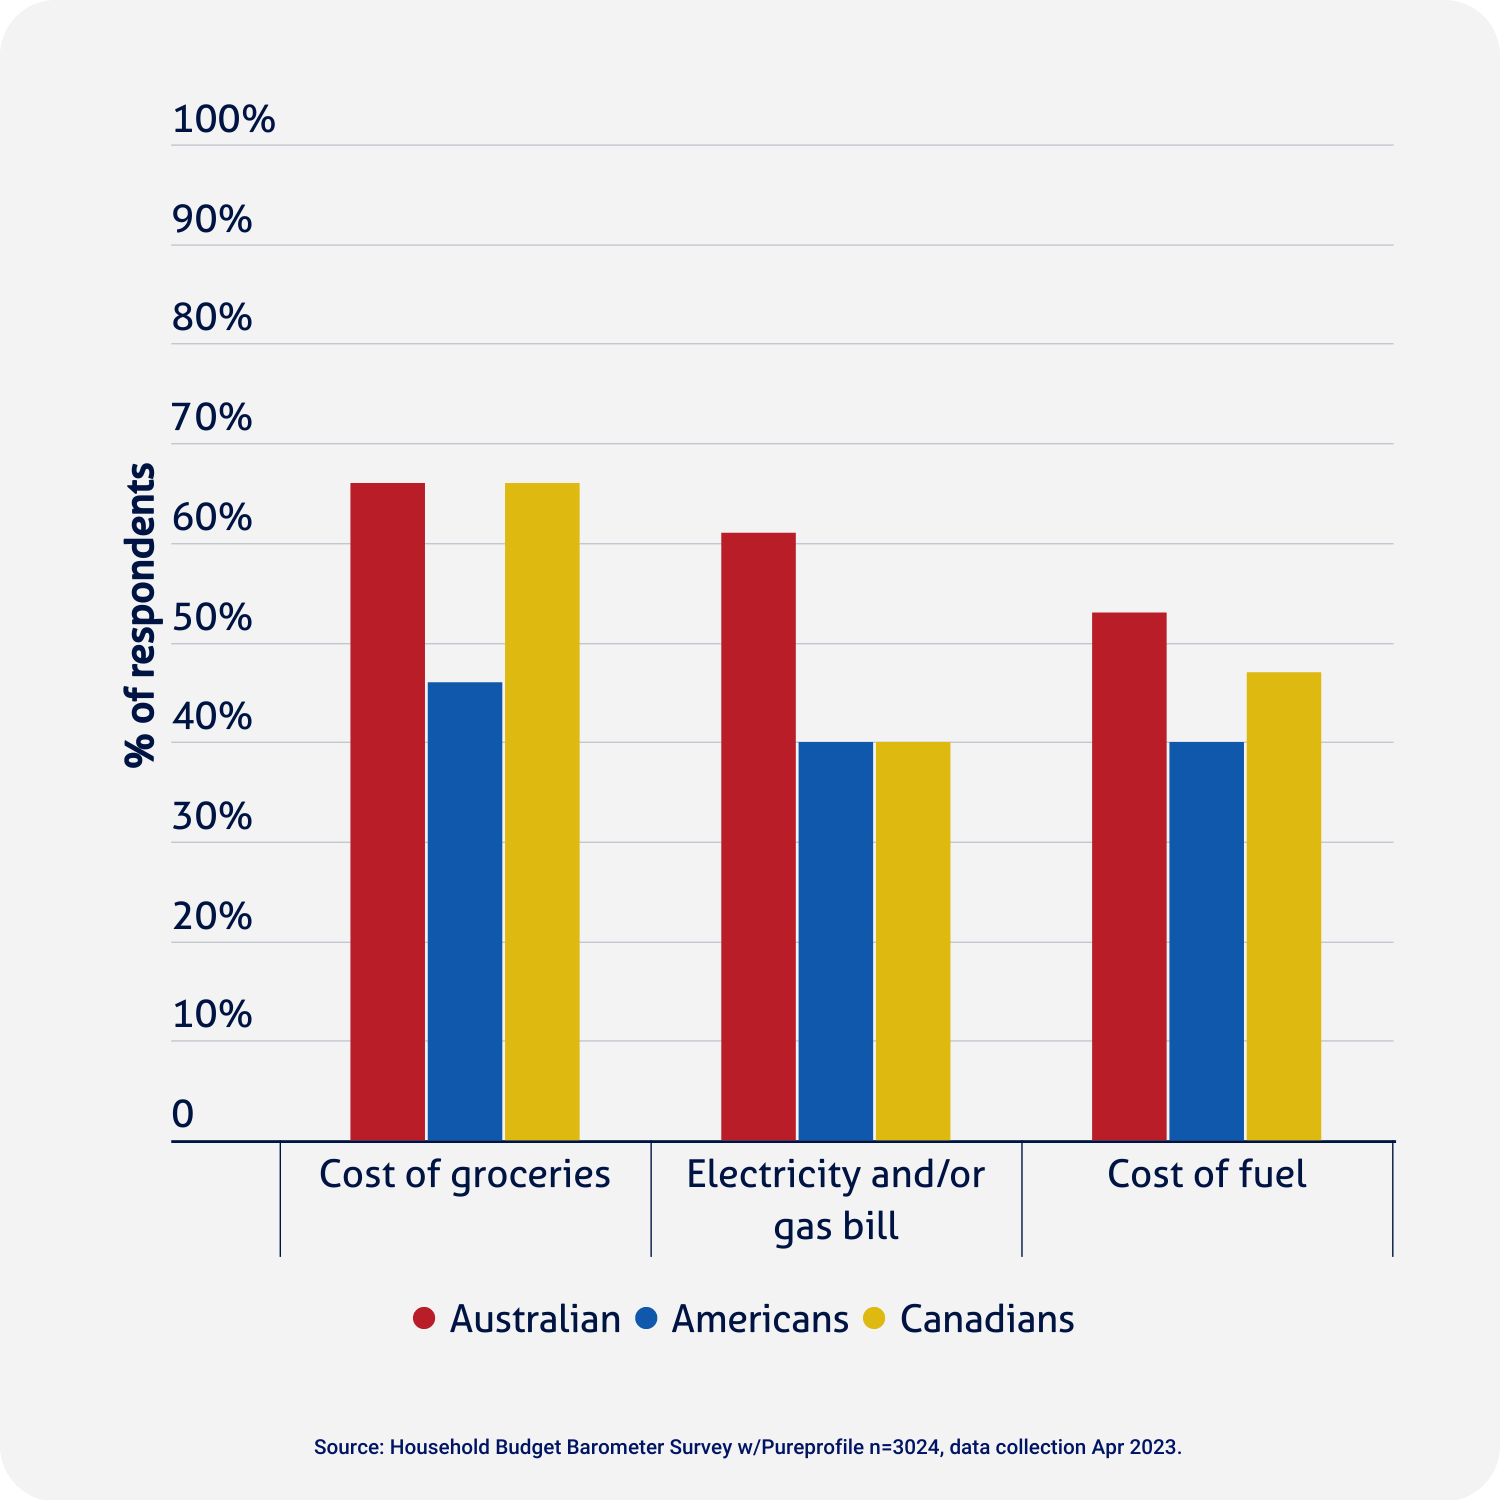
Everyday expenses including the cost of groceries, energy bills, and fuel prices are the main cause of concern. This was observed across all age groups.
Other pressure points differed between generations.
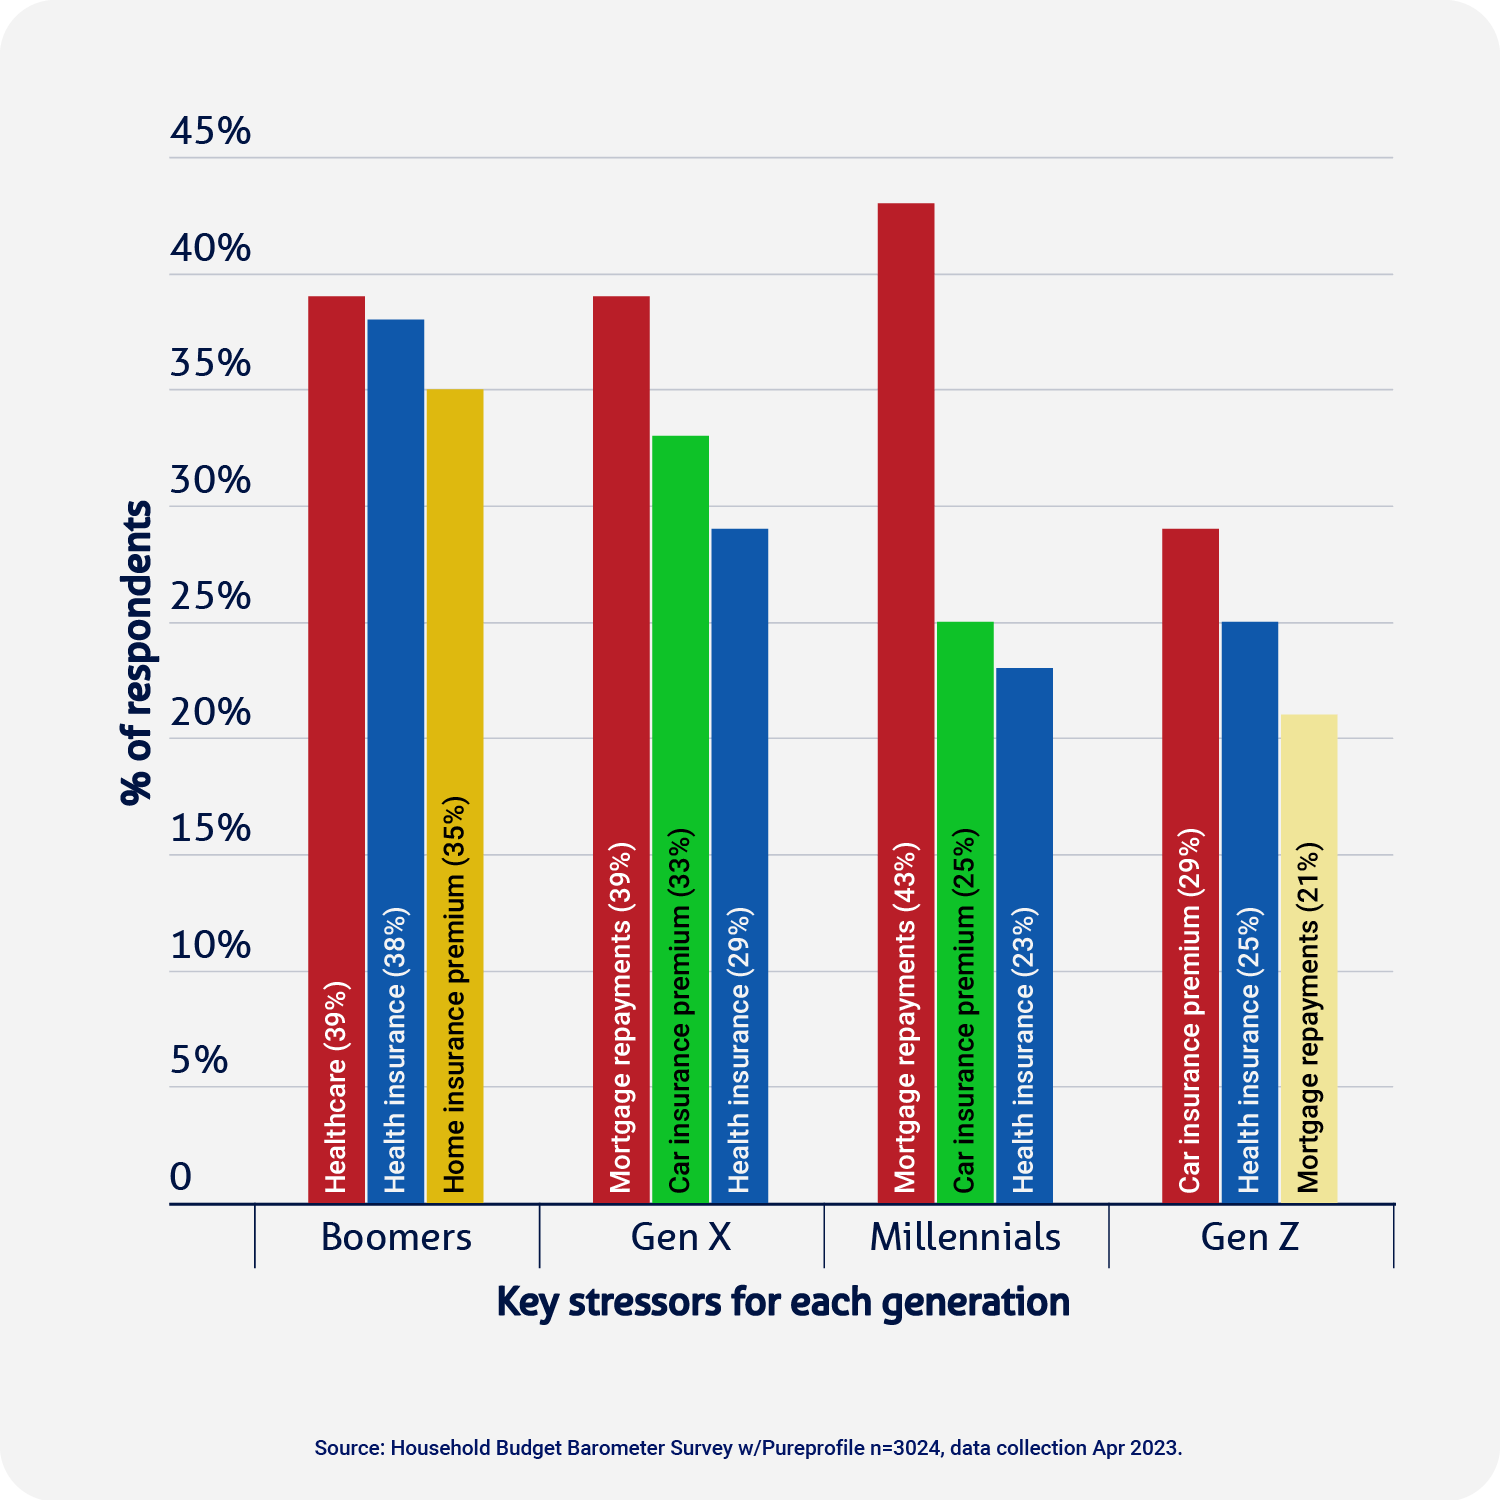
If we were to compare the different stressors by the most affected age group, here’s what we found:
And on an income basis:
In the USA and Canada, the same key bills are causing concern for households, although with less intensity.
American earners under $80,000 were significantly more likely to be concerned about upcoming grocery and electricity bills. Meanwhile, for Canadians, grocery prices were a key concern for all income brackets, whereas fuel prices were of concern for all but the highest and lowest earners (below $20,000 and above $150,000).
Interestingly, Americans were less concerned about the cost of healthcare than Australians, despite having a lack of universal healthcare.
Unlike Australians, however, Gen Z Americans and Canadians were far more likely to be worried about upcoming school fees. In fact for Americans, Gen Z cited this as a concern as much as three times more than any other age group.
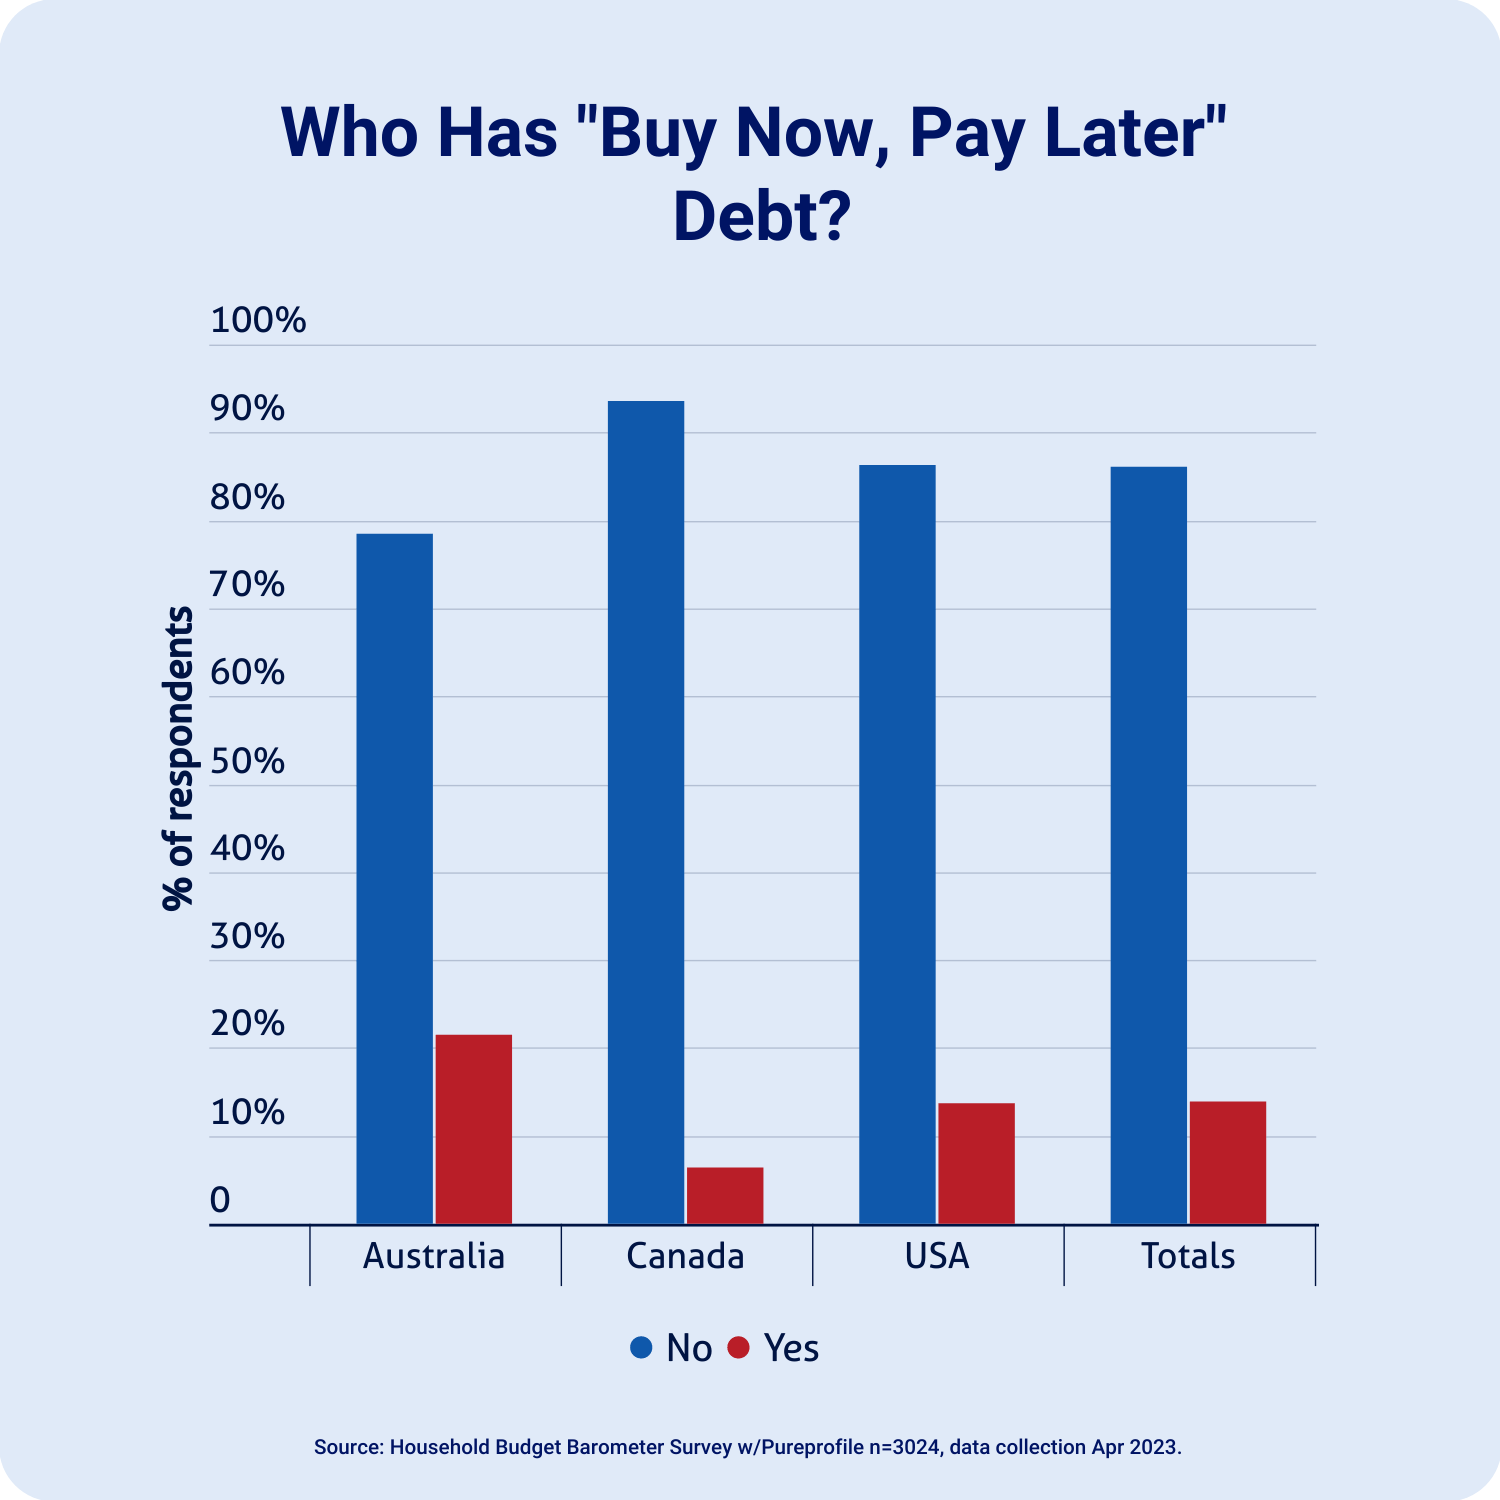
And how does Australia fare?

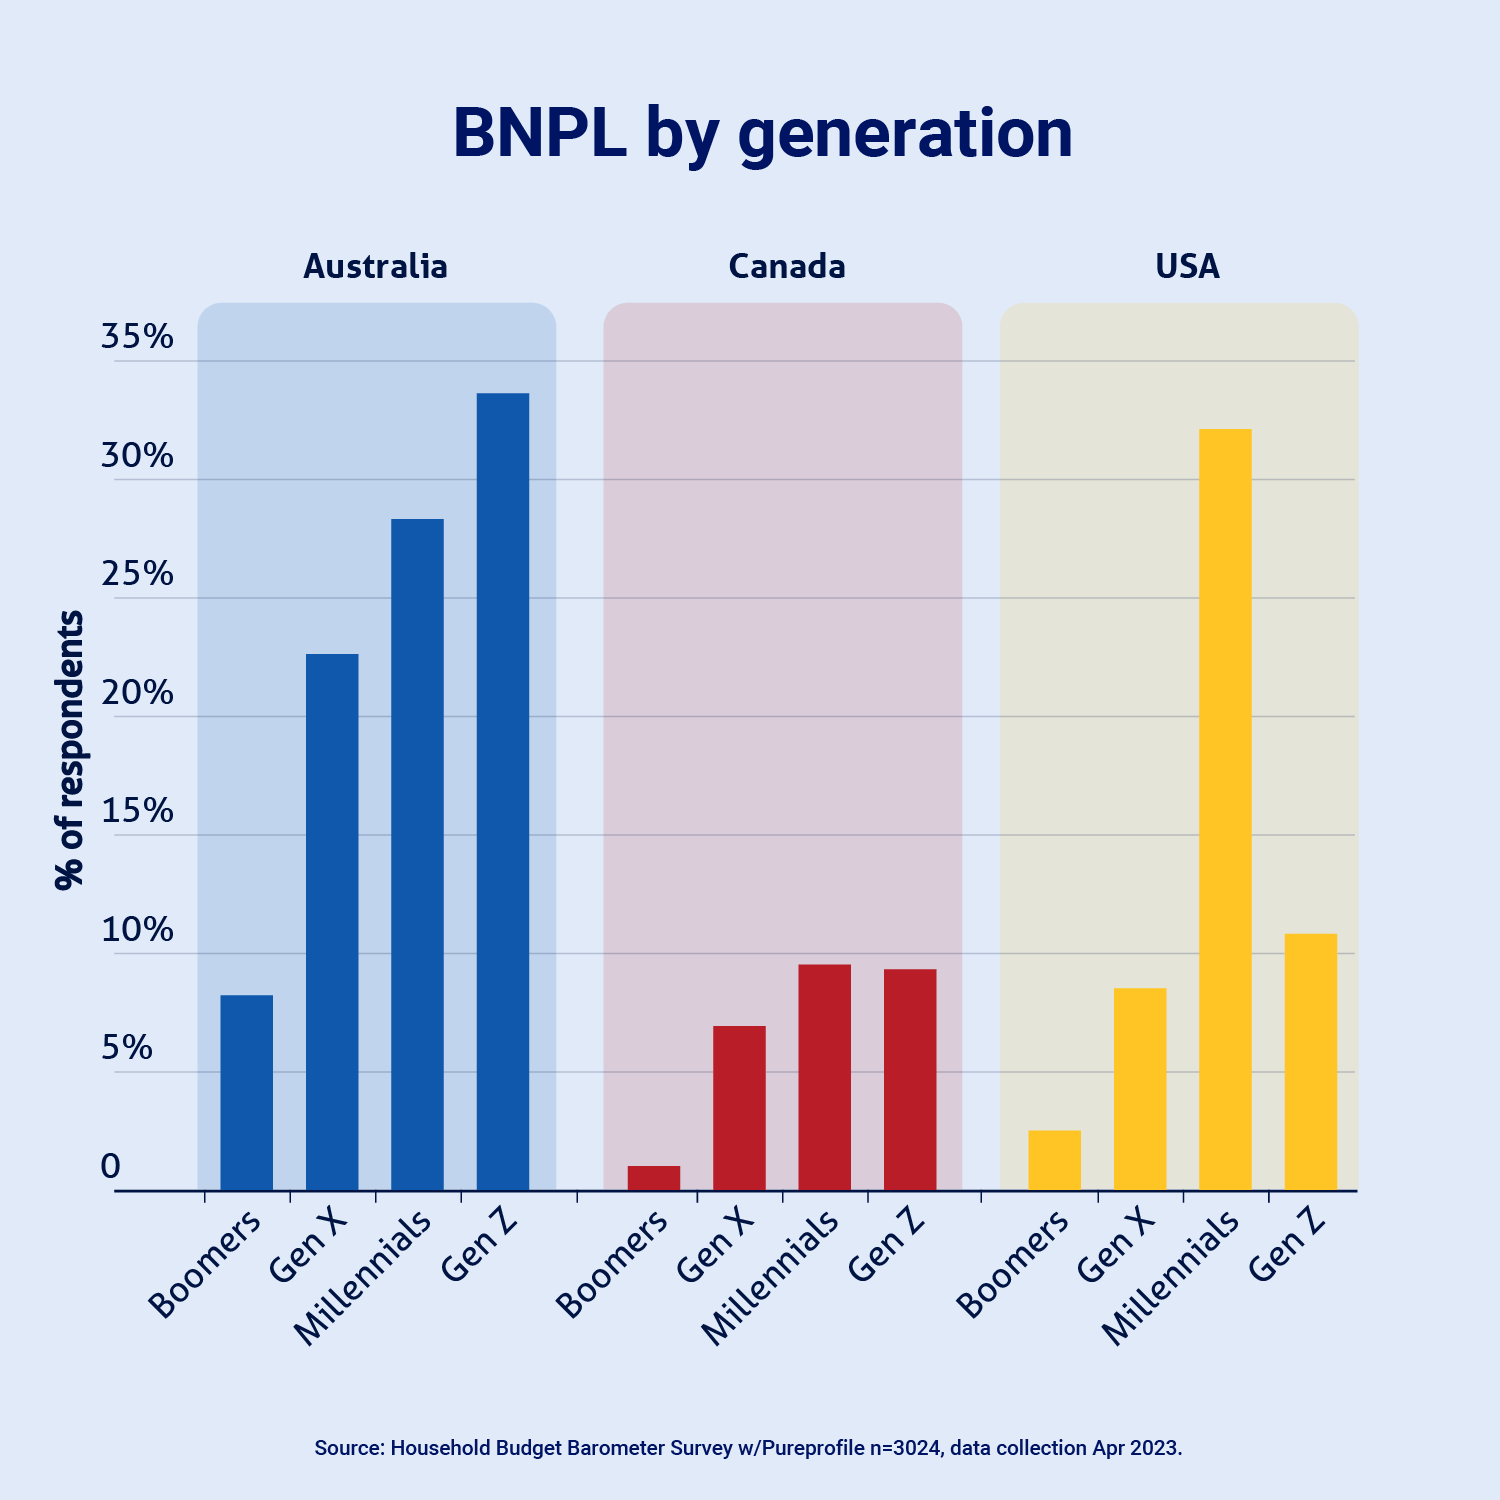
While less than a quarter of Australian respondents said they have debt in Buy Now Pay Later (BNPL) services, the country still ranks higher than America and Canada, where less than 14% said they have BNPL debt. The Australian age groups most likely to have BNPL debt are in perfect chronological order of age: Gen Z (34%), Millennials (28%), Gen X (23%) and Baby Boomers (8%).
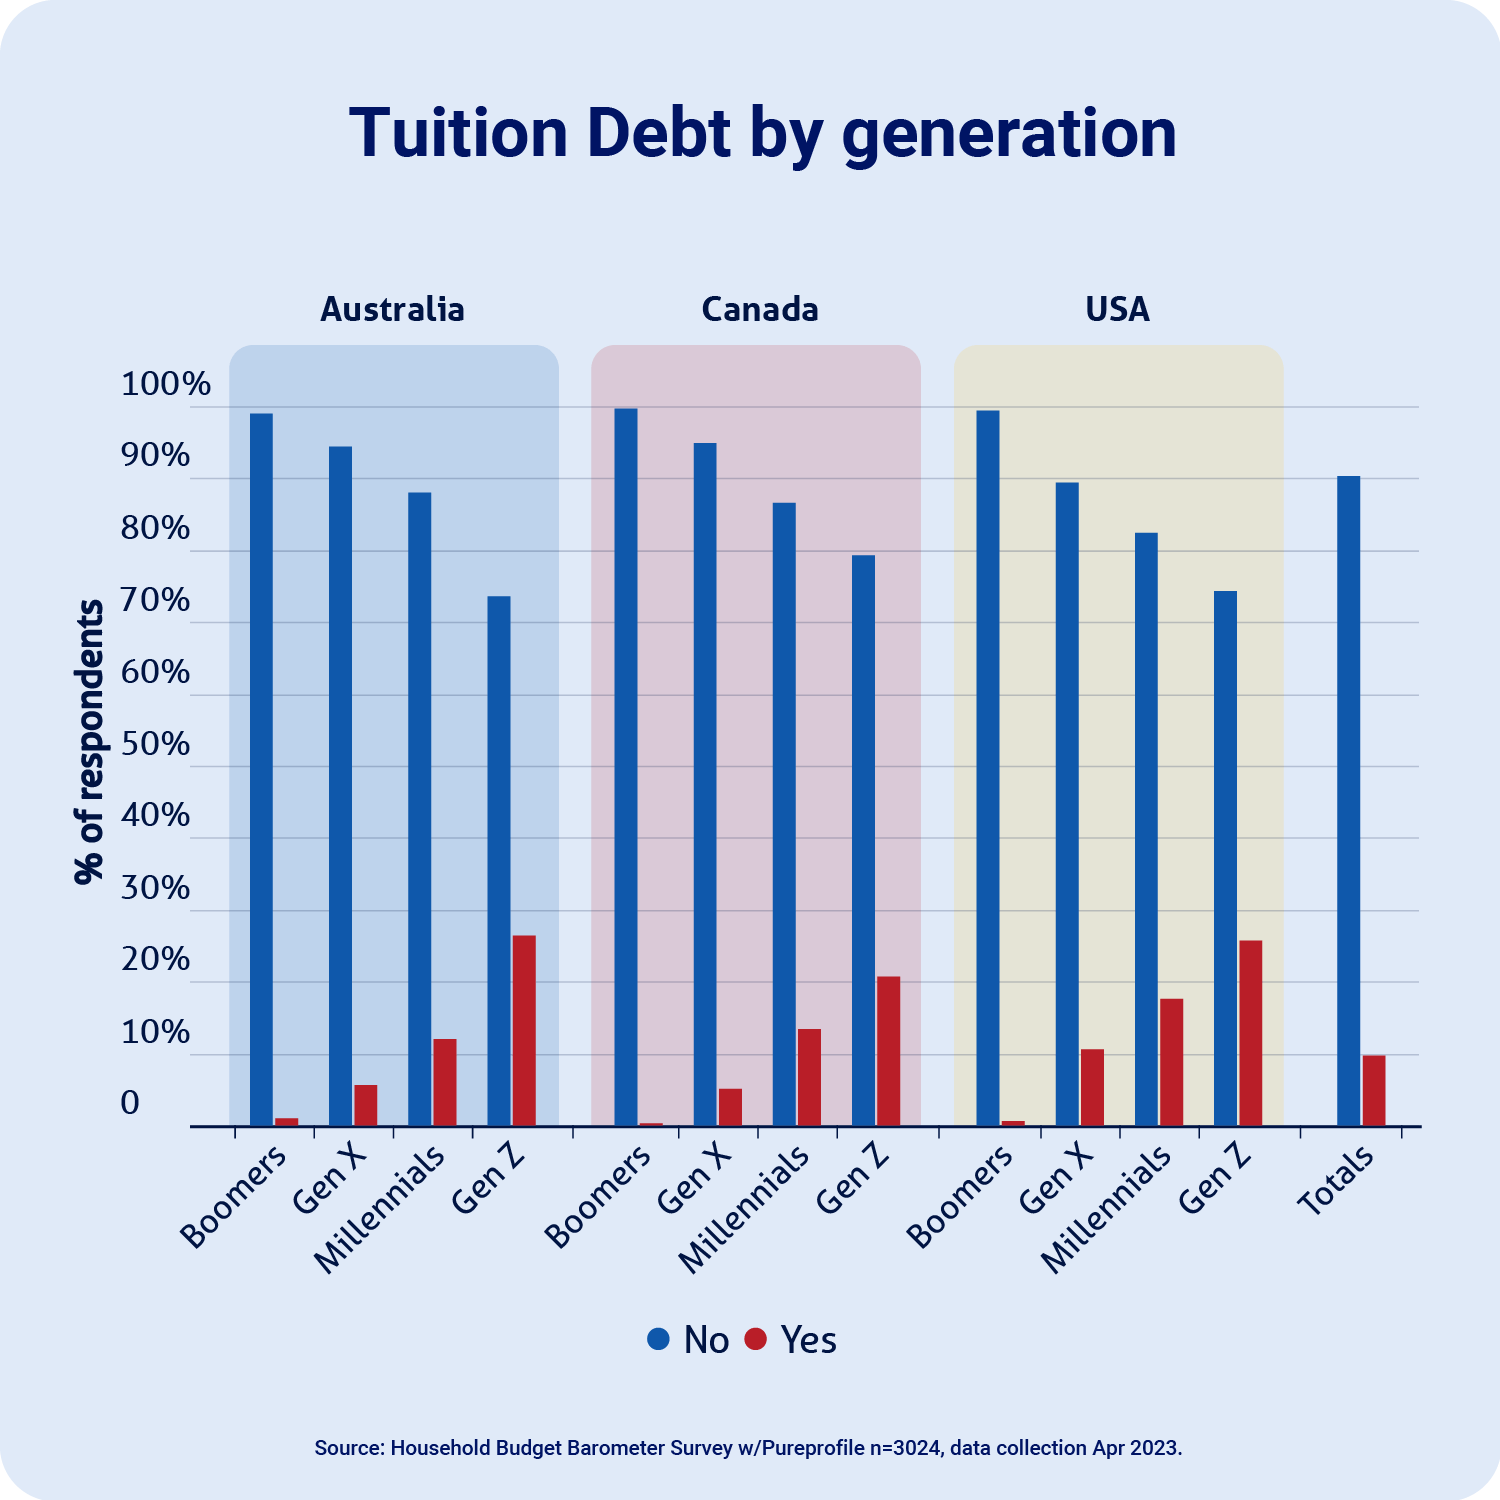
Student debt is a major weight on younger generations. Roughly 45 million Americans owe AU$2.45 trillion (US$1.6 trillion) in student debt, according to White House figures, while 3 million Australians have amassed a debt of AU$74.3 billion (US$48.3 billion), according to the Australian Tax Office.
Based on those numbers, the average student in America owes AU$54, 444 (US$35,424), while Australian students carry AU$24,770 on average (USD$16,108).
Our survey data show how the burden is split between generations.
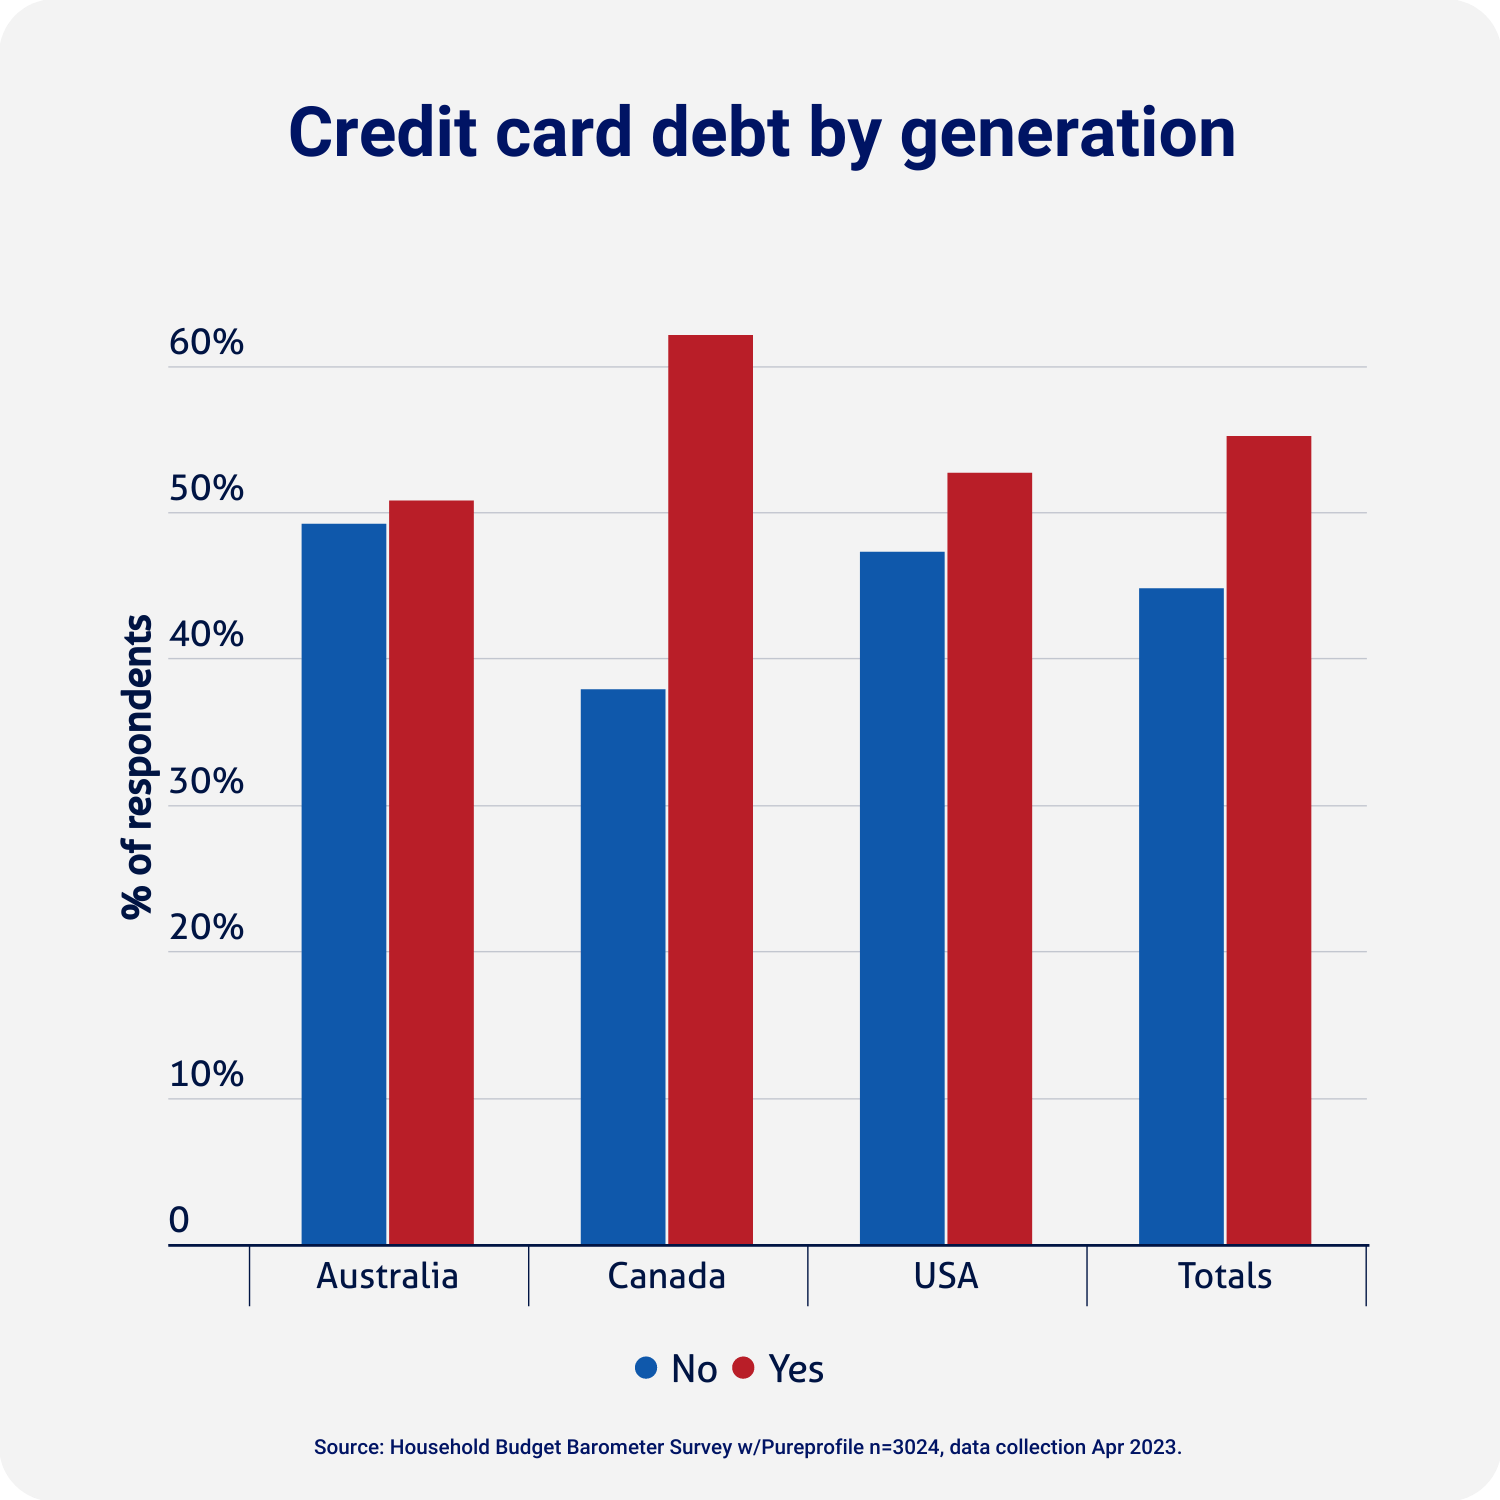
Even though more than half of Australians have credit card debt, only 25% would pay it off if they were given $500. Just over 35% of Australians would put the money into a bank account, while one in five (19%) would put it towards regular weekly expenses. The age group most likely to pay off debt is Gen X (33%), Millennials (26%), Baby Boomers (22%), followed by Generation Z (21%).
Meanwhile, more than 60% of Canadians said they had credit card debt. Millennials were the most likely generation to report this kind of debt (72%), followed by Gen X (62%), Gen Z (58%), and Baby Boomers (54%). The US results reveal a similar pattern: Millennials (60%), Gen X (58%), Gen Z (47%), and then Baby Boomers (46%).
Compare the Market’s General Manager of Money, Stephen Zeller, said there were signs the number of indebted households has been rising.
“Increased cost of living expenses, fuel, gas and energy prices have undoubtedly put strain on the budget belt of many Australian households,” Mr Zeller said.
“In December 2022, the number of arrears was 0.76%, up from 0.65% in November 2022.
“But borrowers aren’t the only ones who are feeling the pressure at the hip pocket.
“Tenants have been slapped with higher rental prices as landlords have attempted to pass on the heat.”

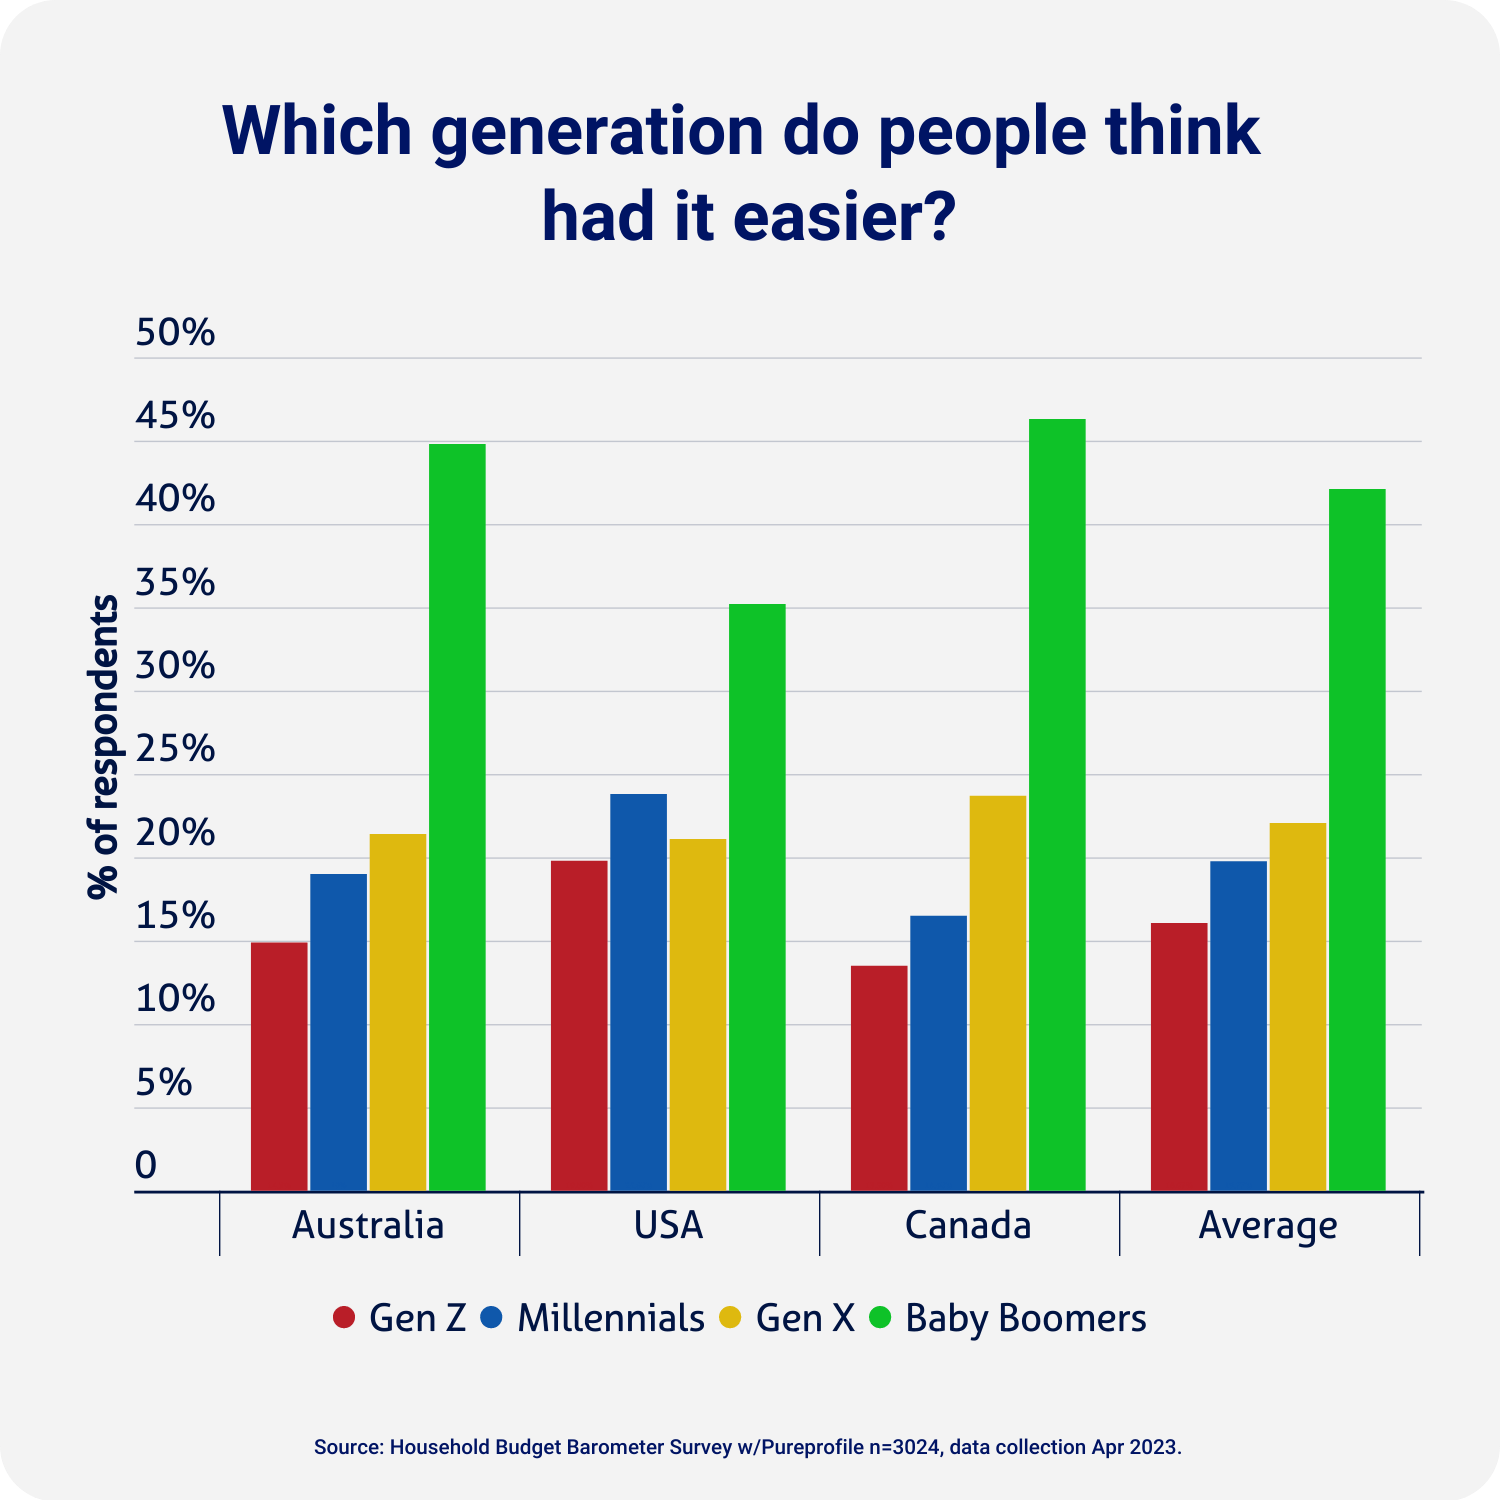
The age-old question

The debate over whether older generations faced unfair advantages to purchase property has soured family gatherings throughout the world.
The answer is complex.
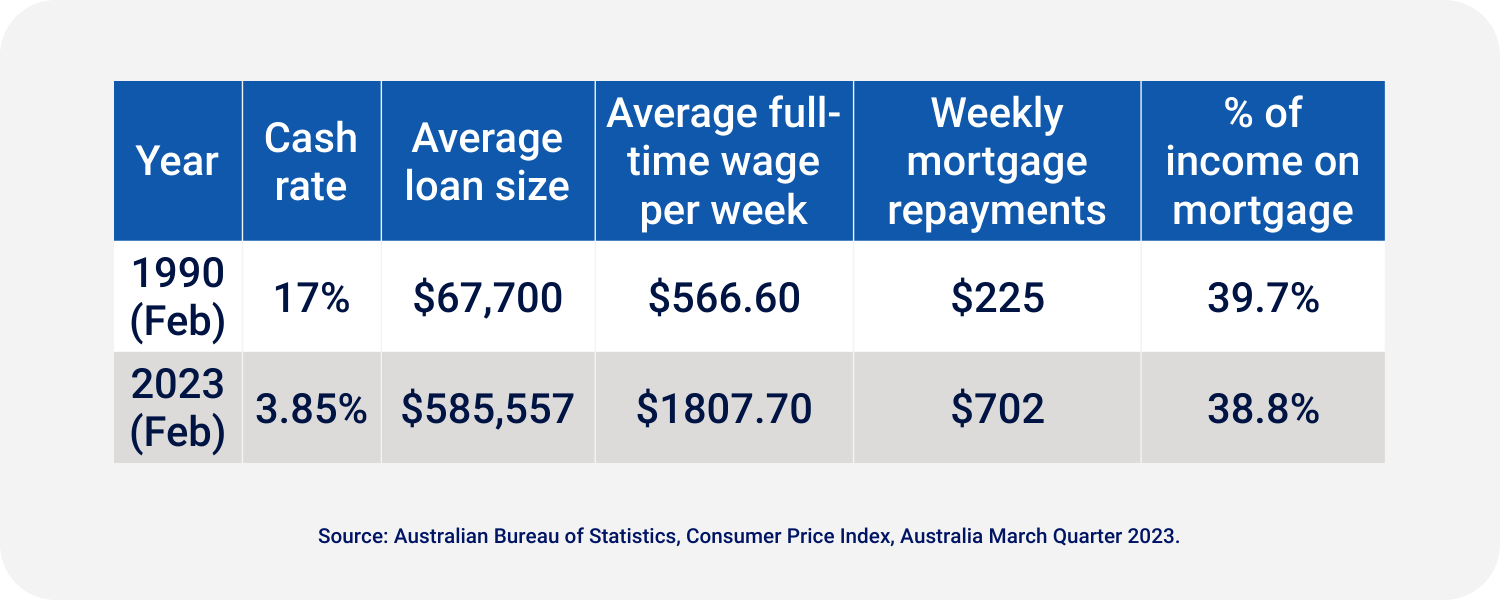
Baby Boomers and Gen Xers faced different hurdles to homeownership, with the Australian cash rate sitting at 17% in 1990 and the average mortgage size for owner-occupiers just under $68,000.
Fast forward to February 2023, now the cash rate is 3.85% and the average loan is $585,557, according to the Australian Bureau of Statistics (ABS).
The nation’s average annual wage has also more than tripled since the ‘90s when the average Australian full-time worker earned $566.60 per week. According to ABS data, the average full-time adult worker now earns $1,807.70 a week, or $94,000 annually.
While much has changed, the percentage of income needed to make repayments on a home in 1990, and in 2023, is roughly the same.
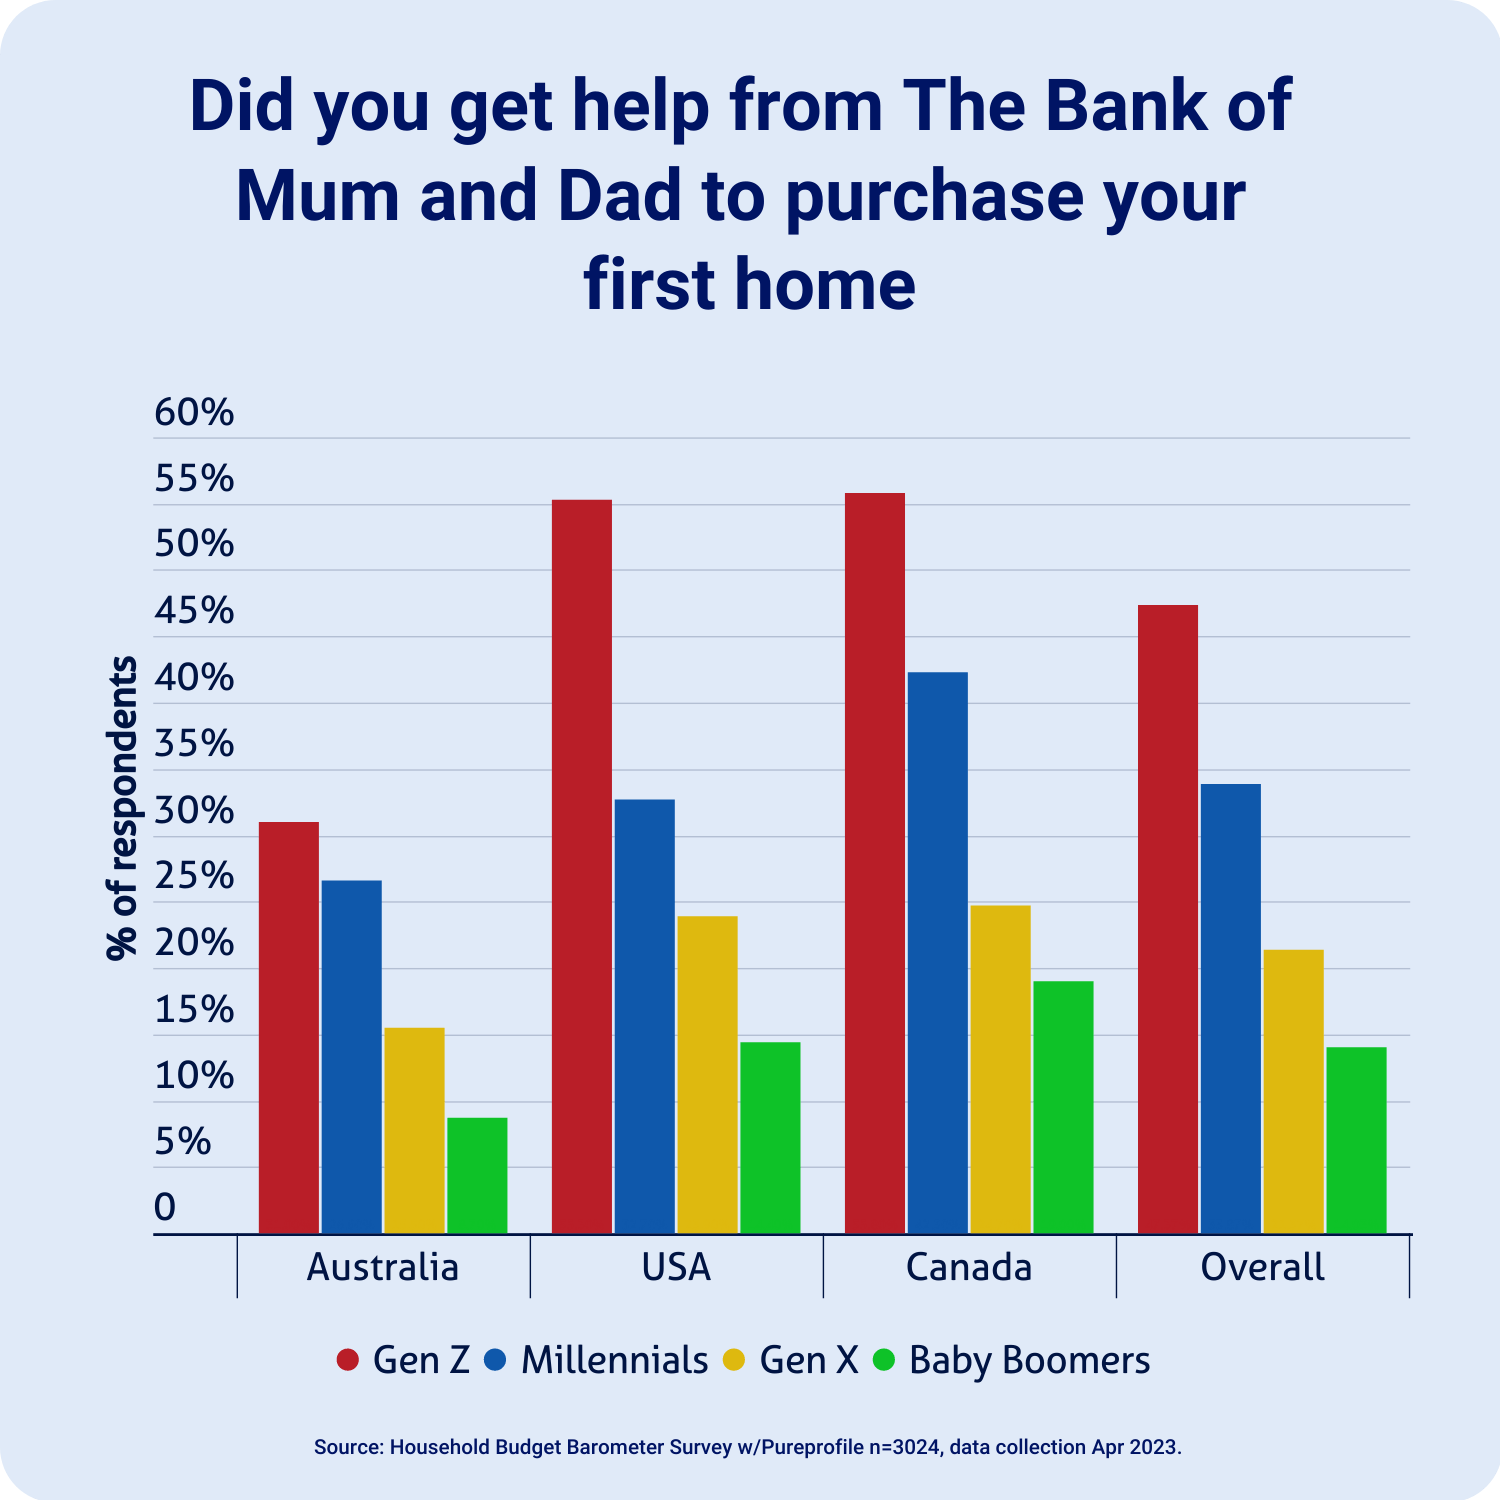
Millennials and Gen Z were more likely to get help from their parents and family to purchase their first home than their older counterparts. More than 30% of Gen Z and 26% of Millennials say their family helped contribute to the deposit.
Meanwhile, more than 50% of Gen X and Baby Boomers say they had no help from family members whatsoever. The age group that said they were solely responsible for the purchase of their first home were Gen X (41%), Baby Boomers (35%), Millennials (22%), then Gen Z (14%).
Compare the Market’s General Manager of Money, Stephen Zeller said the rising cost of house prices meant saving for a deposit could be more difficult for young people today.
“Juggling the rising cost of rent, with inflationary pressures, would make it undoubtedly difficult to save for anything, let alone a deposit,” Mr Zeller said.
“It’s not surprising more parents are helping their children cross that first hurdle. But not all parents have capacity to support their children’s deposit. We may see a greater wealth gap in the years to come.”
Who is feeling the pinch?

The financial pressures of continued inflation and cash rate rises to control inflation are beginning to show in the spending and saving habits of Australians and North Americans alike.
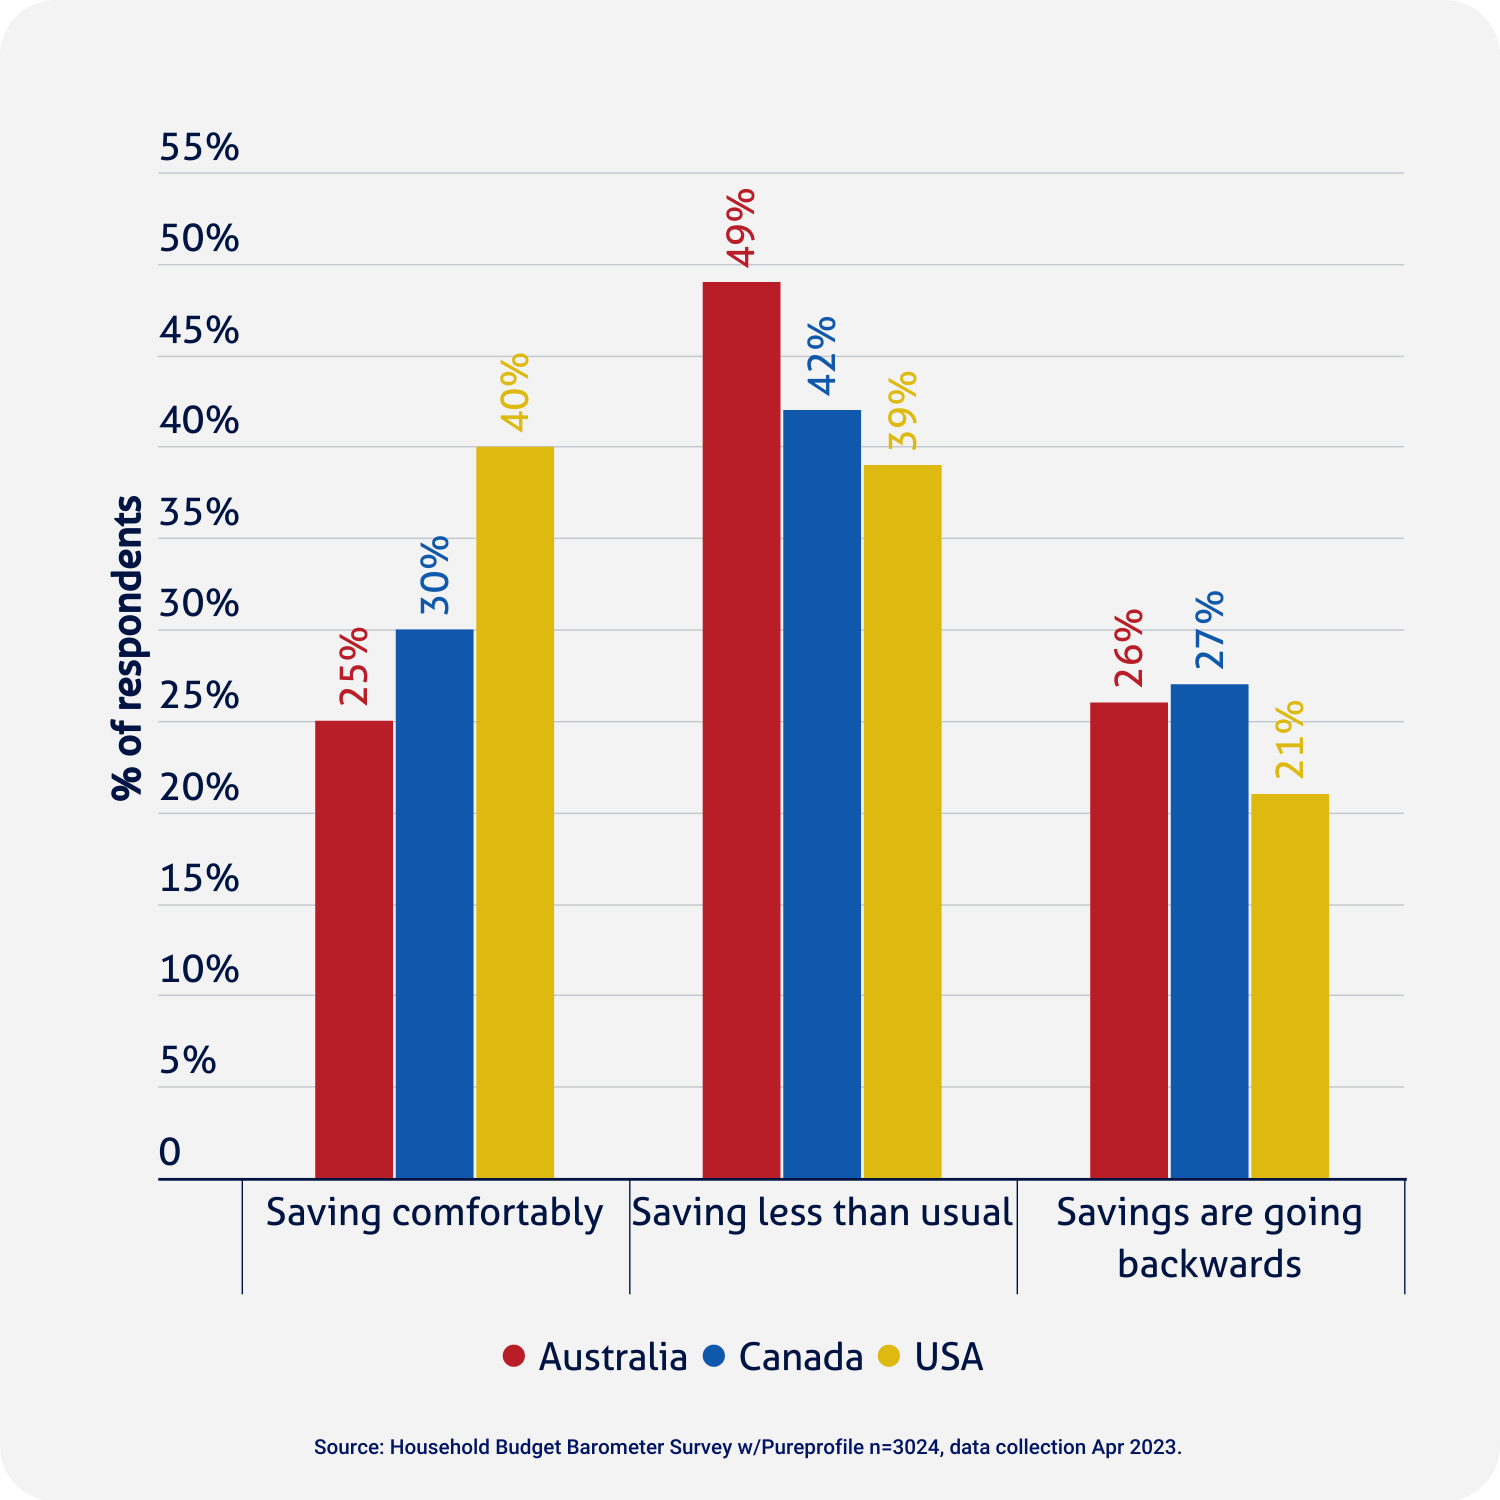
Almost half of all Australians are saving less than usual, with over a quarter of people dipping into their savings to pay for necessities.
While a good number of people have been able to save over the last year, figures are worrying for the number of people reaching into their savings to help support their weekly essentials.
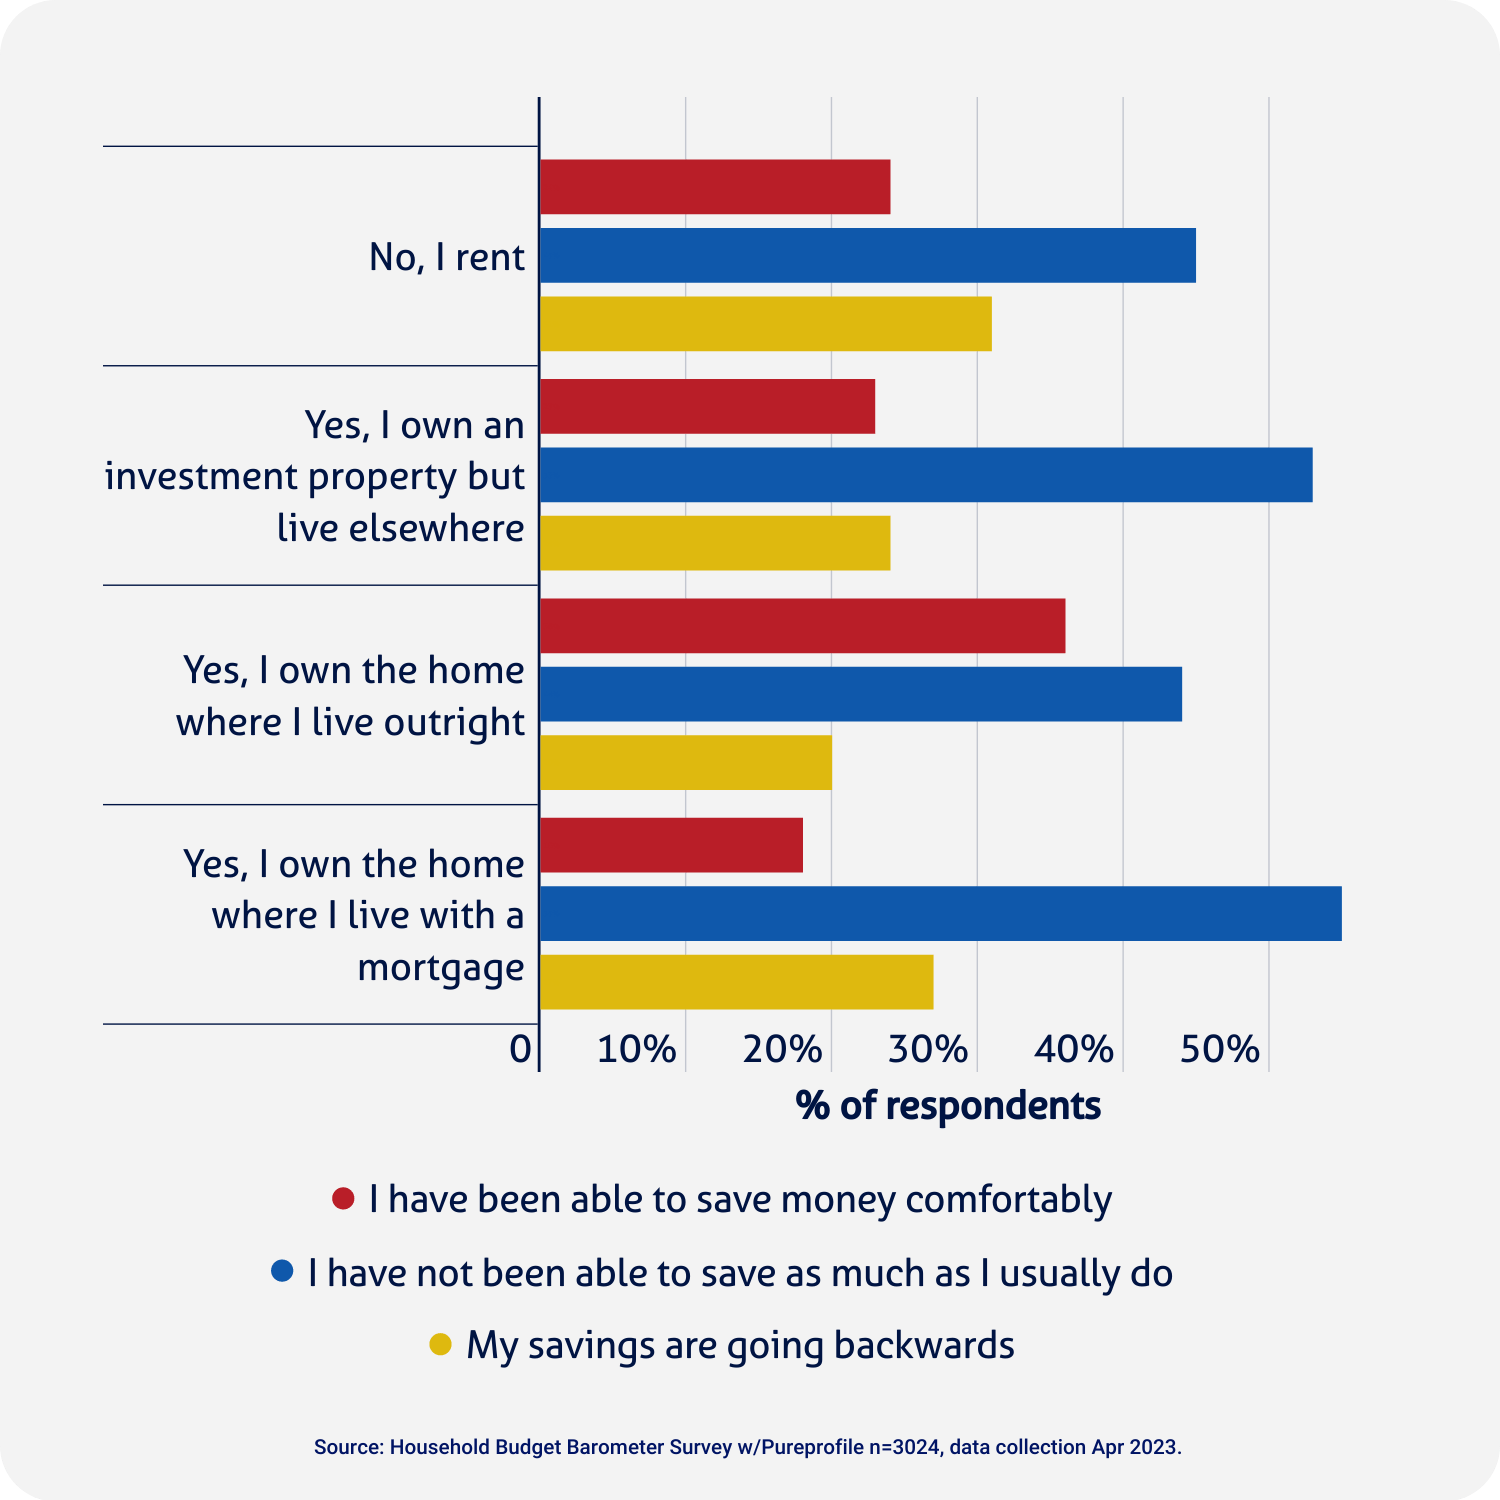
Almost a third of renters across all three countries say that their savings are going backwards.
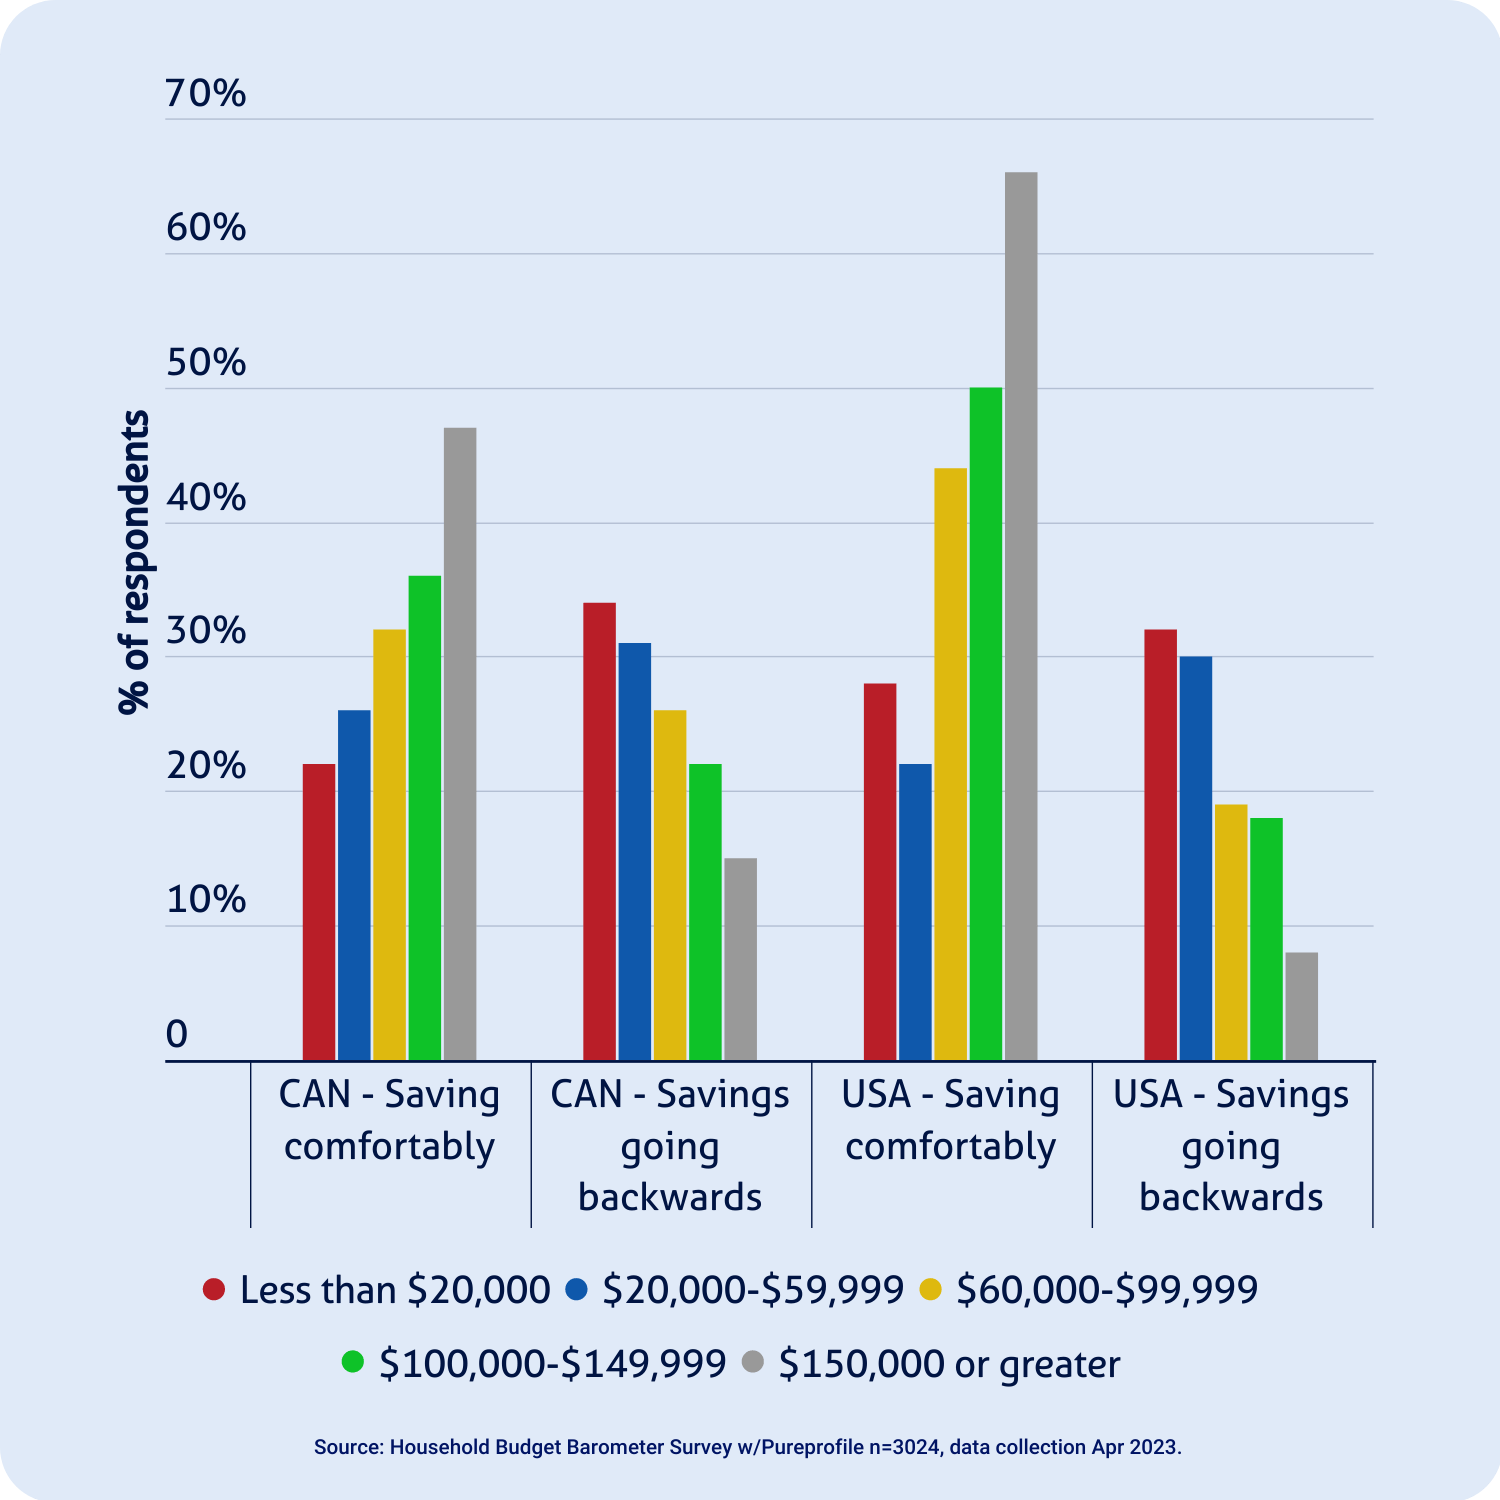
For those with a property, homeowners with a mortgage are the least likely to save comfortably. Surprisingly, 86% of investors in Canada admit that their savings are depleting, compared to just a quarter of homeowners with a mortgage experiencing saving difficulties in Australia and America.
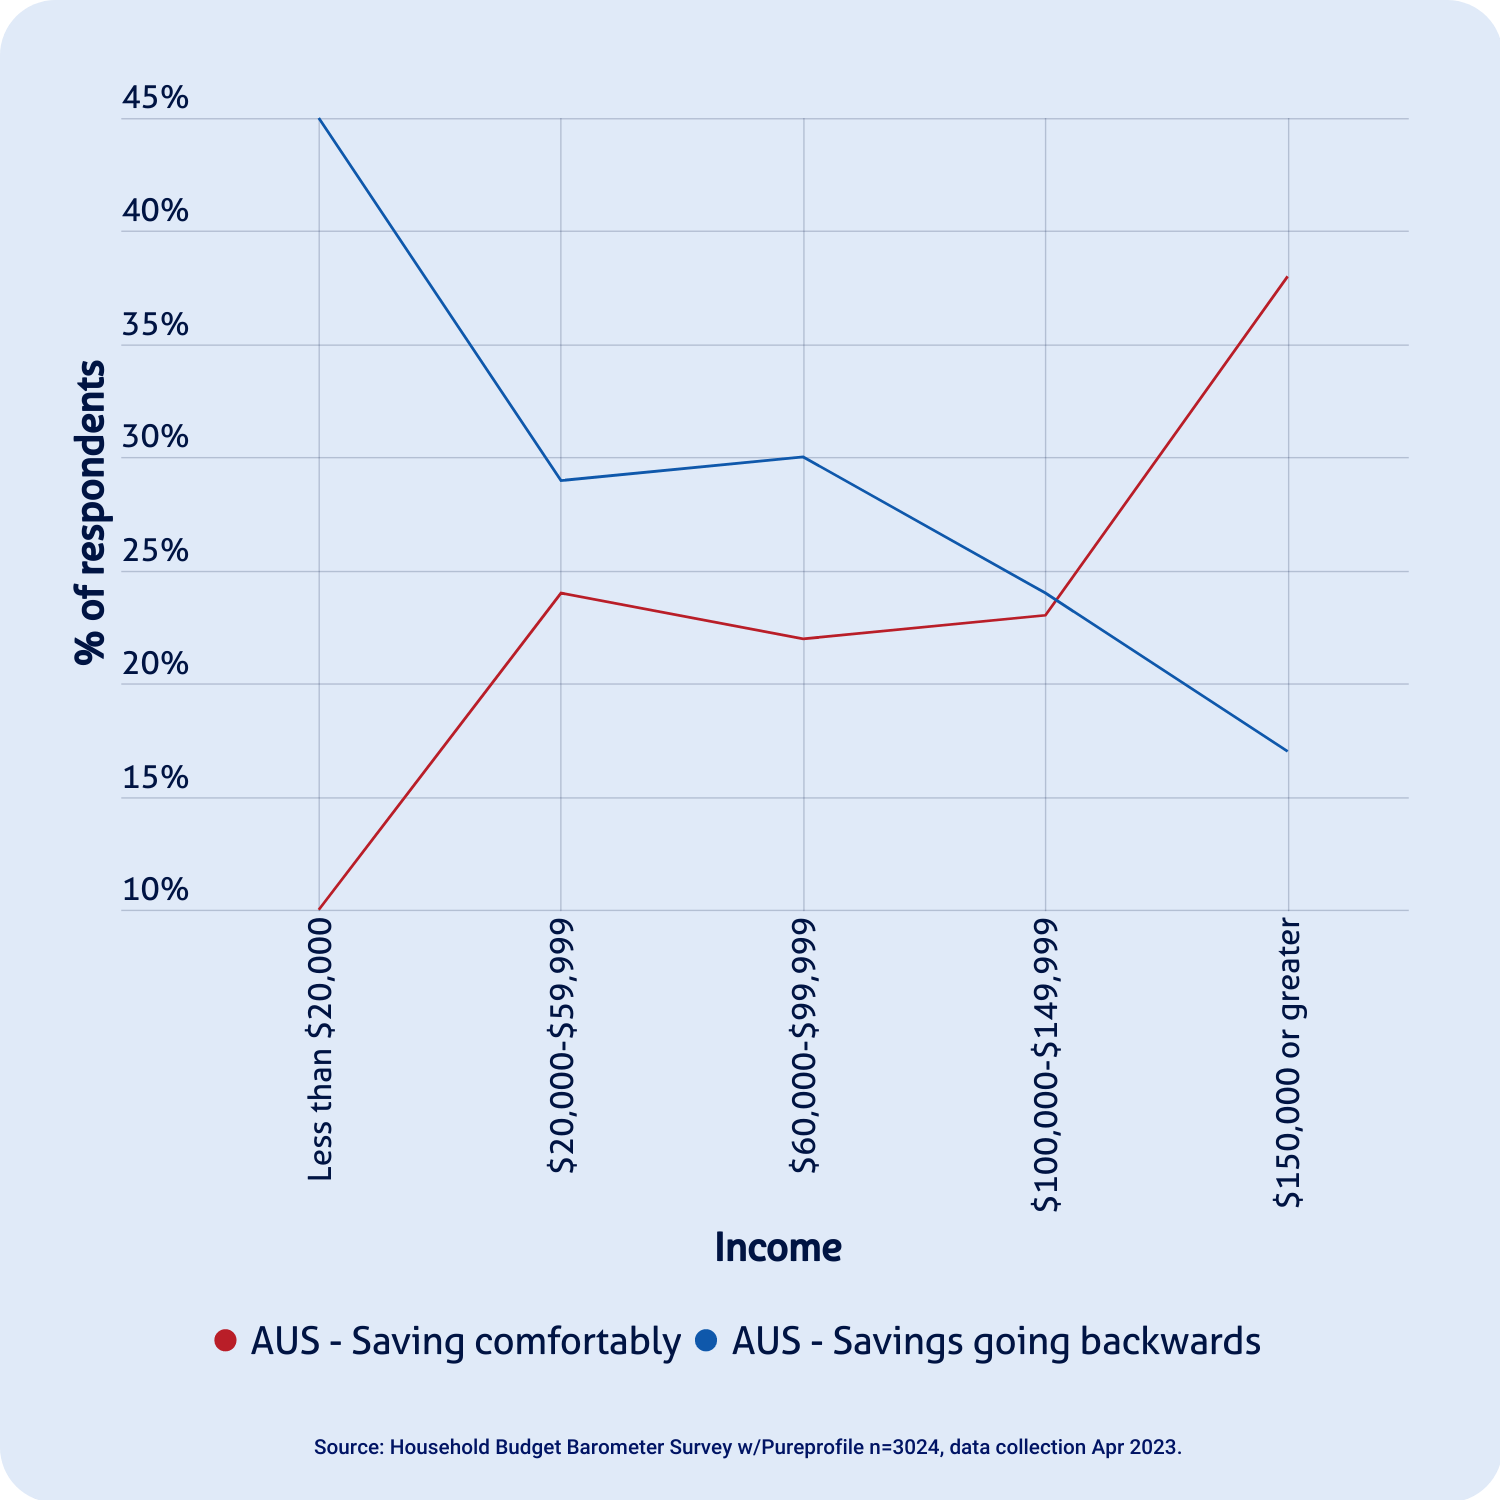
Unsurprisingly, there’s a clear trend emerging across Australia and North America, where high-income earners were able to continue saving comfortably over the past year, whereas low-income earners were more likely to see their savings depleting.
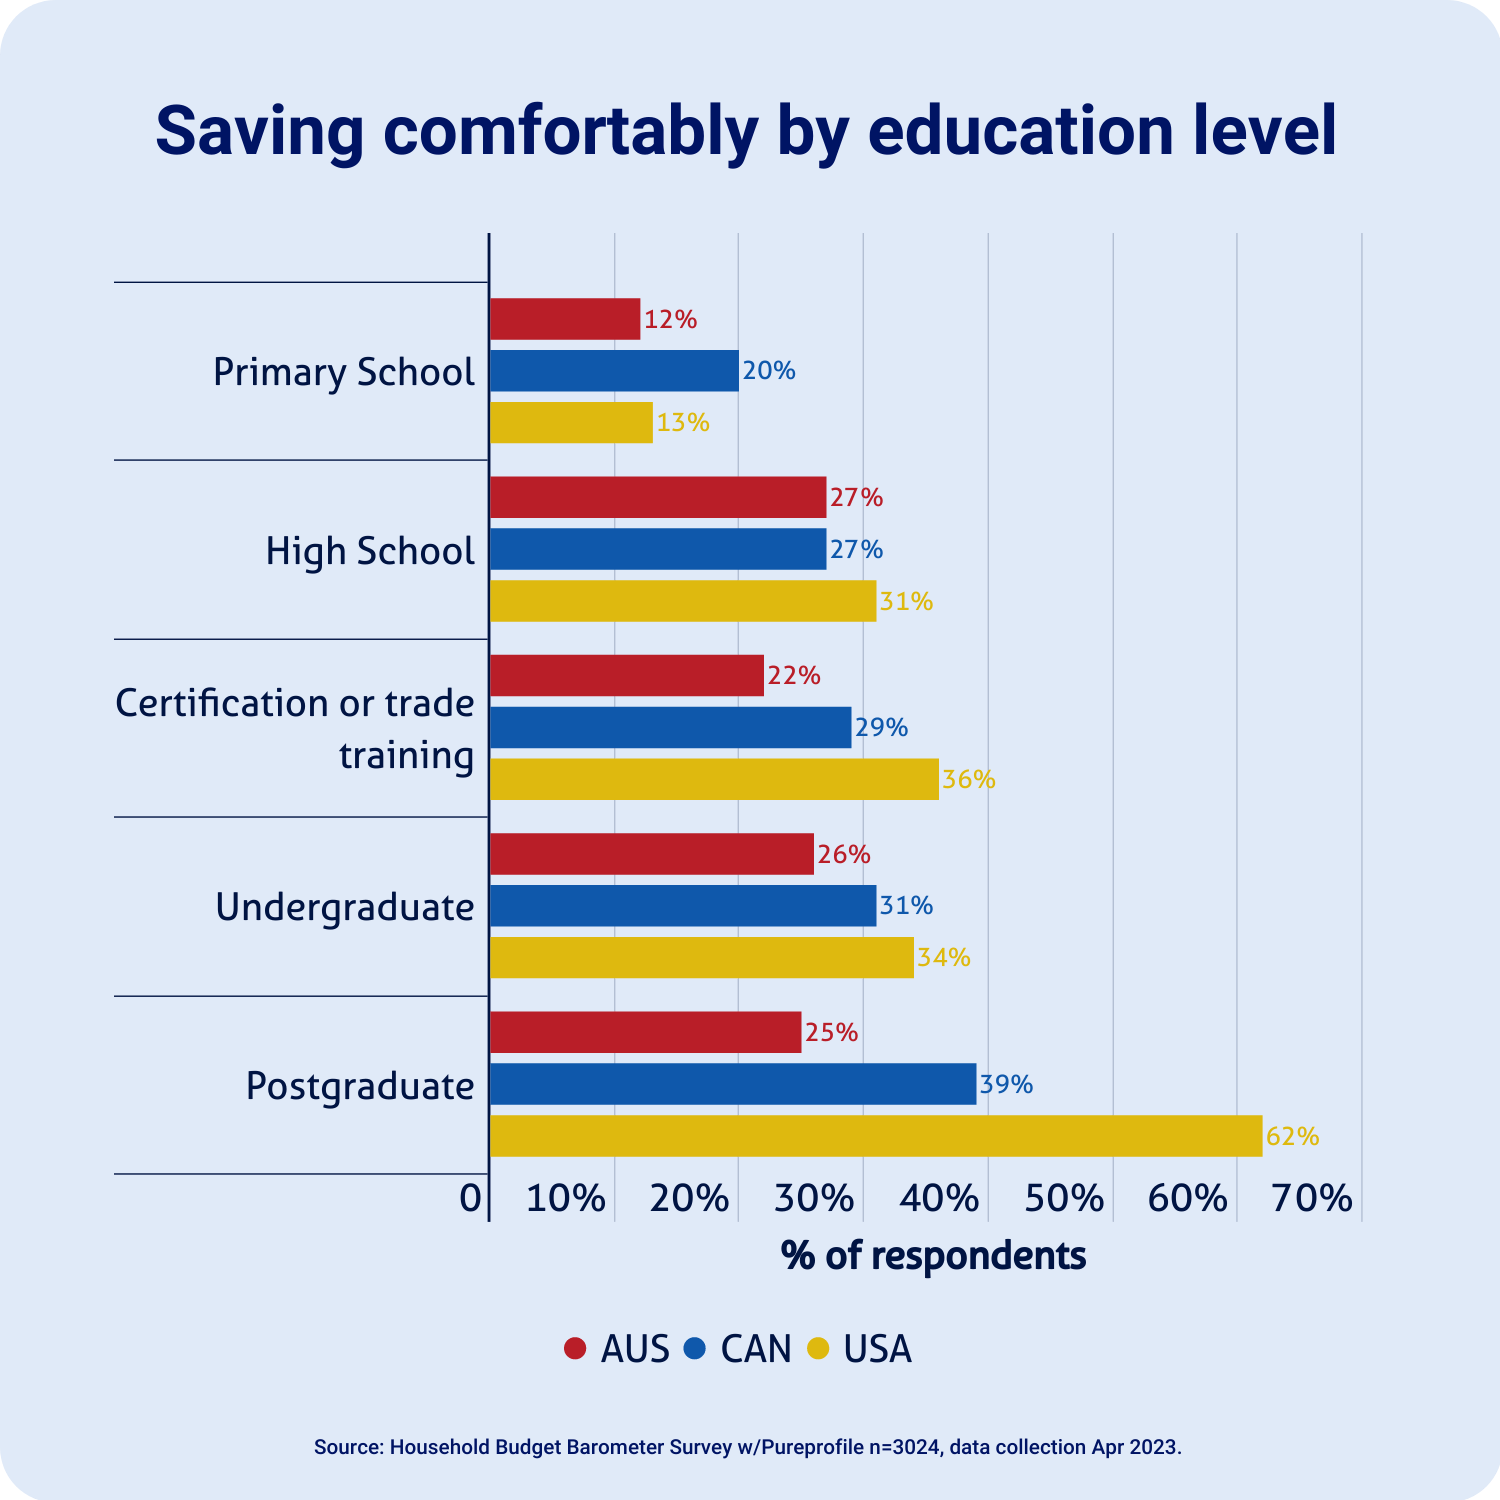
While salary is a clear driver between the savings people are able to put aside, this isn’t the case for education, at least not in Australia.
However, in North America, people who have either an undergraduate or postgraduate degree were more likely to continue saving comfortably, as opposed to those with a trade certification or general education level.
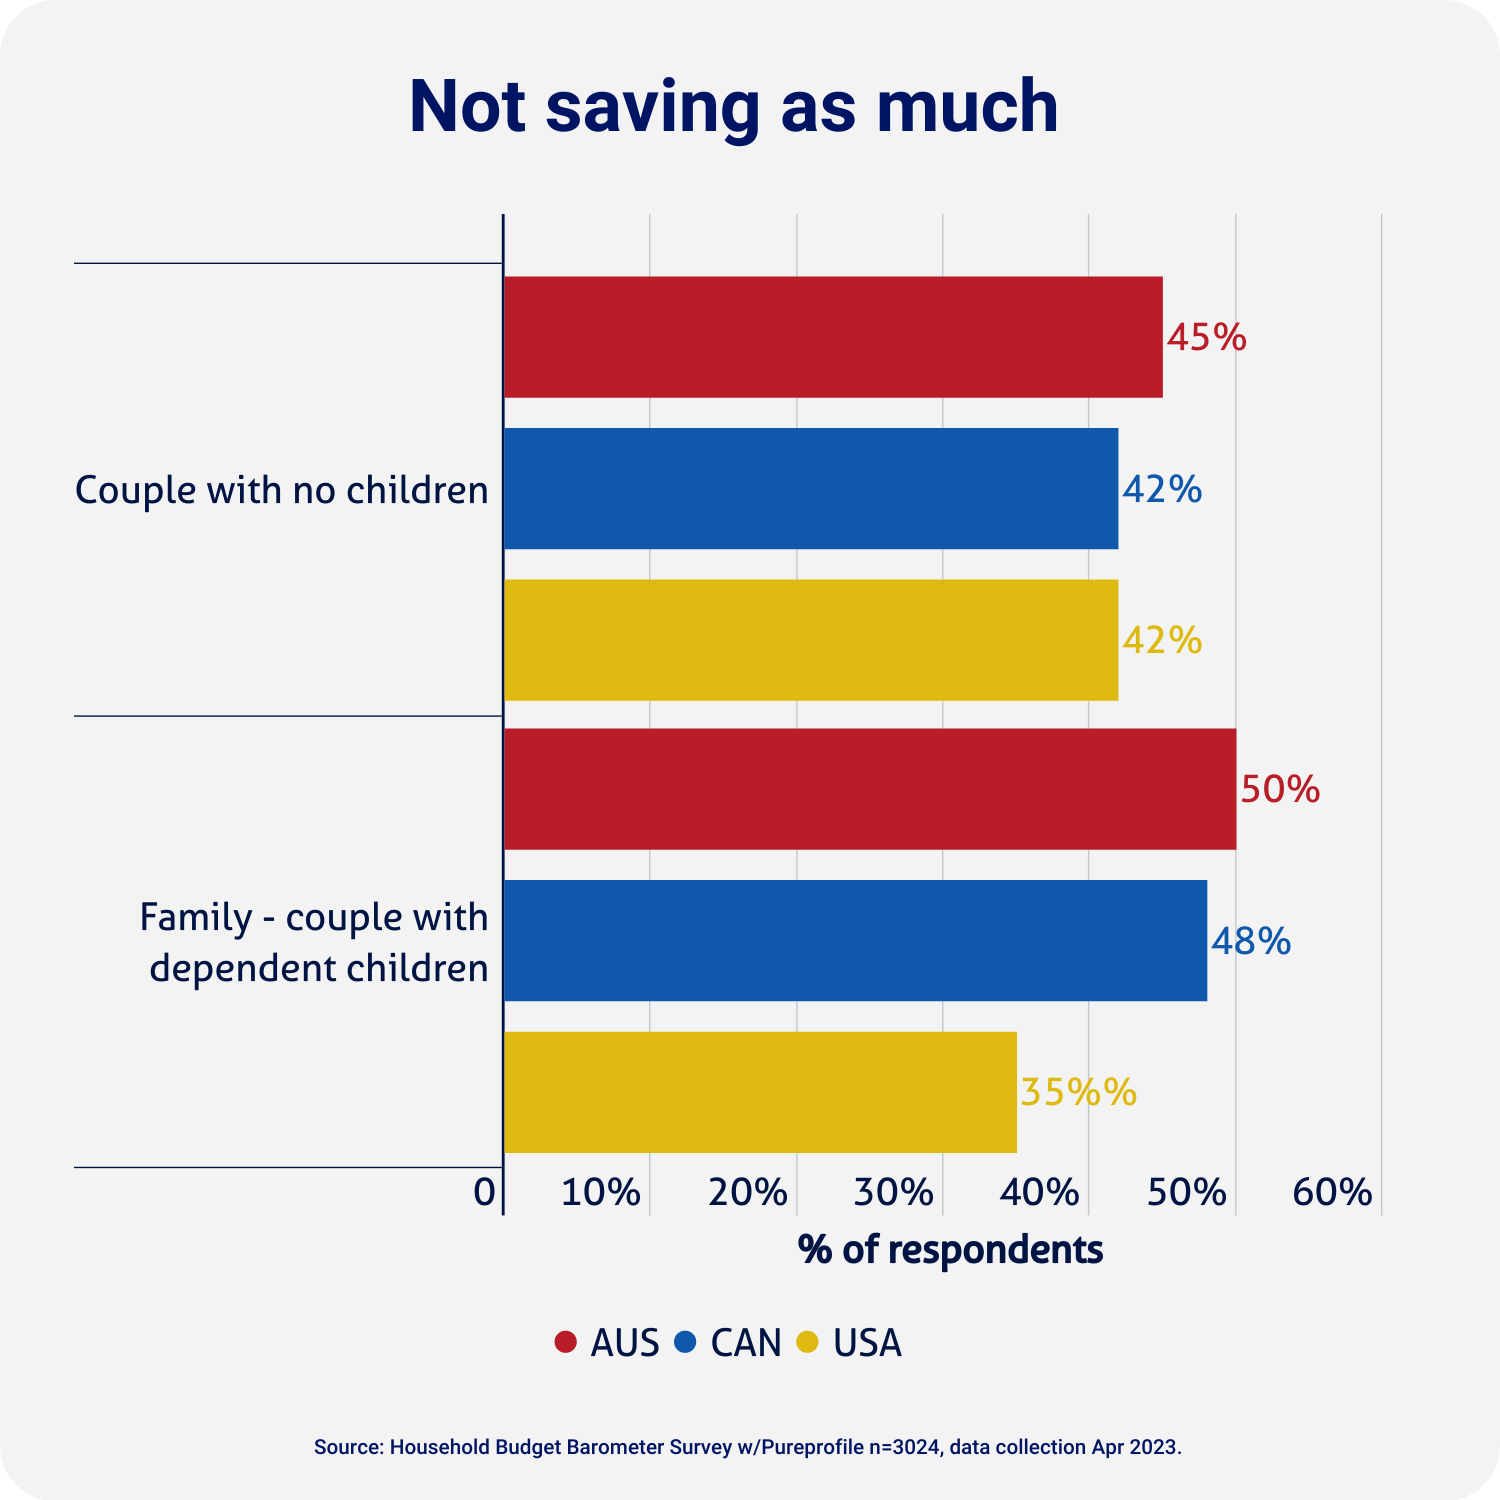
Most families or single parents with dependent or independent children stated that they weren’t able to save as much as they usually do, with this becoming more apparent across single parents with children across all three countries.
Other key insights:
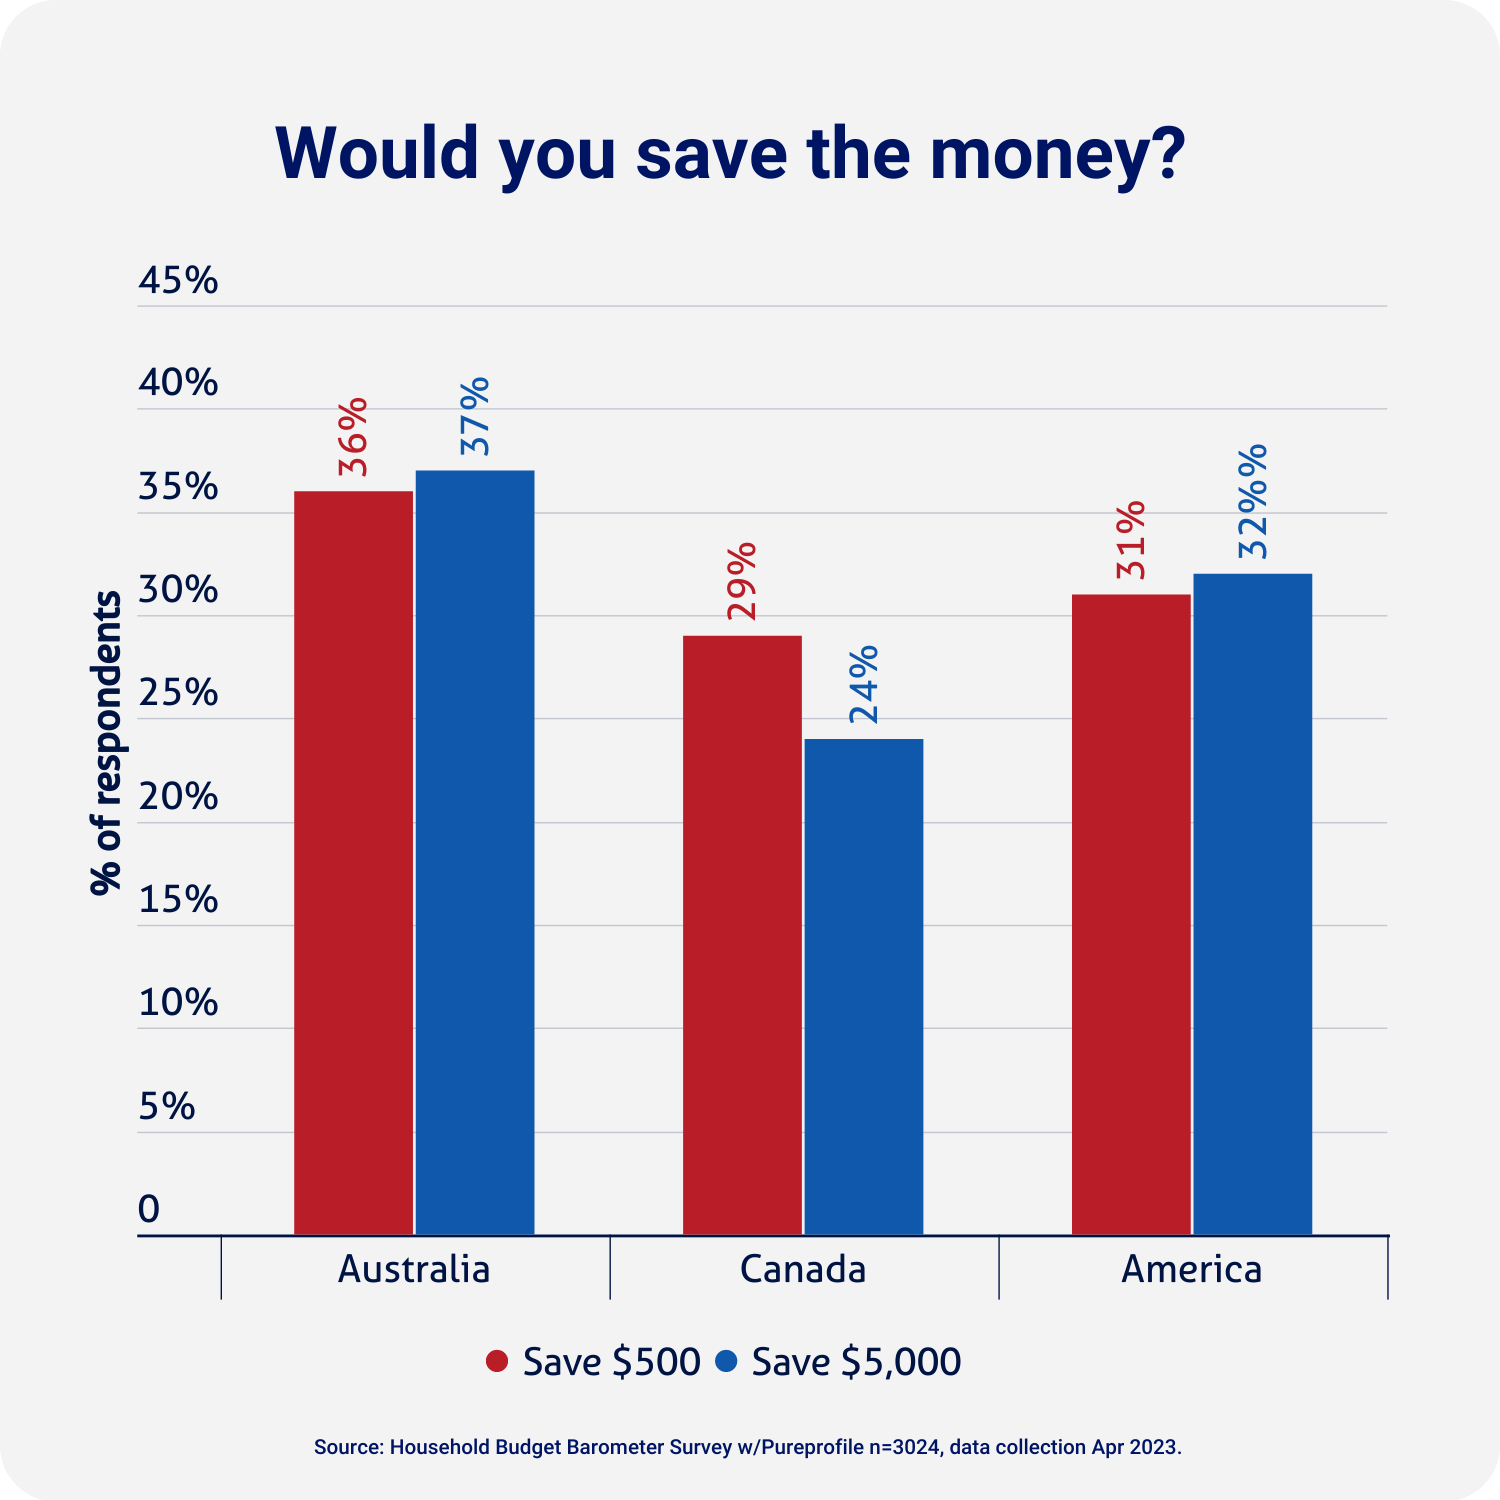
Asked what they would do if gifted $500, Australians were more likely to deposit the money in their savings account than Canadians and Americans.
There was little variation in results when the number was boosted to $5,000, suggesting the decision to save is often based on bigger life goals.
When it comes to generations though, Baby Boomers were the most likely to save the money across all three countries if any amount was given to them.
“It’s clear to see that the current economic climate is putting a lot of pressure on households across Australia and North America,” Mr Zeller said.
“While many households have been able to save, more people have been putting aside less money or dipping into their savings to make ends meet.”
By nationality, generation and education

Less than a fifth of Australians stick to a budget that they set for their household finance. This figure is slightly better for Canadians, where 21% stick to their budget, however, Americans are clearly leading the way, with almost a third of respondents sticking to their monetary commitments.
Mr Zeller said that it’s worrying to see so many people either not sticking to a budget or not even attempting to make one.
“In the current economic climate, where people are struggling to save, and even dip into their nest eggs to meet day-to-day financial needs, budgeting is a really simple way to ensure that there’s not a cent misspent in the household budget,” Mr Zeller said.
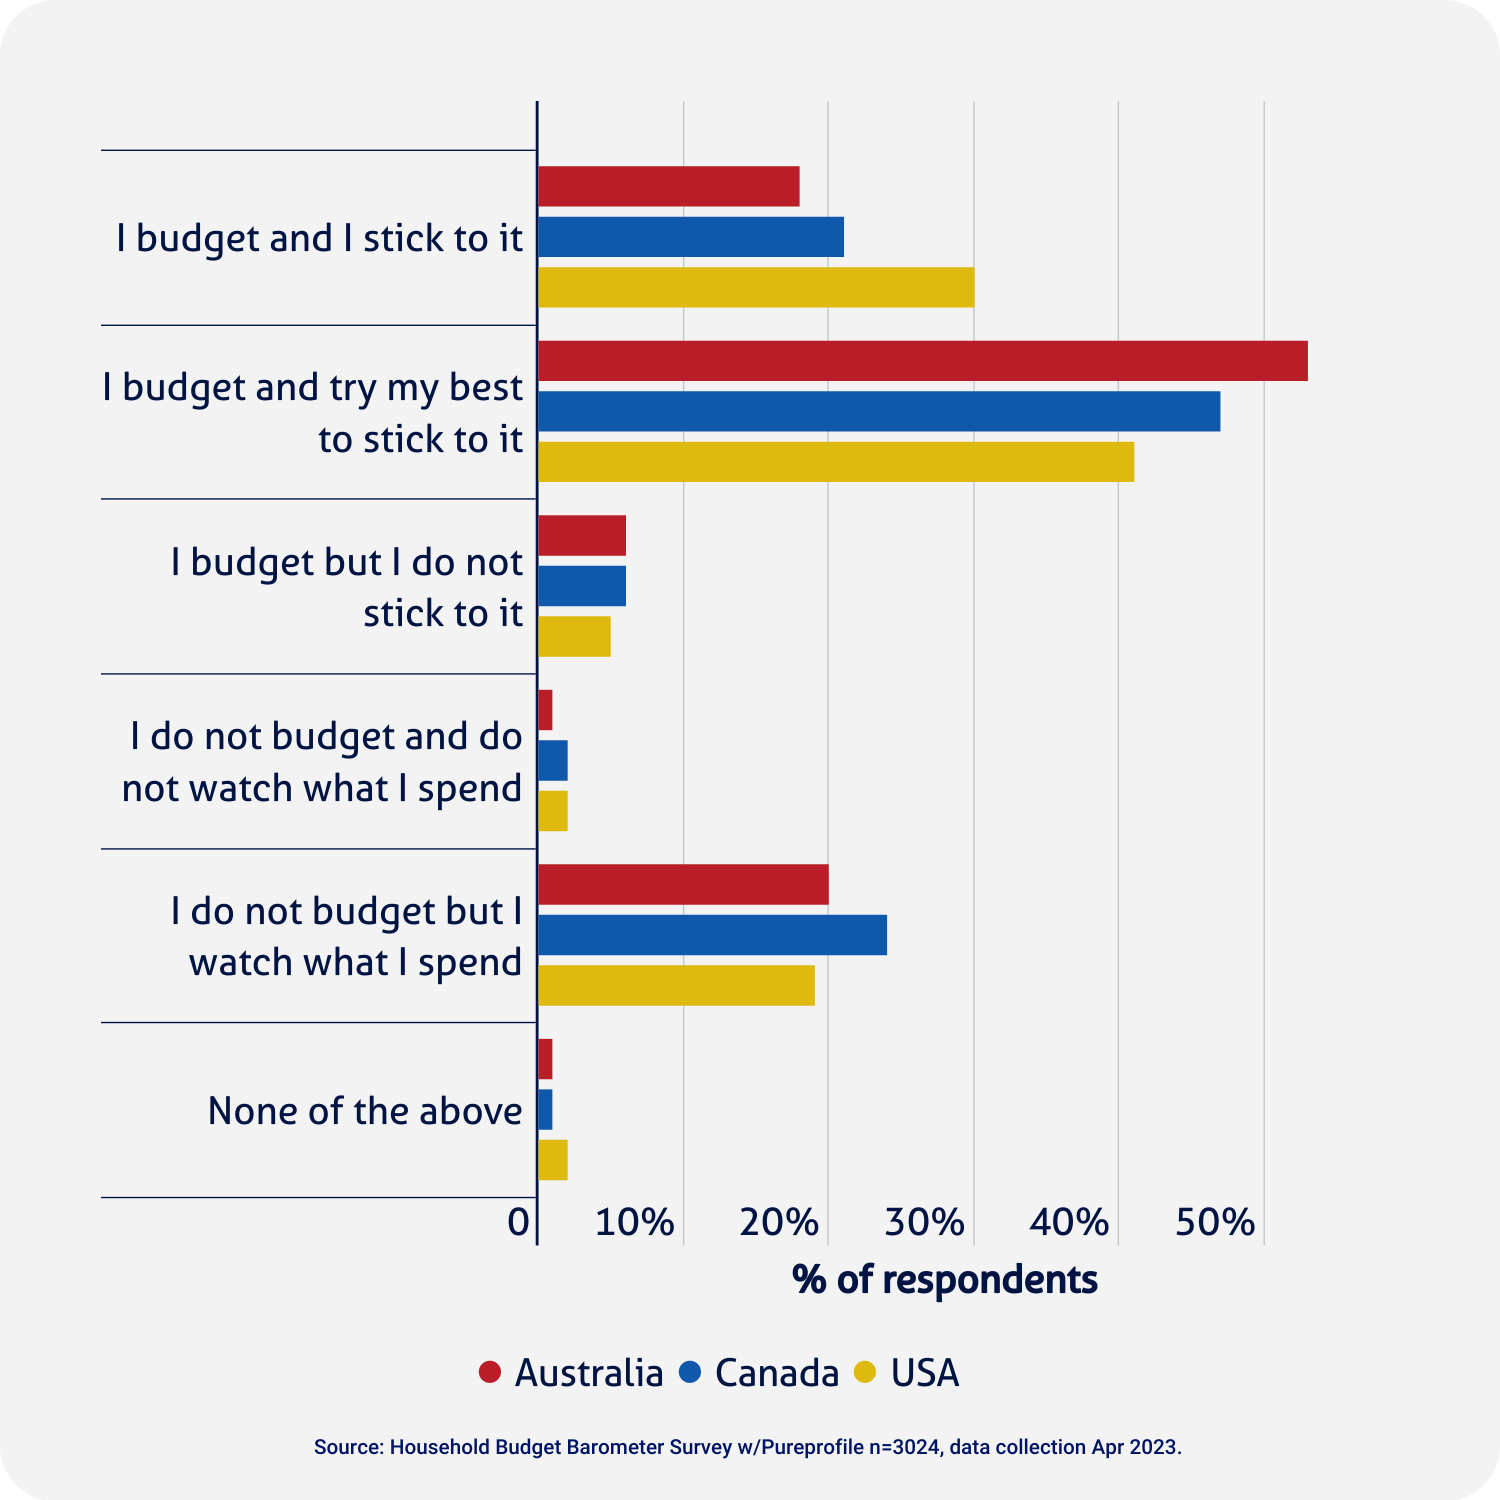
Not all Baby Boomers are the same, as shown by the fact that Australian Boomers are the most likely to budget and stick to it (20%). Meanwhile, North American Boomers are the most likely out of all the generations to not budget but keep an eye on spending.
Gen Z reigns supreme as the masters of budgets in Canada, with one-in-three sticking with their predetermined budgets.
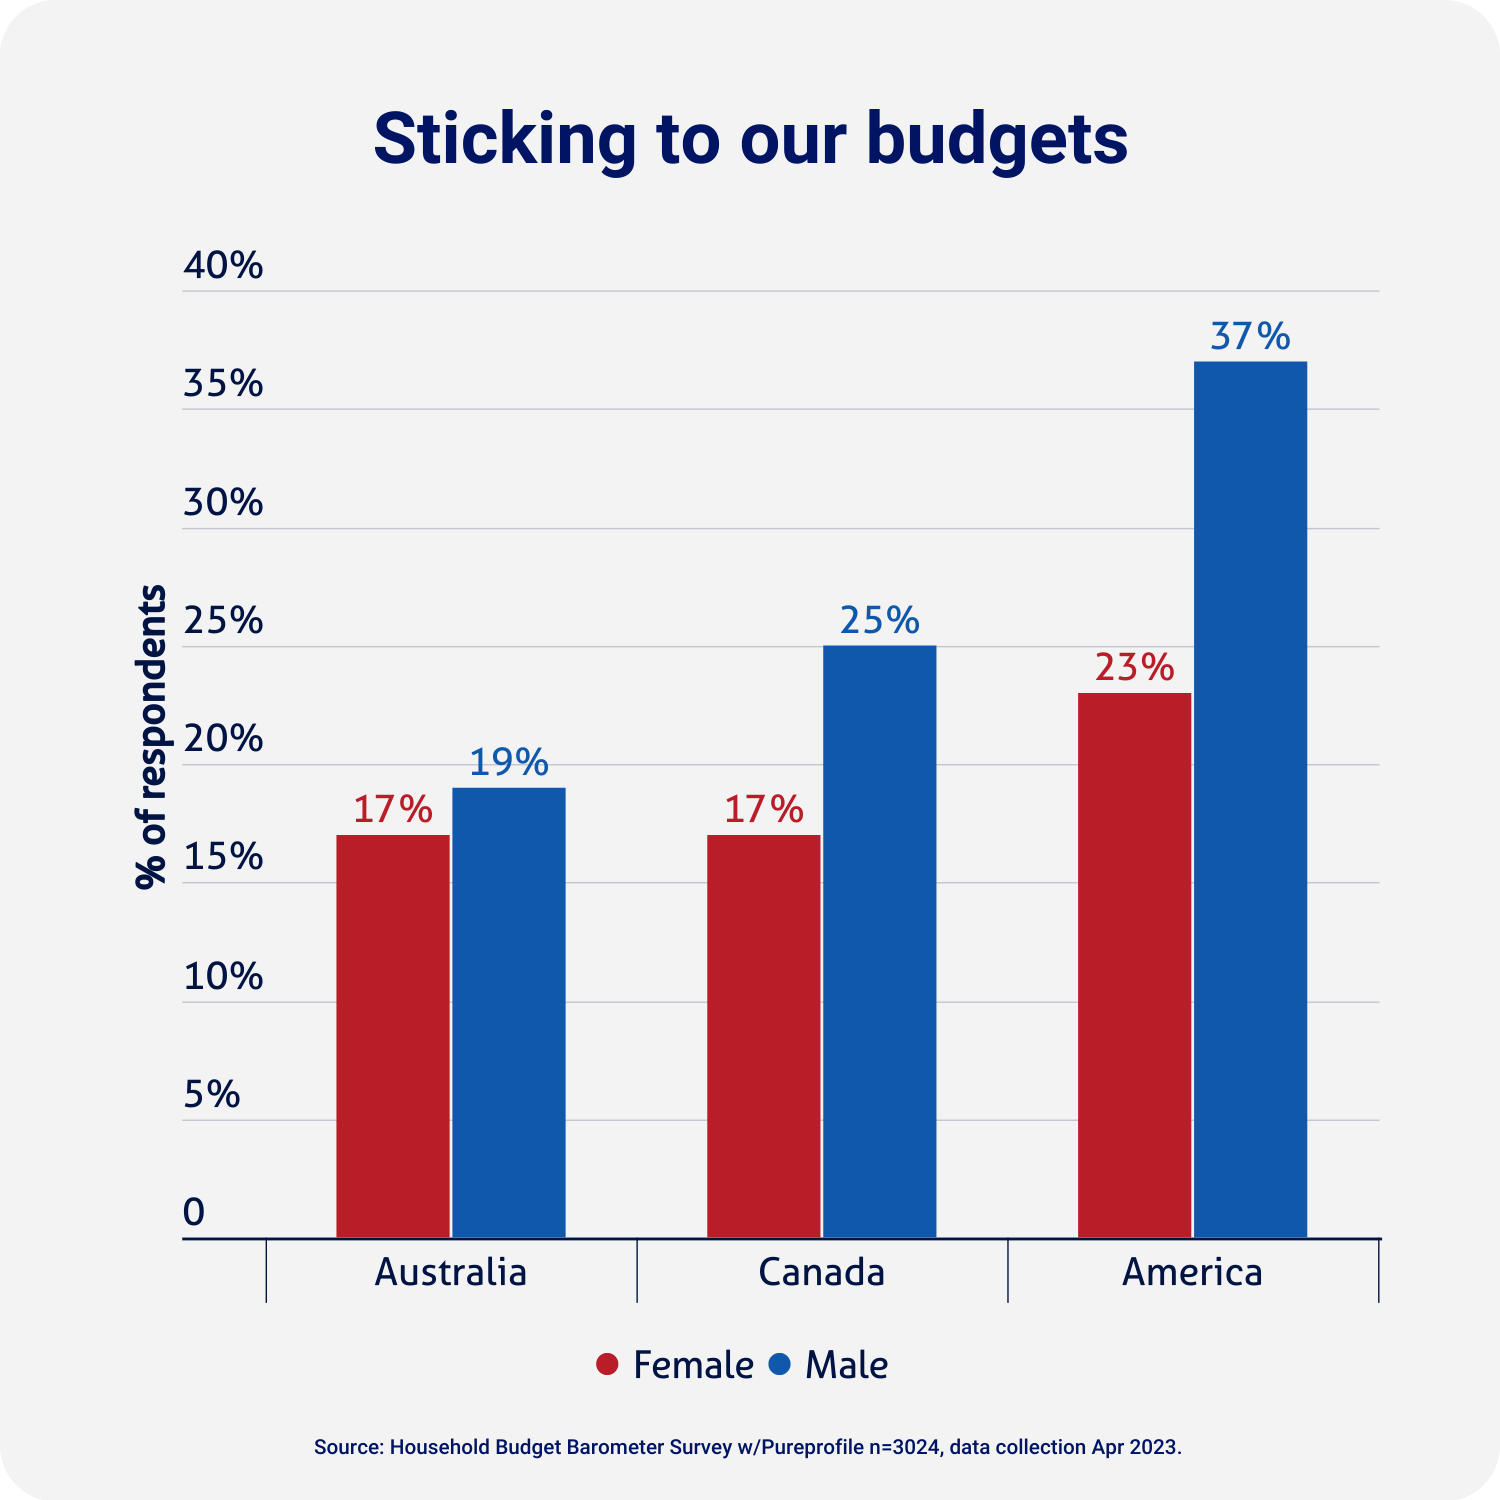
Across all three countries surveyed, men were more likely to say they keep to budgets than their female counterparts.
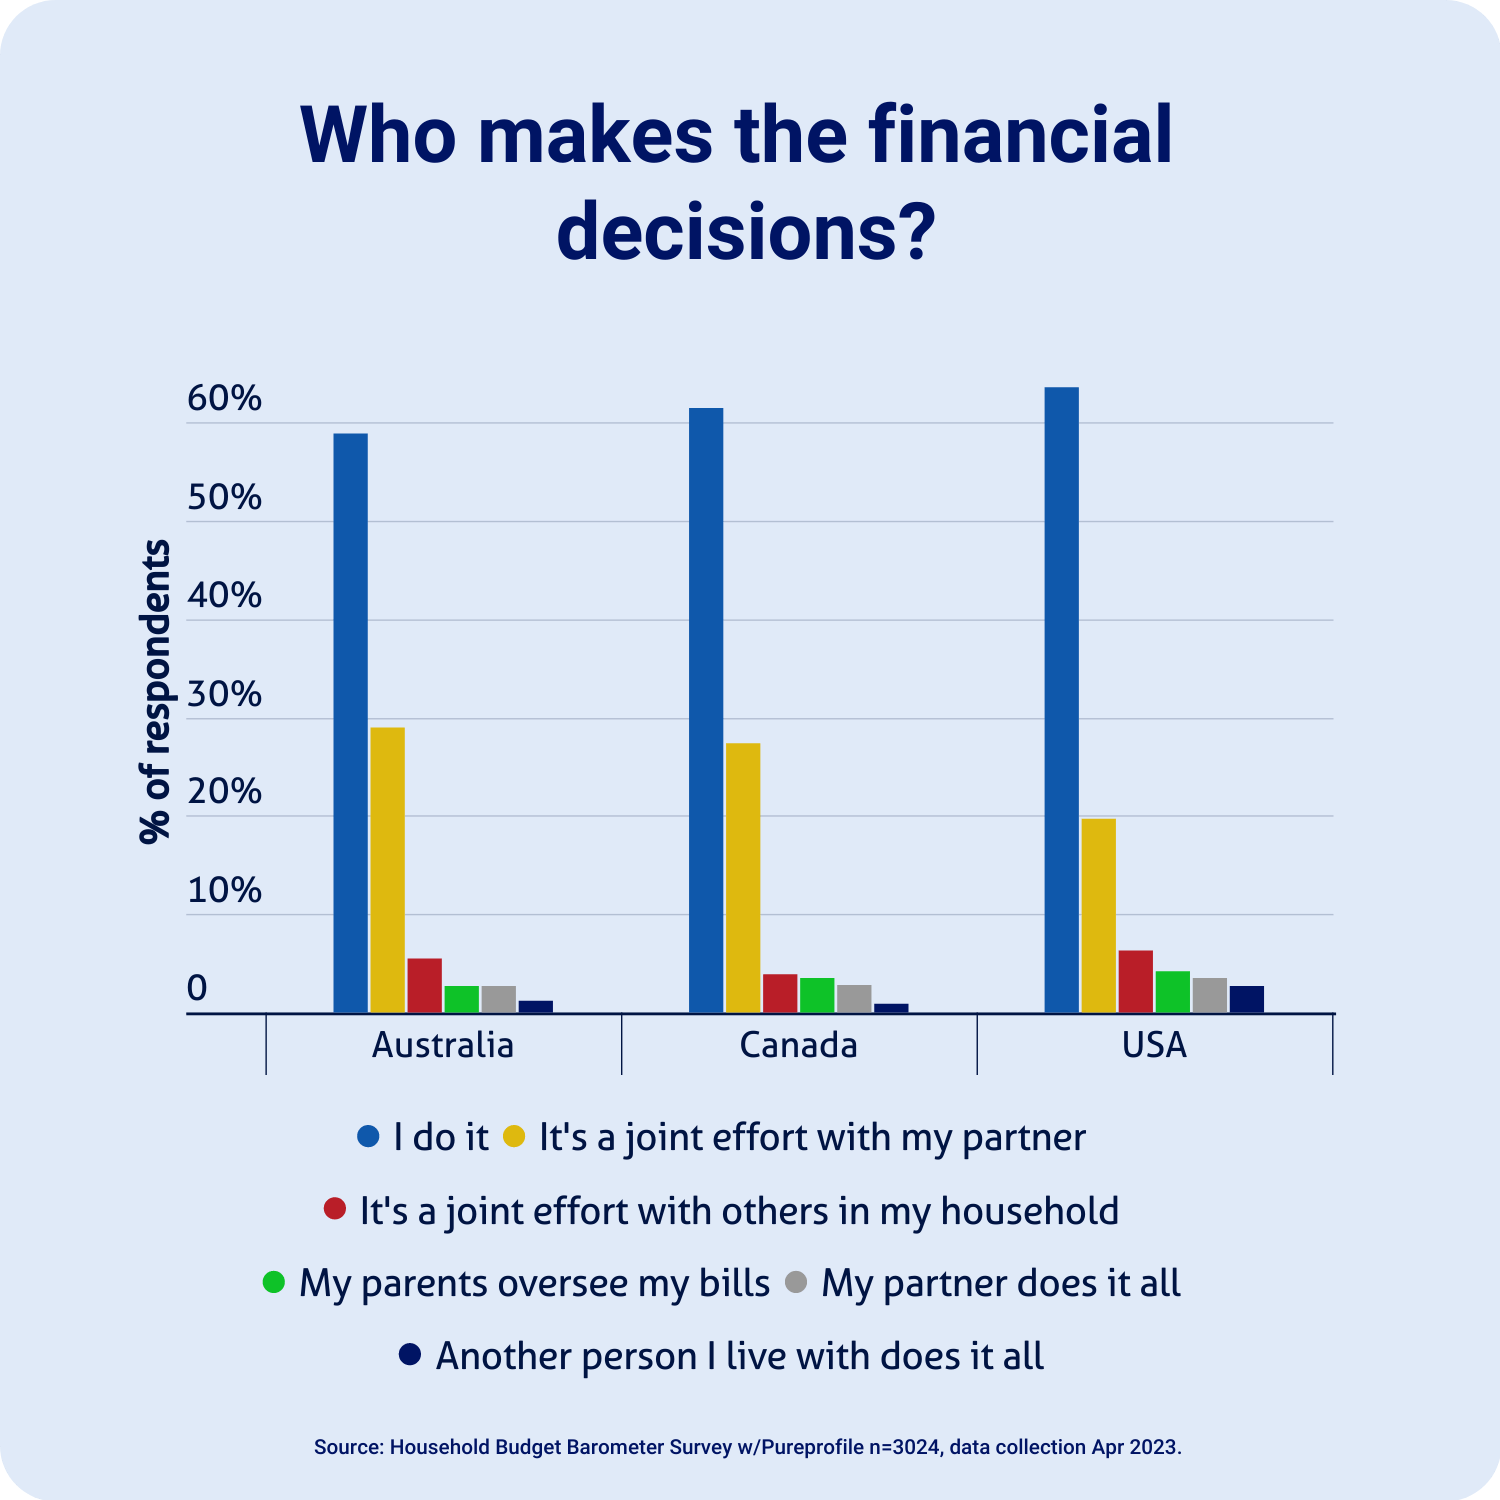
An overwhelming two-thirds of Americans (63%) say they make the majority of financial decisions in the household and oversee the bills, compared to just over half of Australians and Canadians. So just who is helping each country make financial decisions?
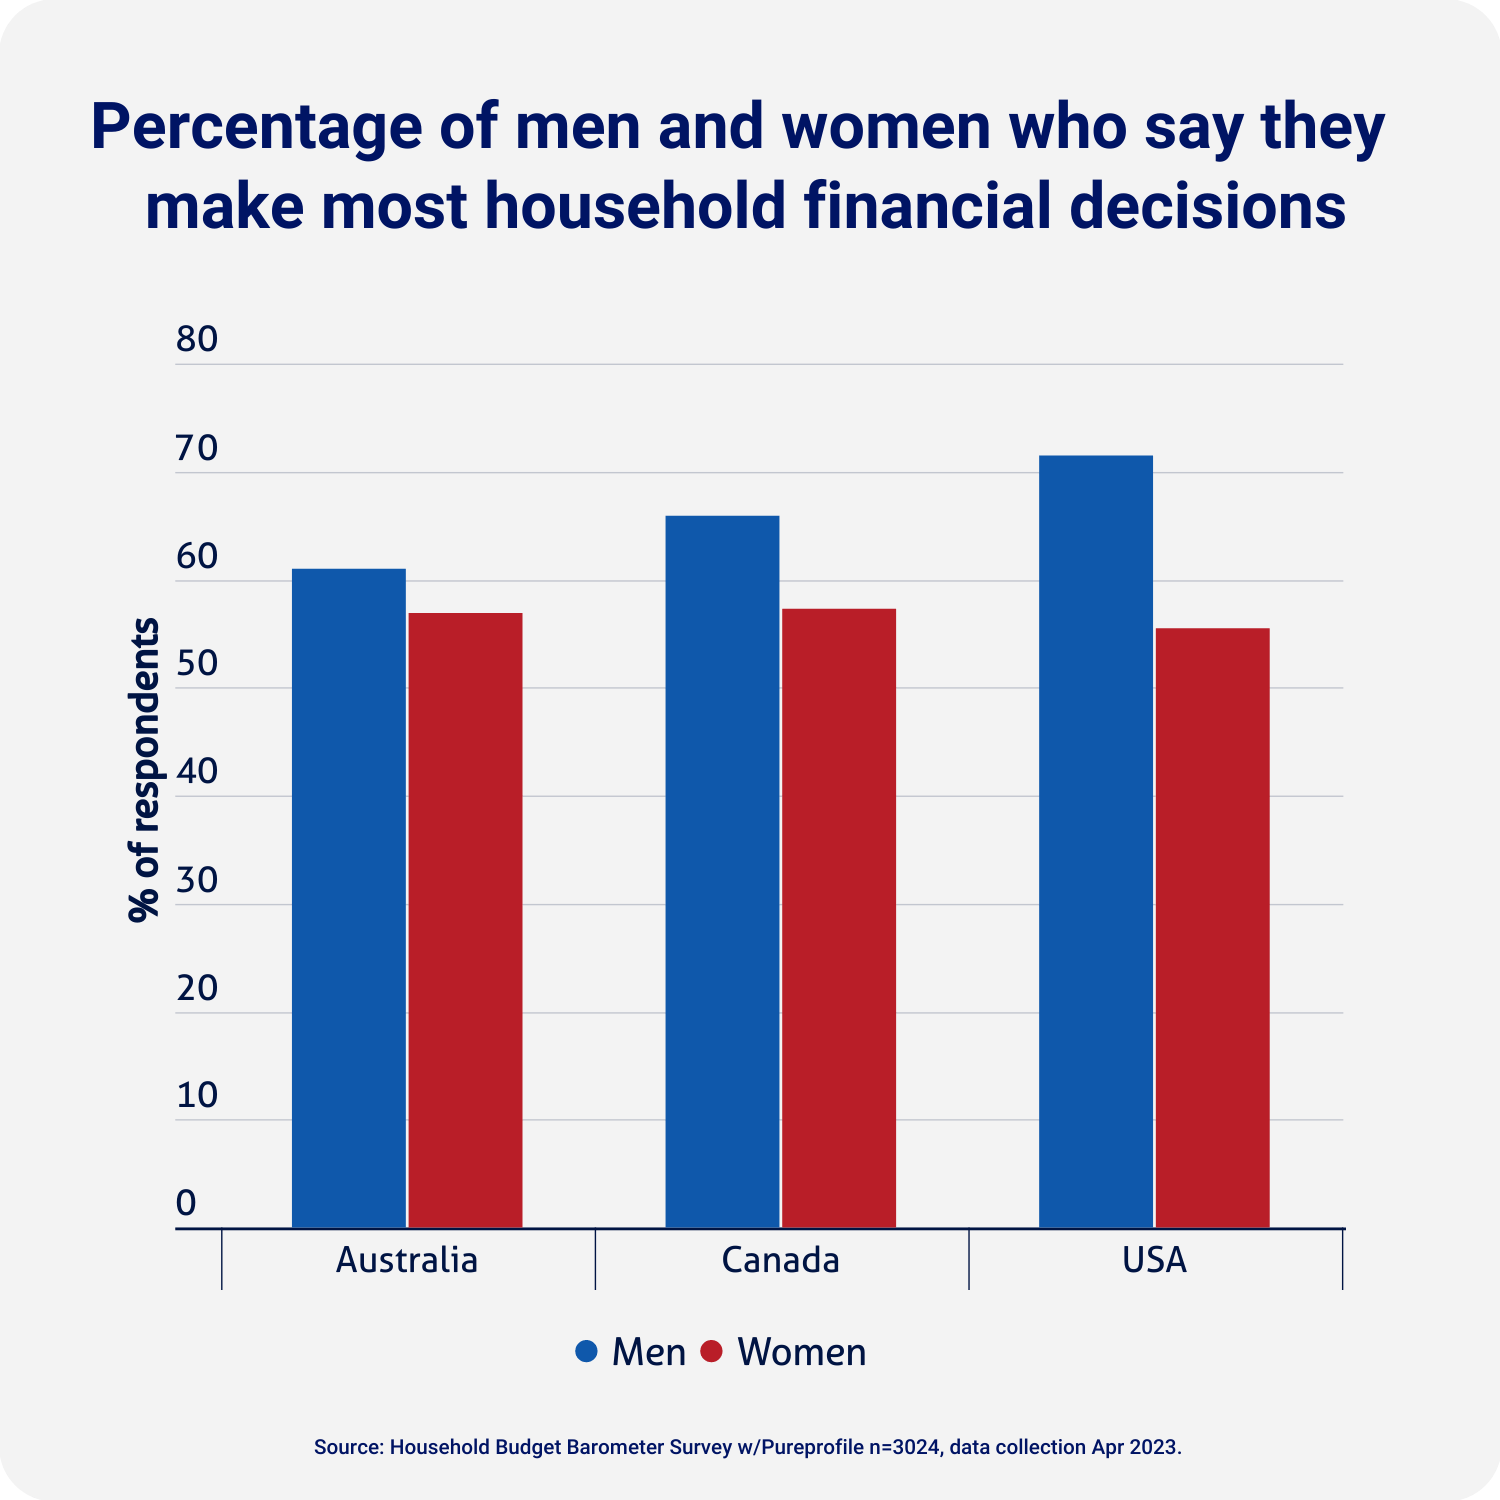
Men were slightly more likely than women to say they make most of the household financial decisions across America, Canada and Australia. In fact, two-thirds (66%) of males take responsibility for household finances, compared to just over half (57%) of women. The discrepancy in USA is the greatest of the three countries.
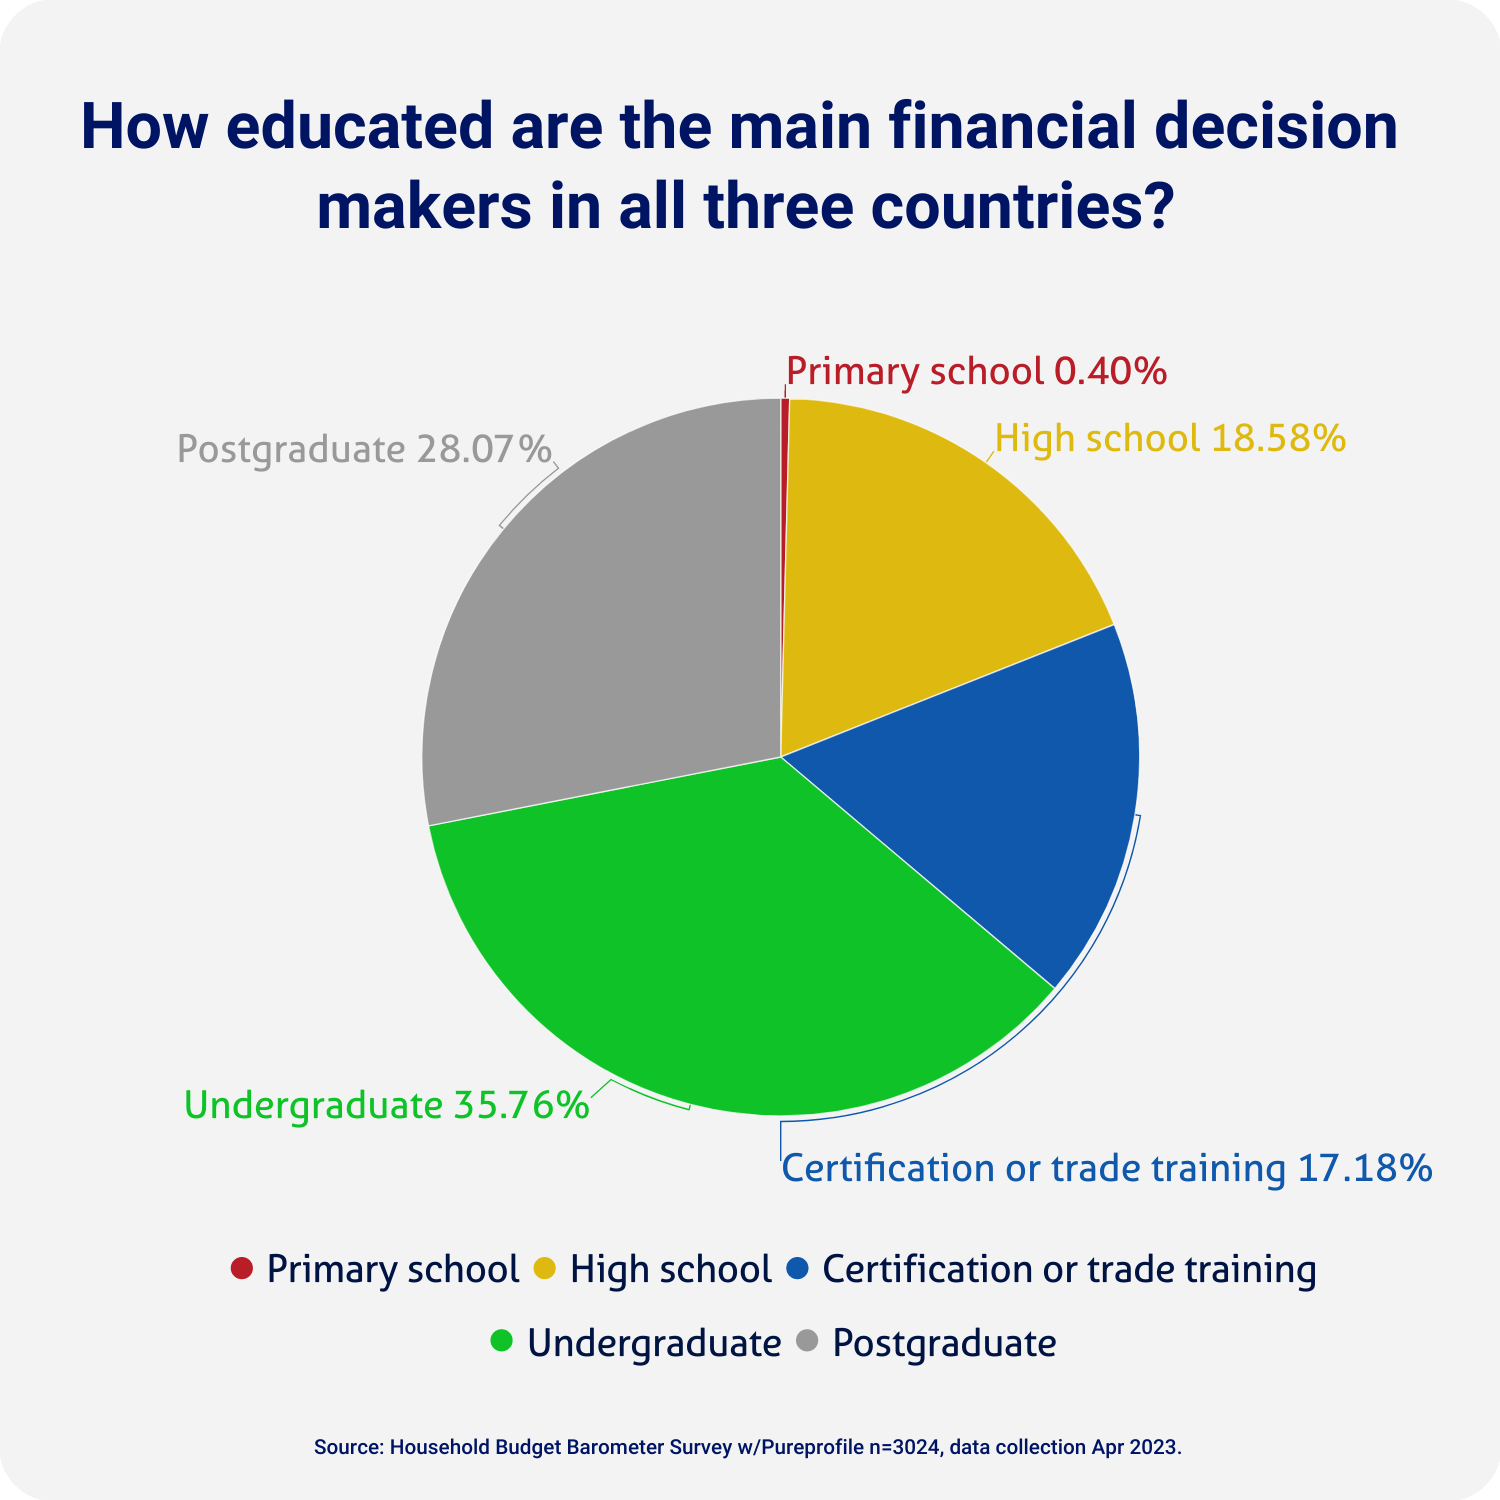
Across all three nations, having a university degree resulted in a higher likelihood of being the sole financial decision maker at home.
Thirty-six per cent of those with an undergraduate degree and 28% with a post graduate degree made the majority of financial decisions in the household, compared to 19% who have completed high school, 17% who have a certification or trade training and 0.4% of people who completed primary school.
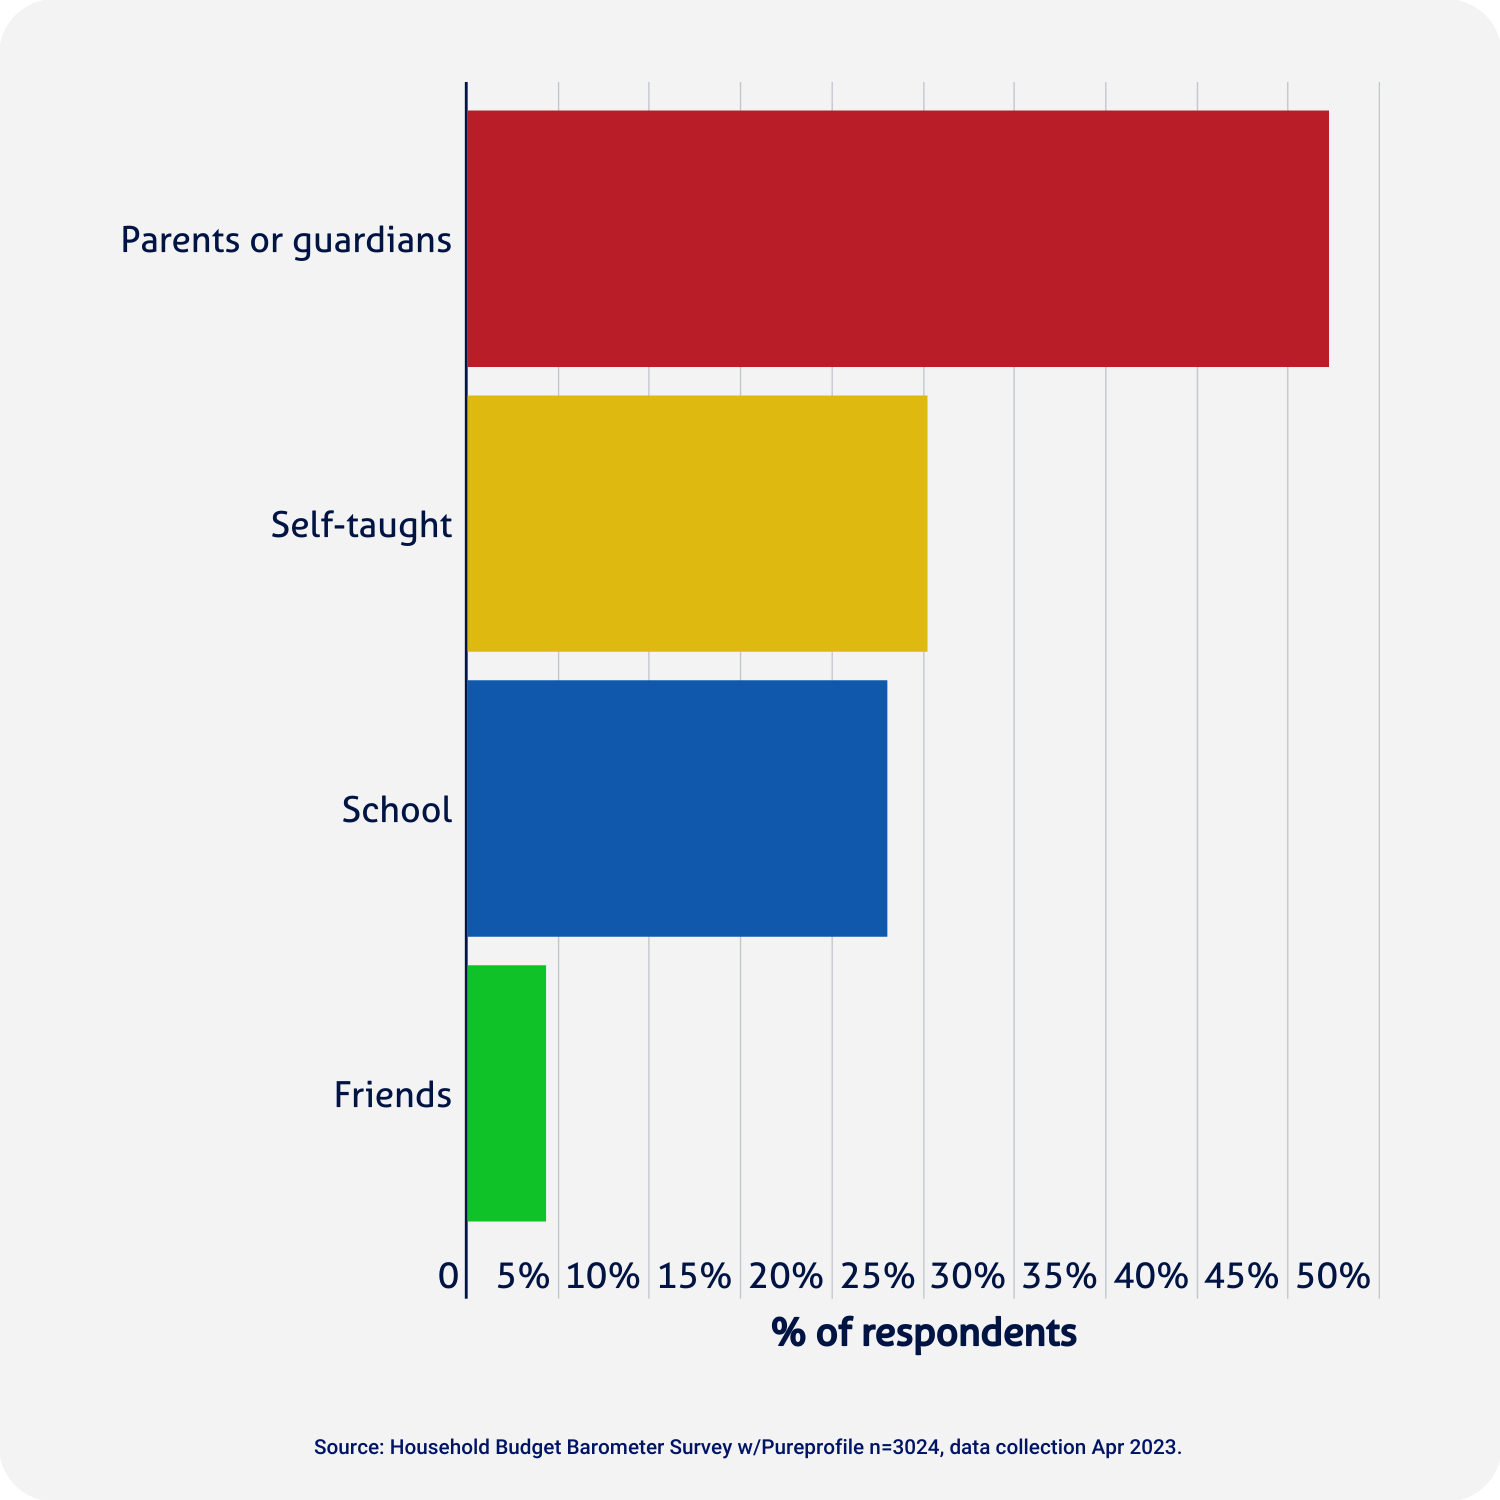
Previous research of 1,000 Australian adults from Compare the Market, conducted in December 2022, found that 53% of Aussies have never received education about managing their personal finances. Of those that had:
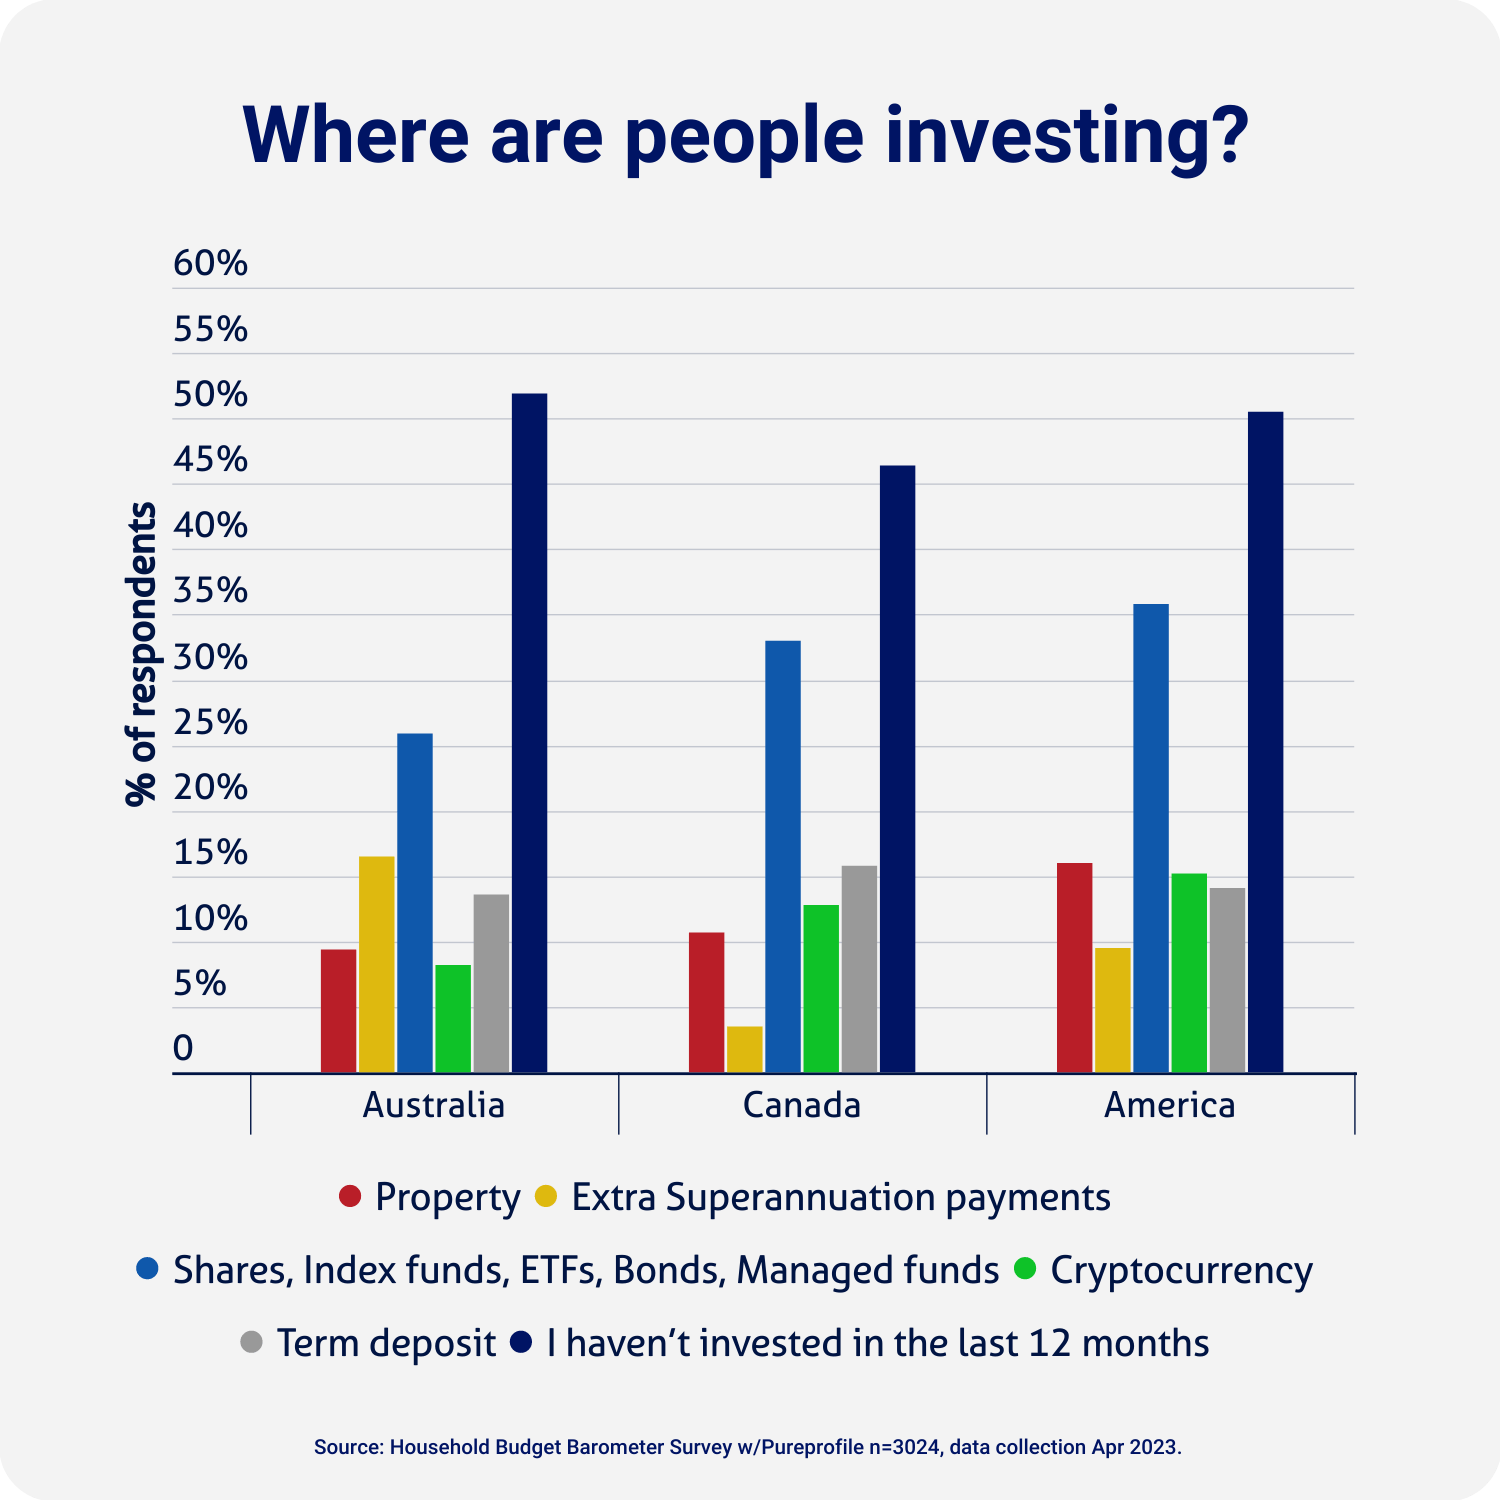
And where do we do it?

Nearly 50% of adults across Australia, Canada and America said they had not invested money over the past year.
Baby Boomers are the least likely to invest
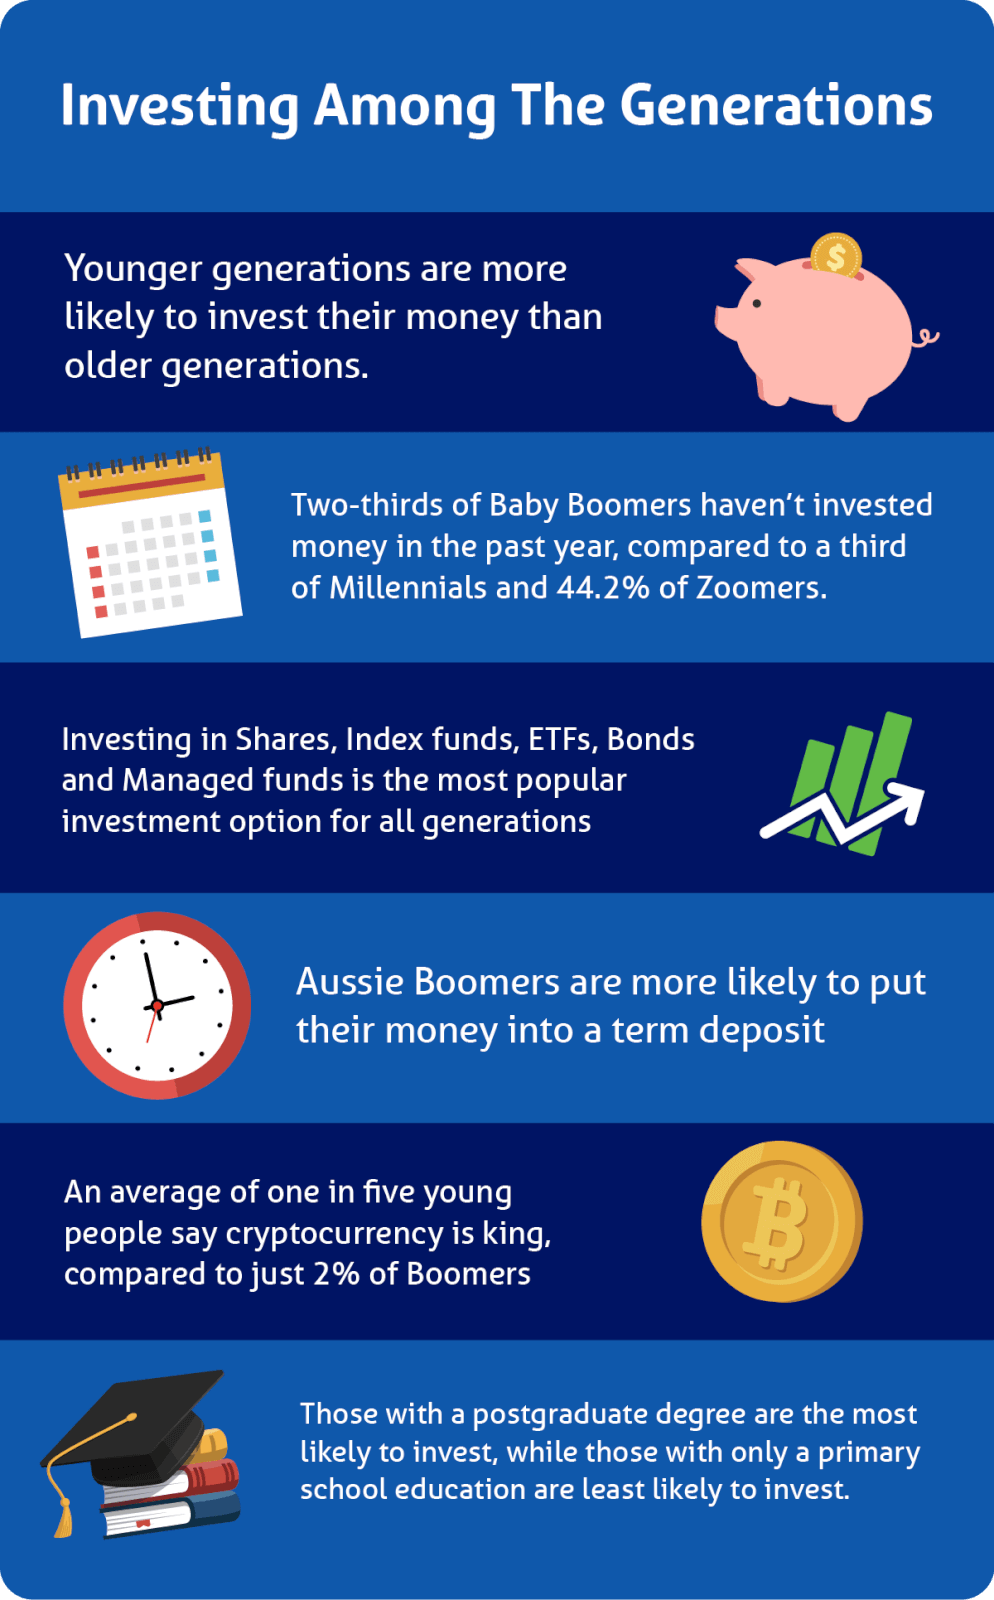
Regardless of which country you reside in, the findings show that those who have a mortgage are more likely to invest their money than someone who rents.
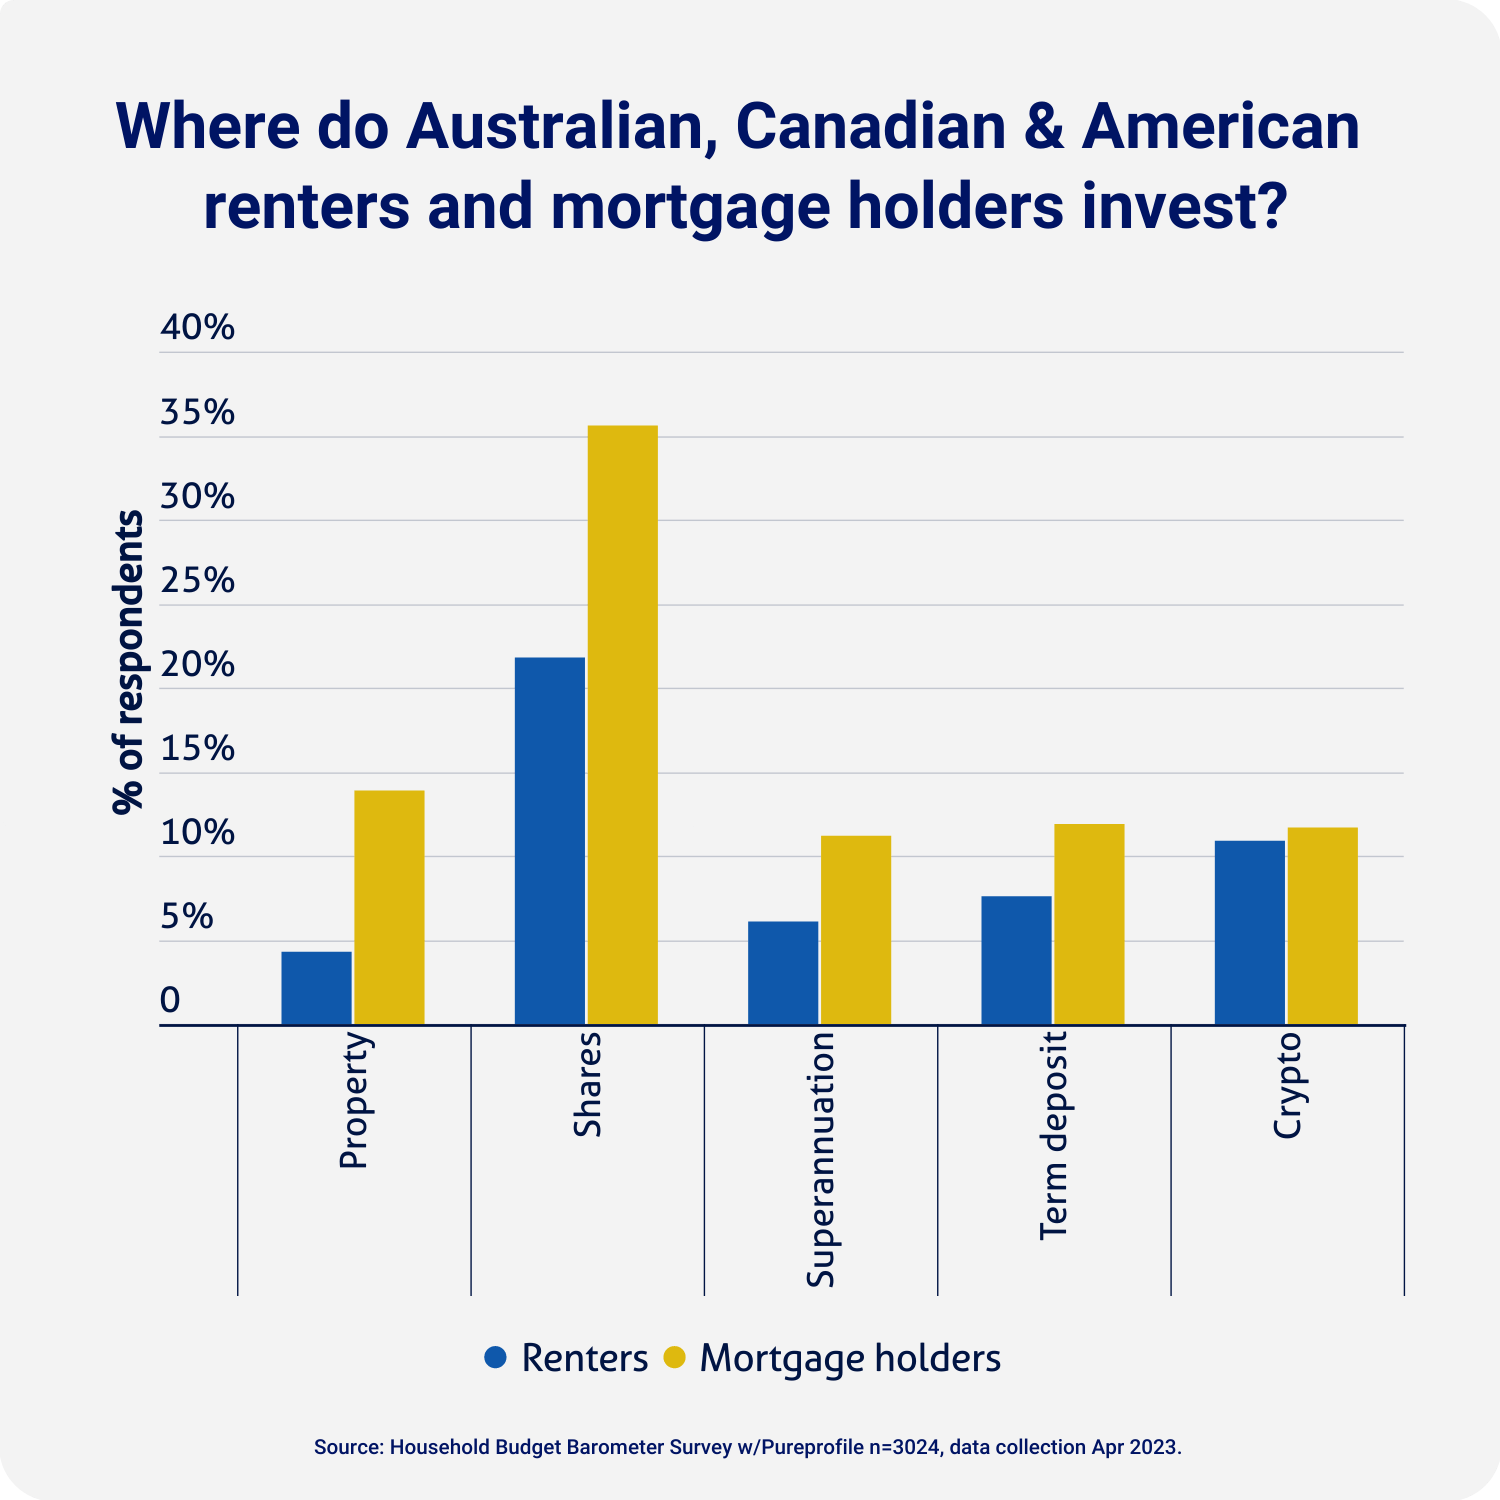
Where are income brackets most likely to invest?
Shares, Index funds, ETFs, Bonds and Managed Funds were the most popular investment options across income brackets. People on larger incomes were the most likely to invest in shares.
“The value of property has exploded over the past few decades, so it makes sense that so many homeowners continue to invest in property,” Mr Zeller said.
“Our findings show people are diversifying their portfolio and investing their money in term deposits, super and cryptocurrency.”

A tale of ‘haves’ and ‘have-nots’

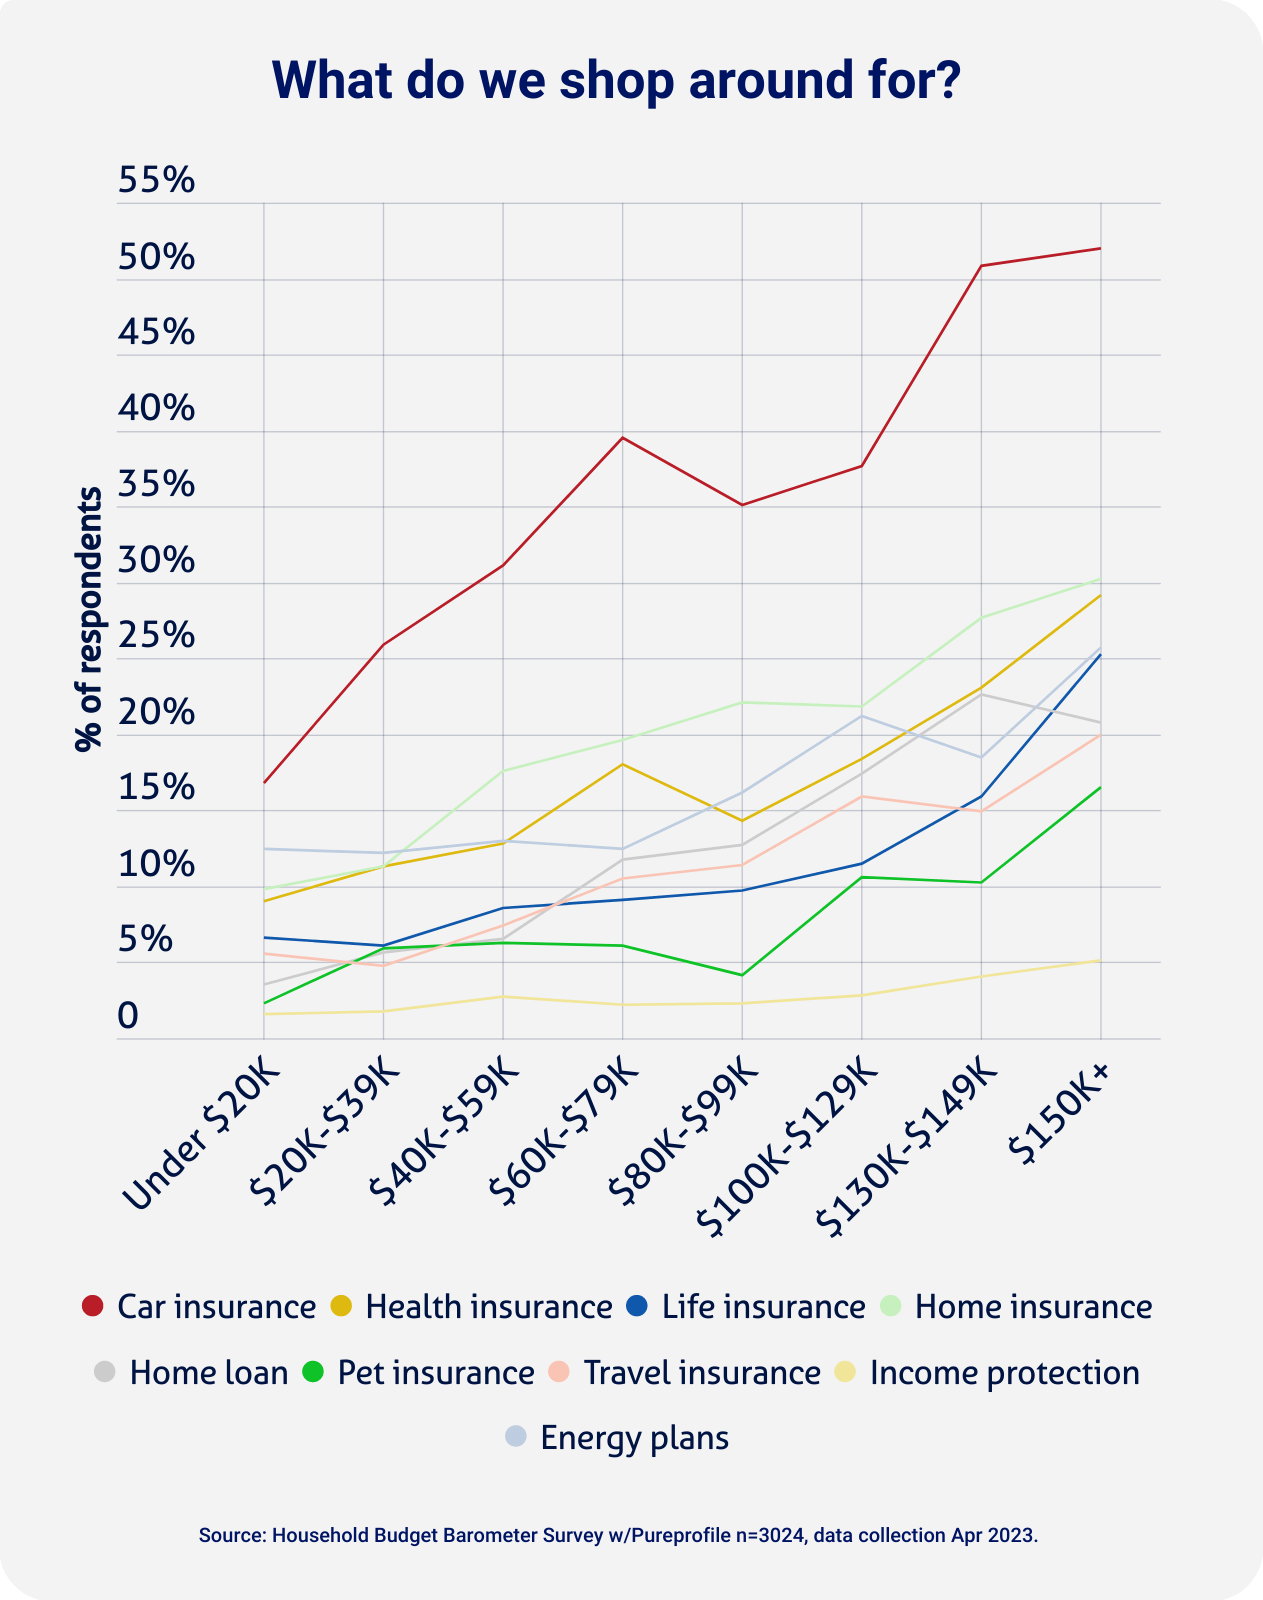
It’s generally understood that shopping around for a different financial product can help you get a better deal. The problem is the general view that it can take time and feel inconvenient with the research revealing that in most cases, people don’t shop around.
On average, Australians were the most likely to shop around for financial products.
– AUS: 17%
– USA: 15%
– Canada: 12%
People on higher incomes and homeowners were more likely to compare and look for a better deal on insurance or a mortgage.
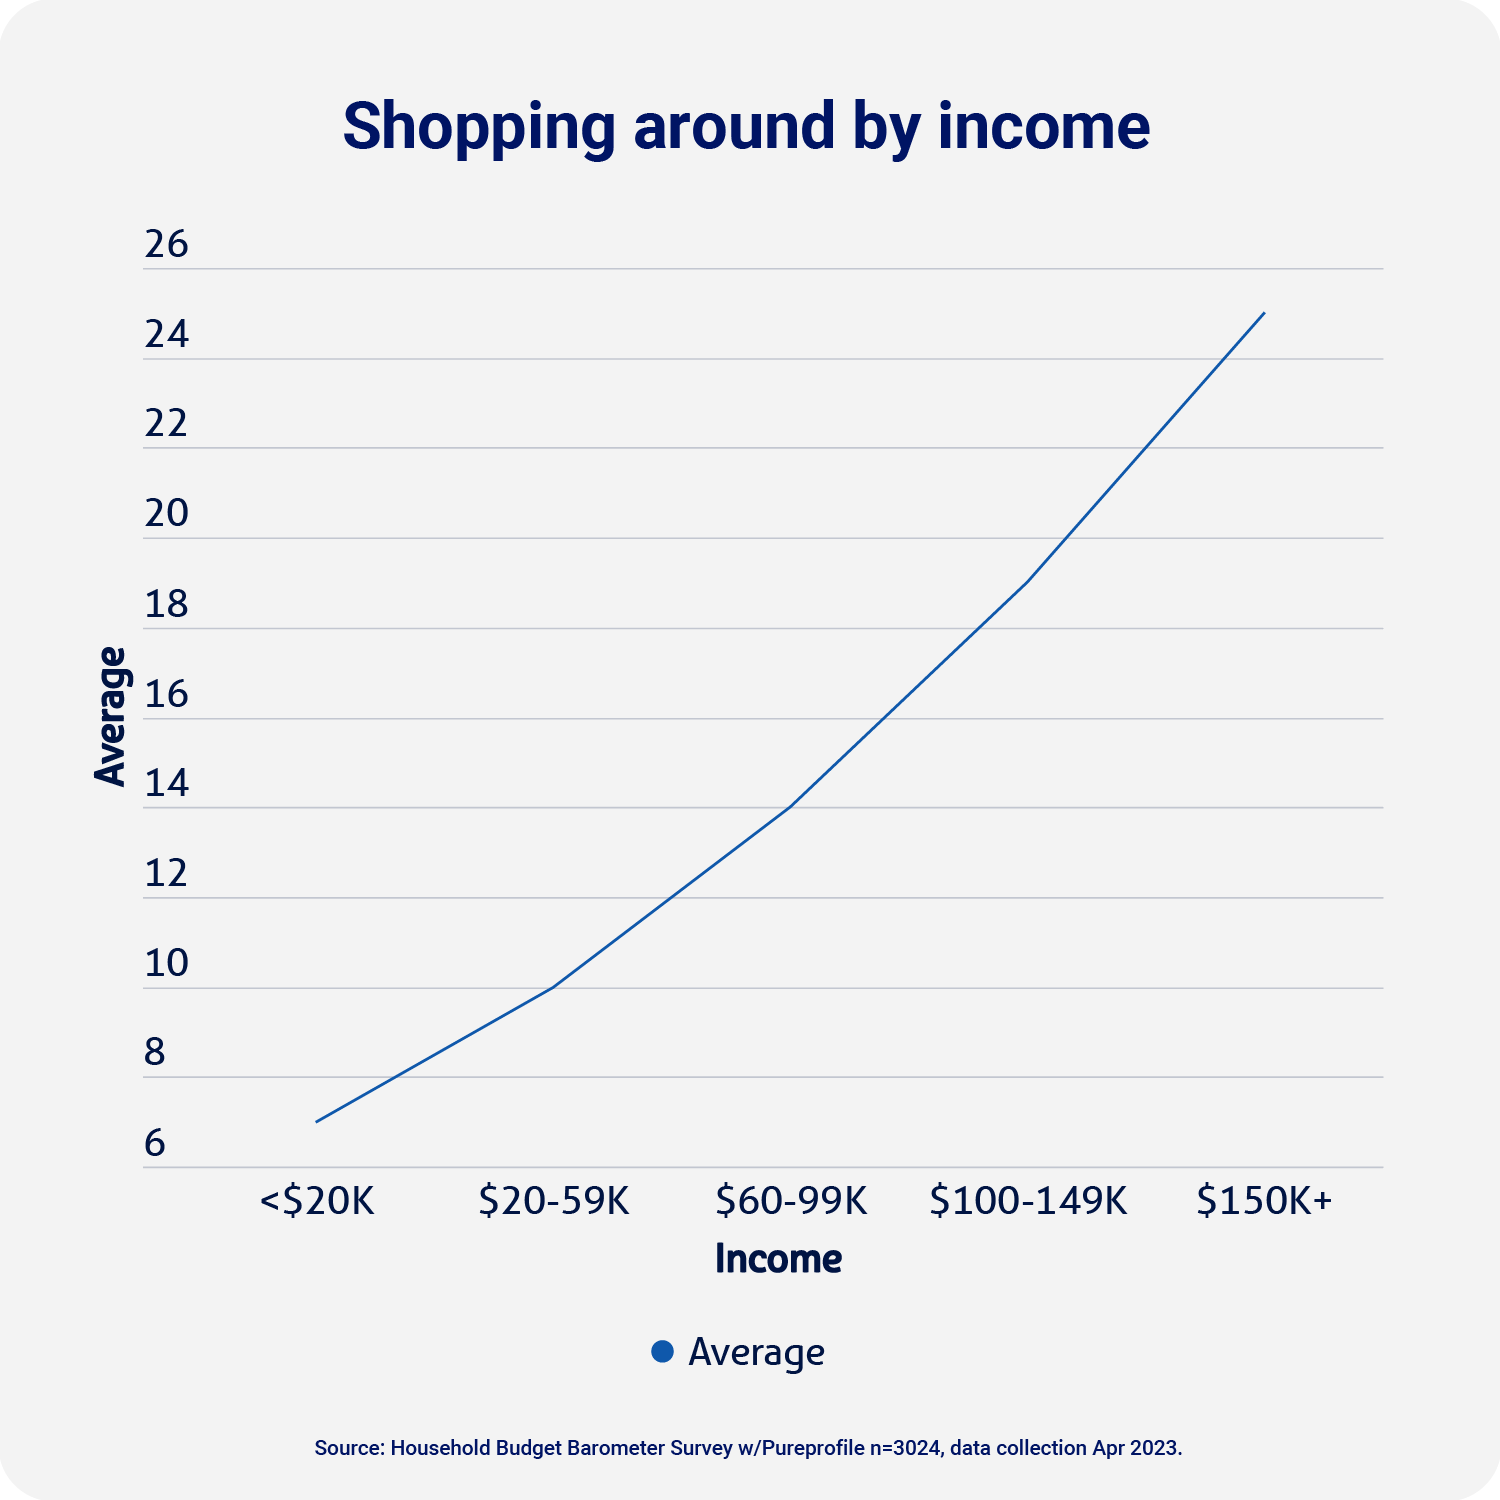
N.B. Excludes responses from people who listed their income as “prefer not to say”.
N.B. This chart excludes responses where home ownership was listed as “other”.
Mr Zeller said awareness was likely a key factor driving different behaviours.
“People without an education in budgeting basics are at a huge disadvantage when living costs rise,” Mr Zeller said.
“We urge people not to be passive when they receive bills and renewal notices, to check and make sure they’re not paying for unnecessary services, fees or add-ons.”
Across Australia, Canada and the USA, millennials were the most likely to shop around for financial products.
18-25: 15%
26-41: 21%
42-57: 14%
58+: 10%
And what we can do?

We are at the precipice of significant economic change as we face down the barrel of a potential recession. It’s extremely difficult for households already struggling to make ends meet.
We encourage people to wake up to the waste in their everyday bills and expenses – take a microscope to your renewal notices, energy bills, and repayments to see if you could save.
In these uncertain times, it’s more important than ever not to be complacent and prepare for whatever circumstances lie ahead.
Stephen Zeller

Compare the Market’s Household Budget Barometer (HBB) surveyed 3,024 Australians, Canadians and Americans through a survey distributed by Pureprofile. The survey sample is nationally representative in age, gender, location and income.
Authors and editors: Stephen Zeller, Phillip Portman, Natasha Innes, Noémi Hadnagy, Hannah Norton, James McCay, Sarah Orr, Chris Ford
Please reach out to Compare the Market’s media team for more information about the content of this report or for any data enquiries.
Generation Z: 18–25 years
Millennials: 26–41 years
Generation X: 42–57 years
Baby Boomers: 58+
This section lists Compare the Market sources only. Any external data used is referenced in copy.