The Burrow

The nation that fights back continues to push against rising costs.
Australians aren’t the type to give up easy.
Faced with crisis, we rise, rebuild and rally around each other. Our communities have overcome countless droughts, fires, floods and disasters.
And it’s that same tenacity that’s helping us through the cost-of-living crisis. Collectively, it’s been one of our toughest financial tests yet.
Compare the Market’s Household Budget Barometer for 2025, a nationally representative survey of more than 3,000 Australians, paints a picture of a nation fighting back against rising costs.

“Prices aren’t coming down – we’re just getting better at looking for value.”
More Australians are comparing and switching to get a better deal – with growing numbers shopping around for car insurance (+2%), home and contents cover (+4%) and electricity plans (+4%).
Groceries continue to bite the hardest, with 1 in 5 Aussies (21%) listing them as their most burdensome expense. Price hikes are hitting every aisle – but shoppers are fighting back by switching to cheaper options, checking unit prices and shopping in-season to save.
Our grocery haul research in this report found around an $82 difference between a basket of 20 brand-name items and their generic alternatives – proving the power of comparison yet again.
Home loans are also causing a headache, with repayments listed as the biggest pain point for about 18% of Australians, despite some relief delivered in the form of rate cuts in February, May and August.
Young homeowners paying off a mortgage have carried the nation through the cost-of-living crisis. It’s thanks to their efforts that inflation is back in the Reserve Bank’s target range.
But it’s taken a toll. Just 7% of Aussies say the cost of living has improved in the past year, and only 22% are optimistic about the future of the economy.
“While the government has chipped in with energy and childcare rebates, the most meaningful support has come from individuals supporting their families.”
We have heard from grandparents stepping in to help their adult children financially, to ease the burden of higher mortgage rates, childcare fees and grocery bills. We’ve also heard from adult children supporting their aging parents.
Tough times bring out the best in our communities, but it shouldn’t be up to everyday Aussies to carry such a heavy load alone.
We need stronger action from governments and regulators to step in and hold companies to account when price hikes go too far.
In the meantime, we’ll keep empowering Aussies to push against high prices – by shopping around and switching where savings are available.
This isn’t a fight we can afford to lose.
Compare the Market Economic Director,

The cost of cover is climbing
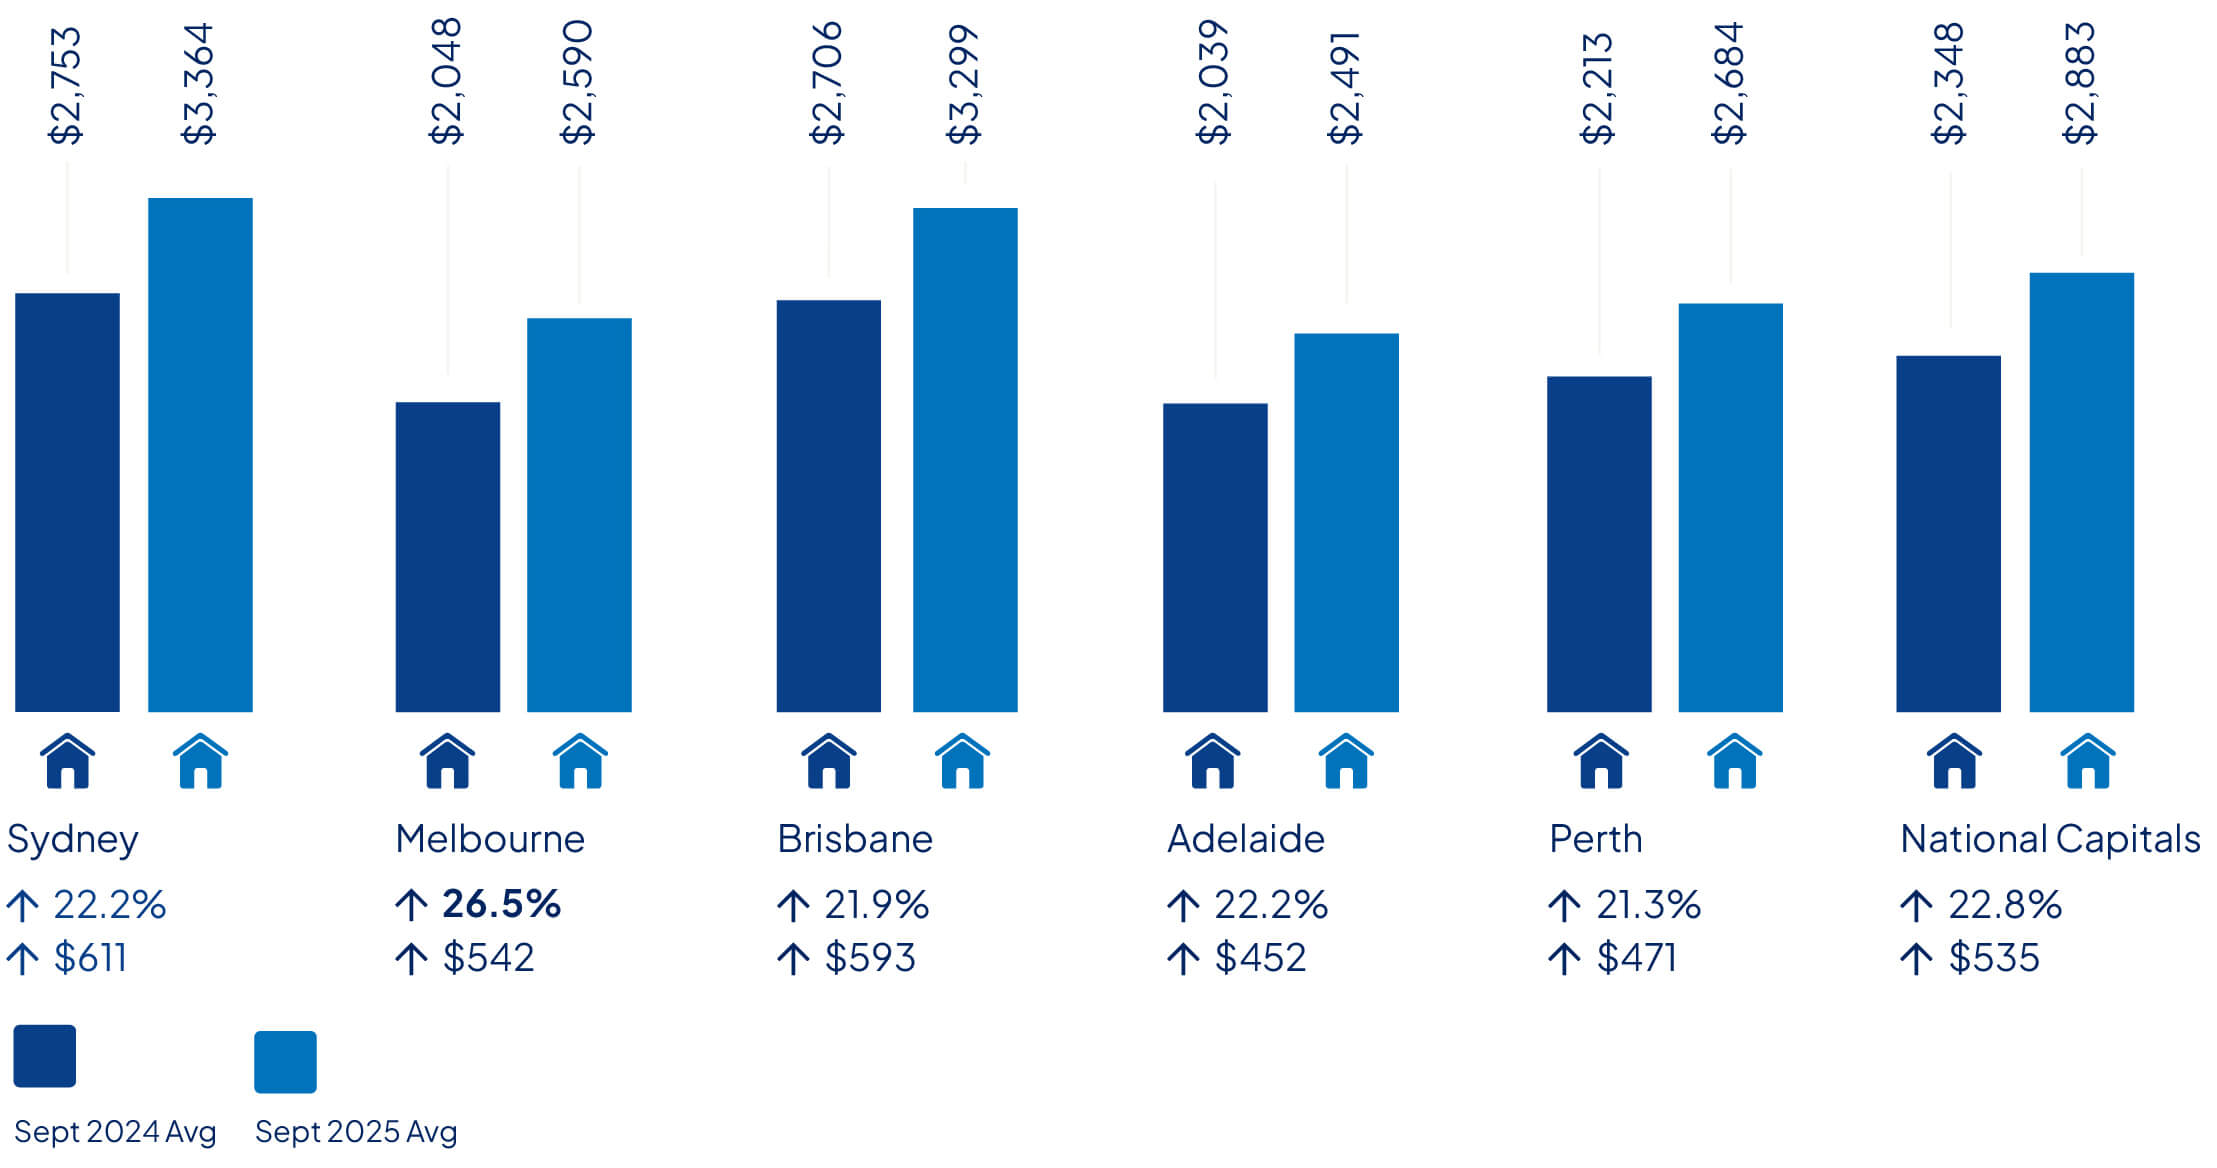
Average insurance premiums in Australia’s five largest capitals surged in the 12 months to September 2025, with the cost of covering a four-bedroom home up nearly 23%, and a typical car up almost 18%.
According to Compare the Market’s General Insurance Quote Index, the national average home and contents quote cost $2,833 in September 2025 – up almost $535 or 22.8% year on year.
The biggest price increase was observed in Melbourne where home and contents quotes rose 26.4% on average by around $542.
Based on average indicative home and contents insurance quotes available from Compare the Market and also from selected popular industry brands. Quotes for a typical low-set, 4 bedroom 2 bathroom, freestanding brick veneer home with tiled roof, insured for $700,000 with $80,000 in contents with a target excess of $1000 for both home and contents. Our home owner was a 30 year old male who lives alone with no previous claims. See notes for further information relevant to the pricing of the policies. Quotes collected Every three months or as close as possible from a start date of 30/08/2024 – 01/09/2024.. Your quotes will vary depending on your unique circumstances.
Brisbane quotes for Home and Contents in March 2025 were collected 11 days after other capitals due to embargoes in place during Tropical Cyclone Alfred affecting quote availability.
Car insurance quotes were up almost 18% for the year, adding about $311 to the average quote price from September 2024. The steepest increases were experienced in Adelaide and Perth where average premiums increased around 19.6%.
Overall, Sydney had the largest premiums on average with home and car quotes at $3,364 and $2,732 respectively.
Based on average indicative comprehensive car insurance quotes available from Compare the Market and also from selected popular industry brands. We used a target excess of $1000 or as close as possible where this was not available. Quotes for a white 4-door 2020 Toyota Corolla driven 12,000 km on average per year by a 30 year old male driver. See notes for further information relevant to the pricing of the policies. Quotes collected Every three months or as close as possible from a start date of 30/08/2024 – 01/09/2024. Your quotes will vary depending on your unique circumstances.
Insurers are not immune to the forces of inflation, and the rising cost of materials and labour have taken a toll.
Local and global catastrophes, including the Los Angeles wildfires, have resulted in multi-billion-dollar repair bills, that are partially paid out of shared reinsurance pools.
Compare the Market’s Economic Director David Koch said that some growth in premiums was to be expected but urged customers to look for competitive prices.
“On average hundreds of dollars have been added on to quoted premiums in the past 12 months,” Mr Koch said. “We monitor new advertised rates, but the situation could be even worse for customers who receive renewal notices after holding a policy for several years.
“Insurances are often a huge burden on family balance sheets. Our research shows a family with a typical car and four-bedroom home could be spending upwards of $4,000 on policies each year.”
While the headline figures may be startling, our analysis shows there could be considerable discounts for people who choose to shop around.
Quotes for home and contents cover at one Brisbane address varied as much as $2,857. In another case, quotes for a popular car model to be insured at an Adelaide address differed as much as $1,469.
“It’s proof of the power of comparison. A few quick checks could potentially save you thousands of dollars,” Mr Koch said.
“We work too hard for our money, only to see it spent on big grudge purchases. Spending five minutes comparing options could help fund a weekend away.”
What does the cost-of-living crisis look like for different Aussies?
Some Australians are taking out debt to buy everyday essentials
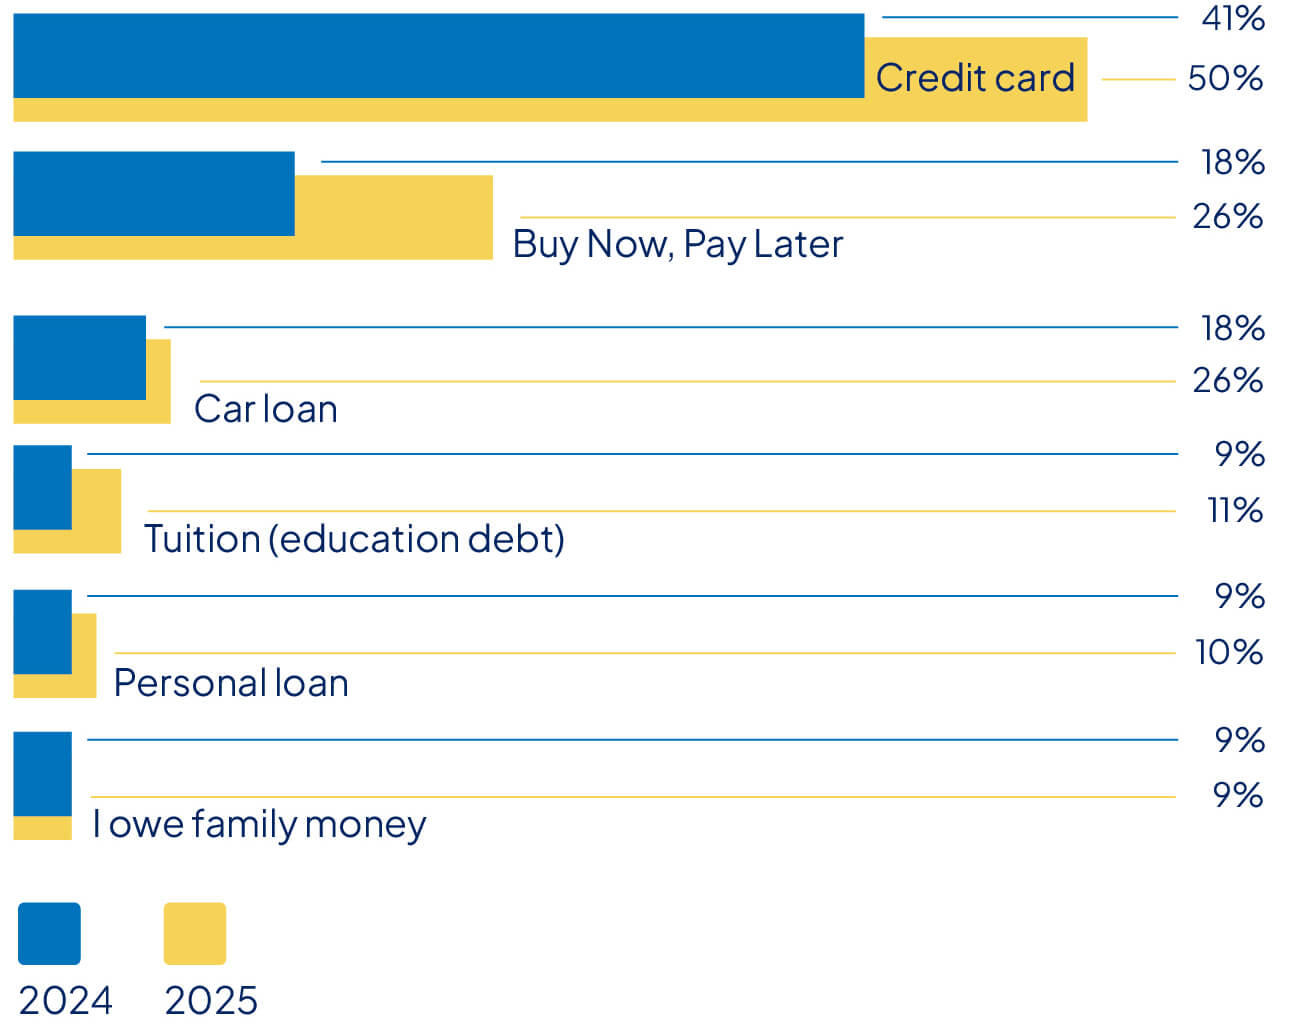
Credit card debt among survey respondents increased by 9% year on year, while Buy Now, Pay Later use jumped 8%. This could be attributed to Australians being subject to larger bills and expenses that have depleted their savings.
Anecdotally, we heard some families resorted to debt to cover unexpected costs, like home repairs and medical expenses. Other people accumulated debts to maintain leisure and lifestyle purchases.
Only 27% of respondents said they had no debts (outside of a home loan) compared to 33% last year.
Generation X were most likely to carry credit card debt (31%), while Millennials were the most likely to use Buy Now, Pay Later schemes (40%).
There is hope that with the cash rate decreasing and the rate of inflation slowing that Australians will be able to pay off some debts faster, to return to a better financial position.
“I have had to reduce spending, and going out with friends and family. I’ve had to work more overtime to provide [for my family] and stay above debt.”
“Meeting medical bills has meant using our credit card, increasing debt.”
“Rising costs have impacted me this year by being in constant debt and not being able to afford food. There are days when I do not eat at all. It’s stressful and sad. It has been causing issues for myself and my partner and family.”
While the nation is on the road to an electric vehicle transition, many motorists still rely on fuel for their car to get from point a to b.
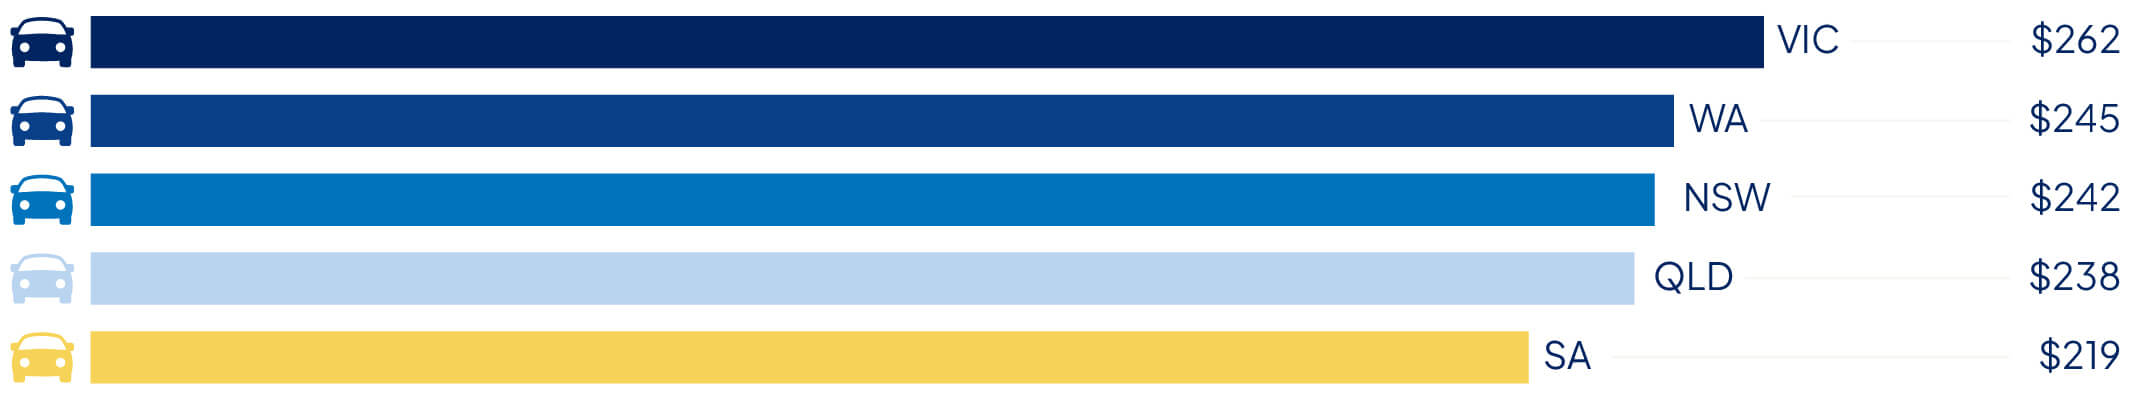
On average, Australians are spending $56.47 to fill up the tank each week, equal to $244.70 a month or $2,936.44 annually.
Victorians spend the most on average, forking out $17.81 more than the national average each month. South Australians spend the least – around $25.65 less than the national average each month.
This is despite the cost of Unleaded 91 being higher on average in cities like Brisbane and Sydney. Motorists in these locations could be relying more on public transport (flat-rate 50-cent fares across Queensland public transport have been in place since August 2024) or could be adopting other saving habits to fill up for less.
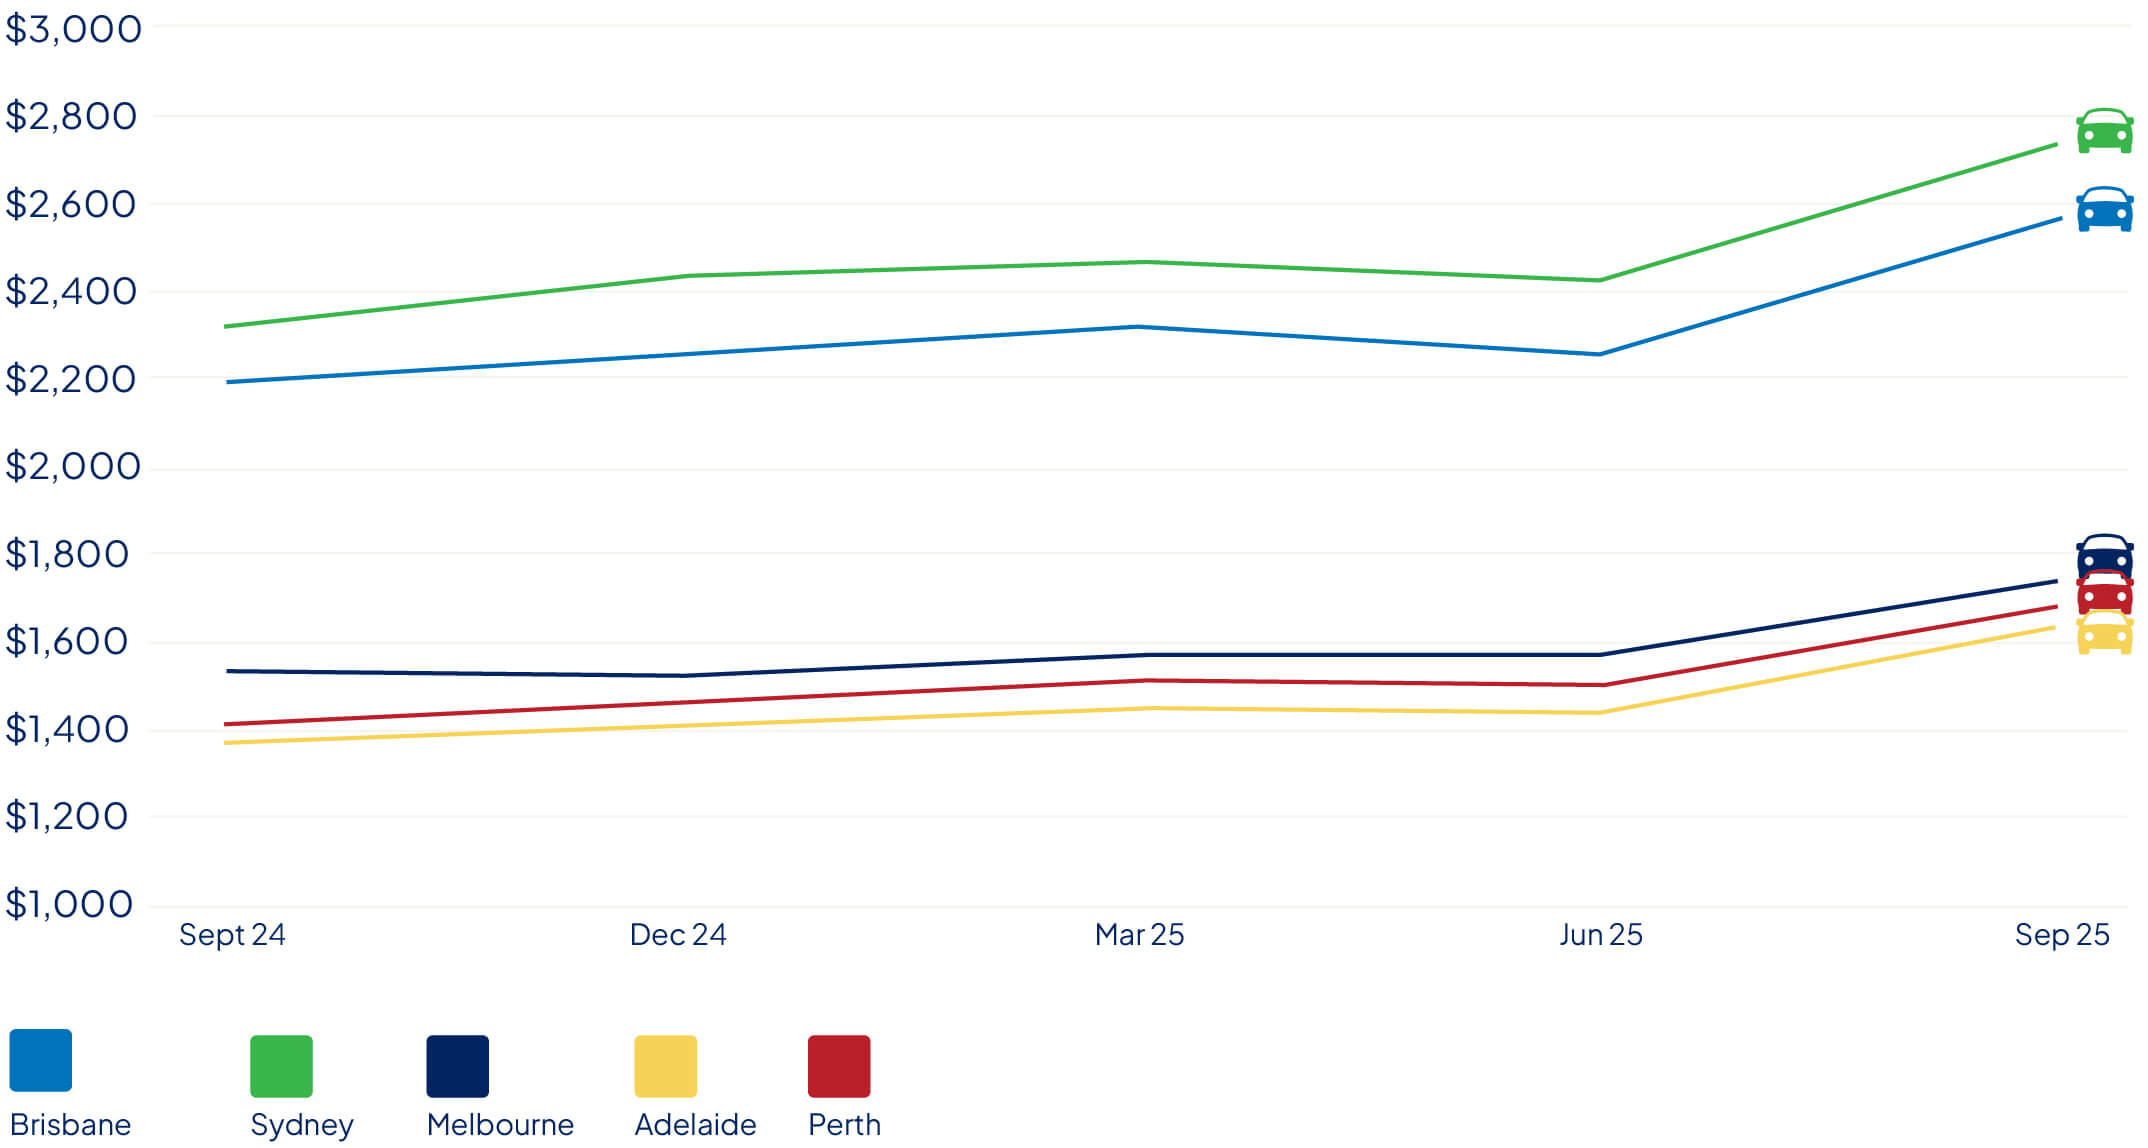
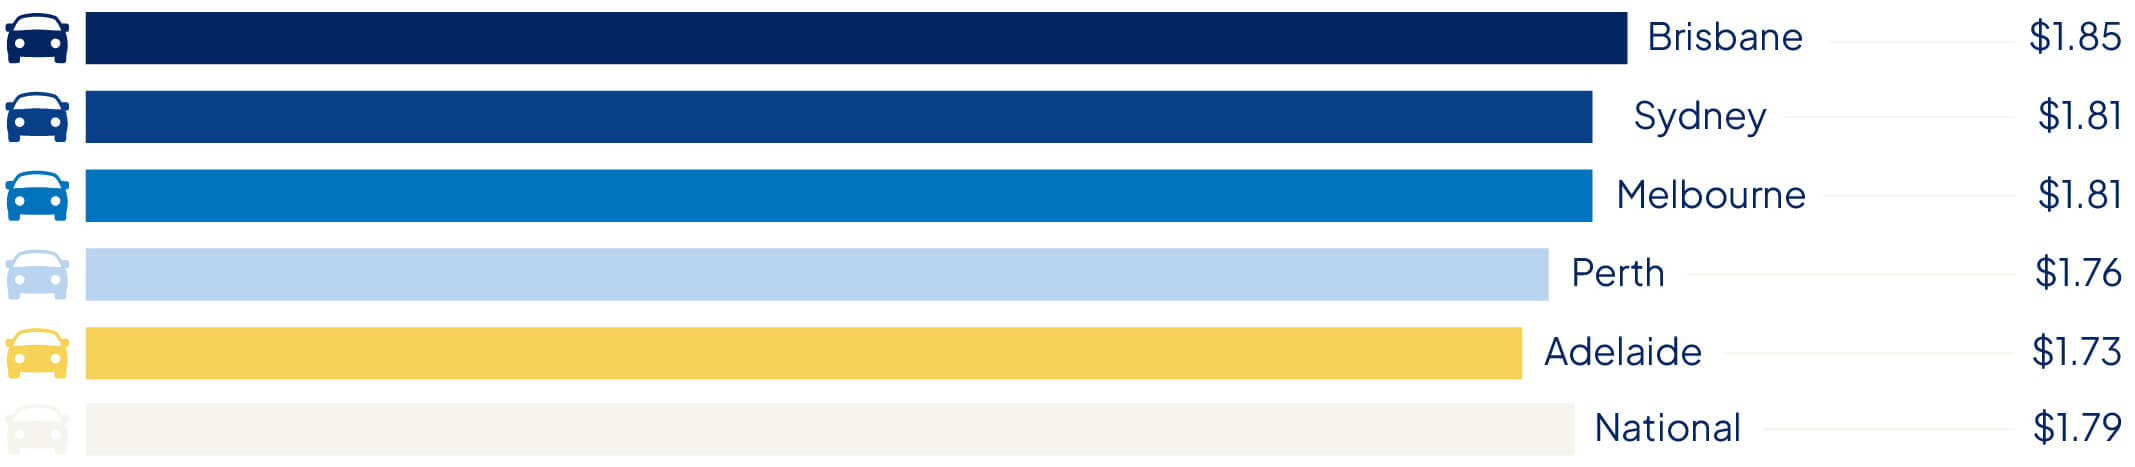
Compare the Market tracked the city-wide average retail price for Unleaded 91 in Melbourne, Sydney, Brisbane, Adelaide and Perth, Monday to Friday, between 1 August 2024 to 1 August 2025.
Based on Compare the Market’s tracking, Brisbane was the most expensive place to fill up, with a city-wide average of $1.85.
On average, Brisbane motorists forked out 12 cents more per litre than drivers in Adelaide, 9 cents more than drivers in Perth, and around 4 cents more than those in Sydney or Melbourne.
Over a quarter (1 May 2025 – 1 August 2025), we can see the fuel pricing cycle in action across Australia’s five major capitals.
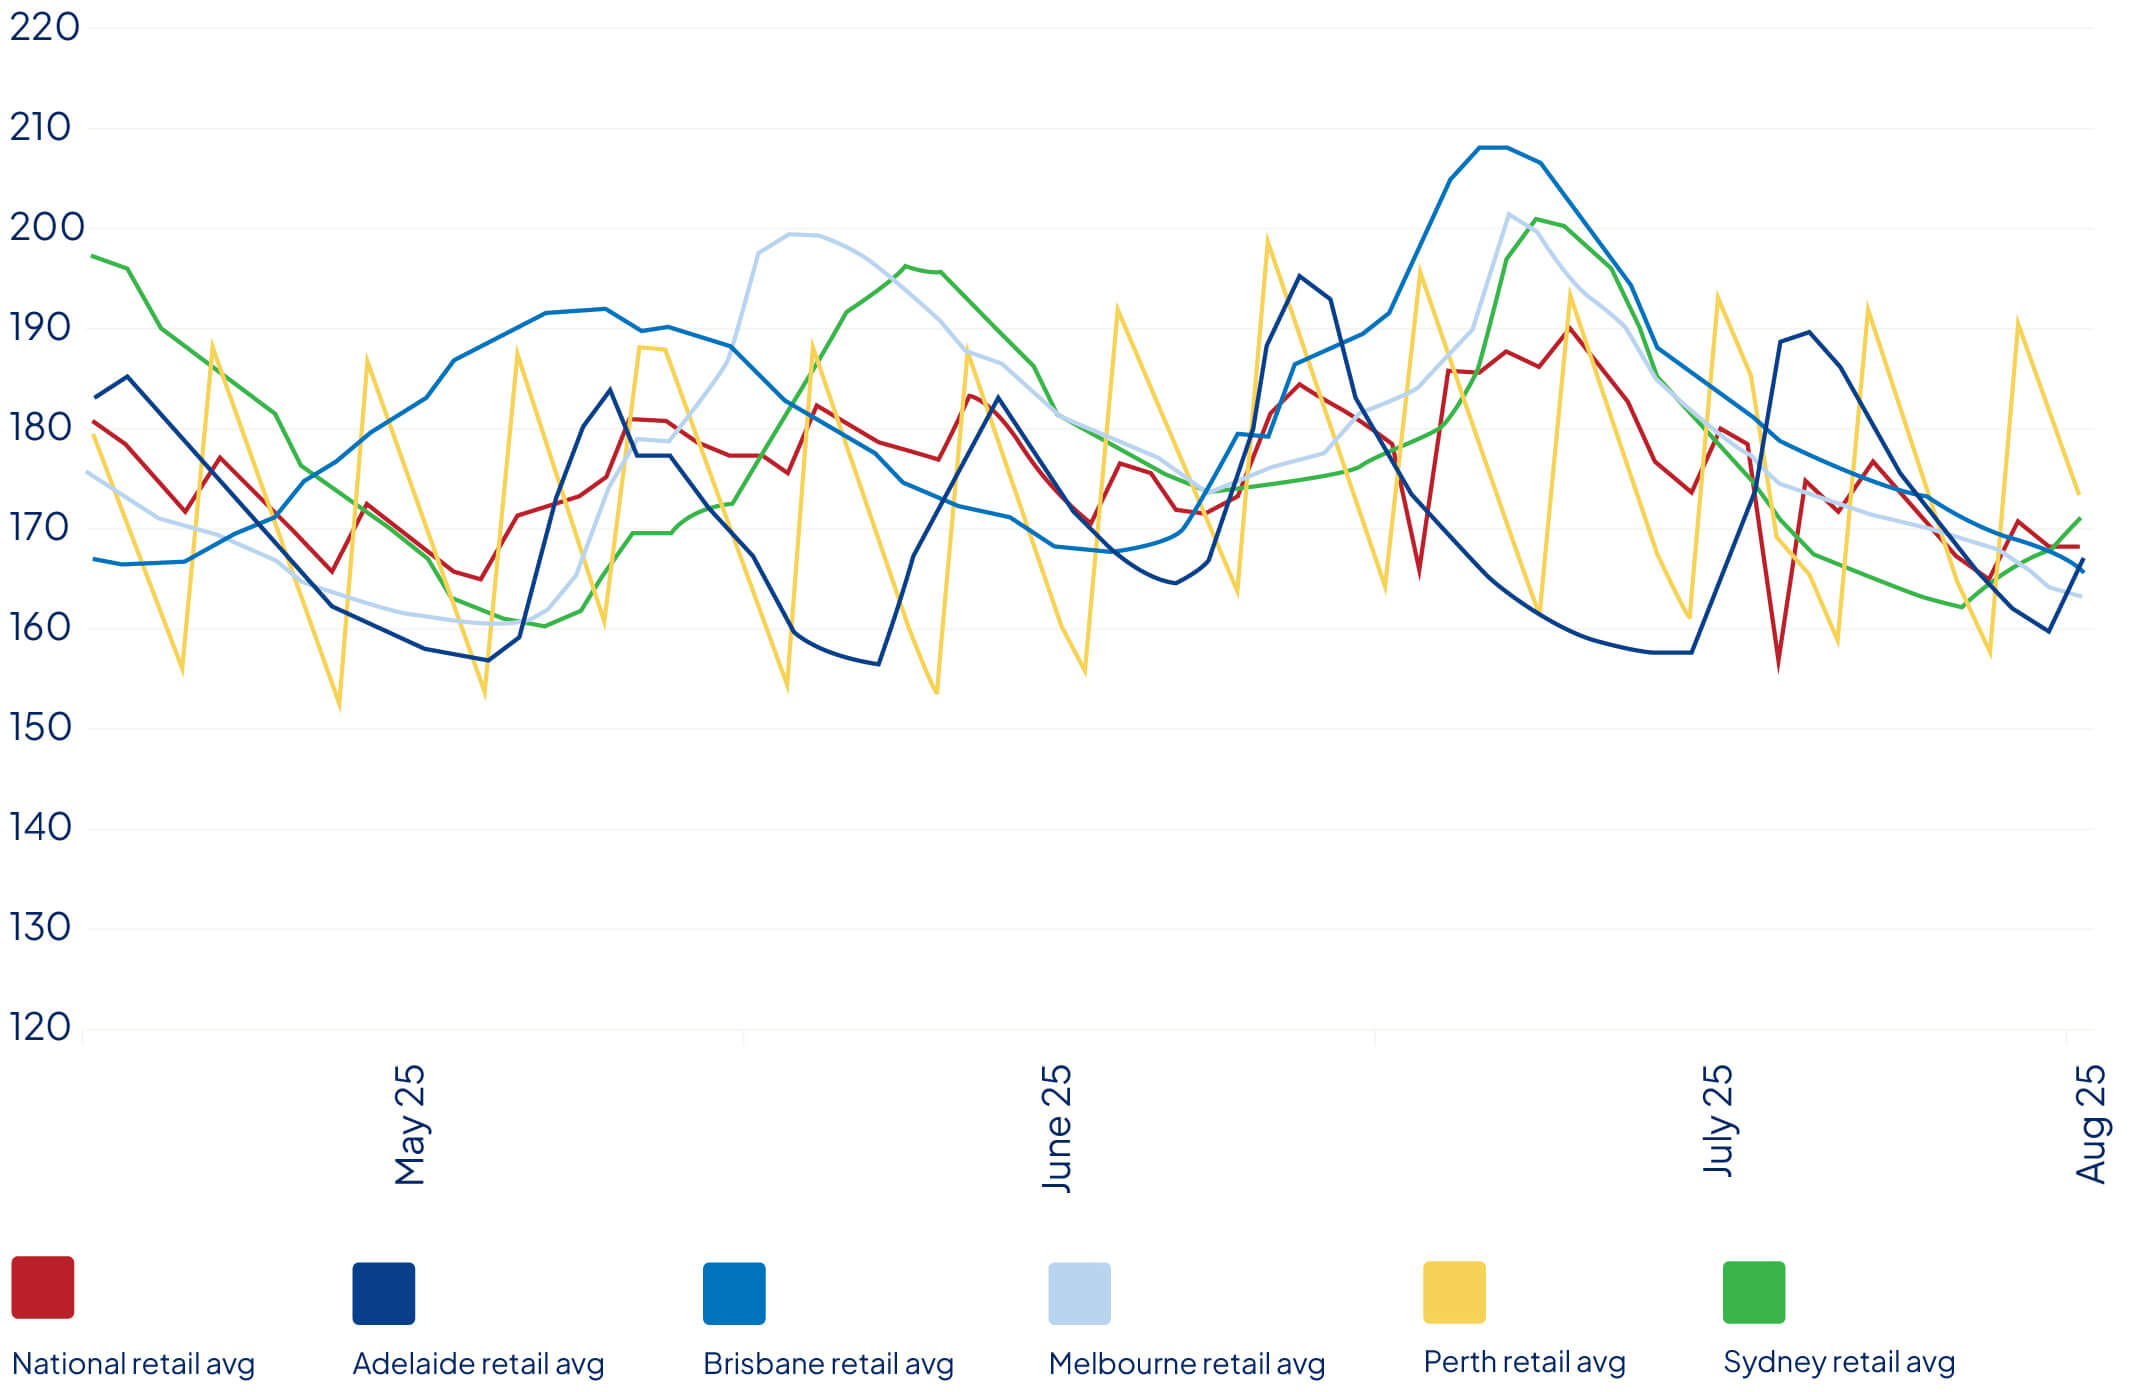
According to the ACCC:
“I love the Aussie outdoor lifestyle – surfing, camping, road trips. But with petrol prices hitting $2.20 a litre, those weekend adventures are getting too pricey. It’s not just about money; it’s about losing the laid – back, nature – loving way of life we’re proud of.”
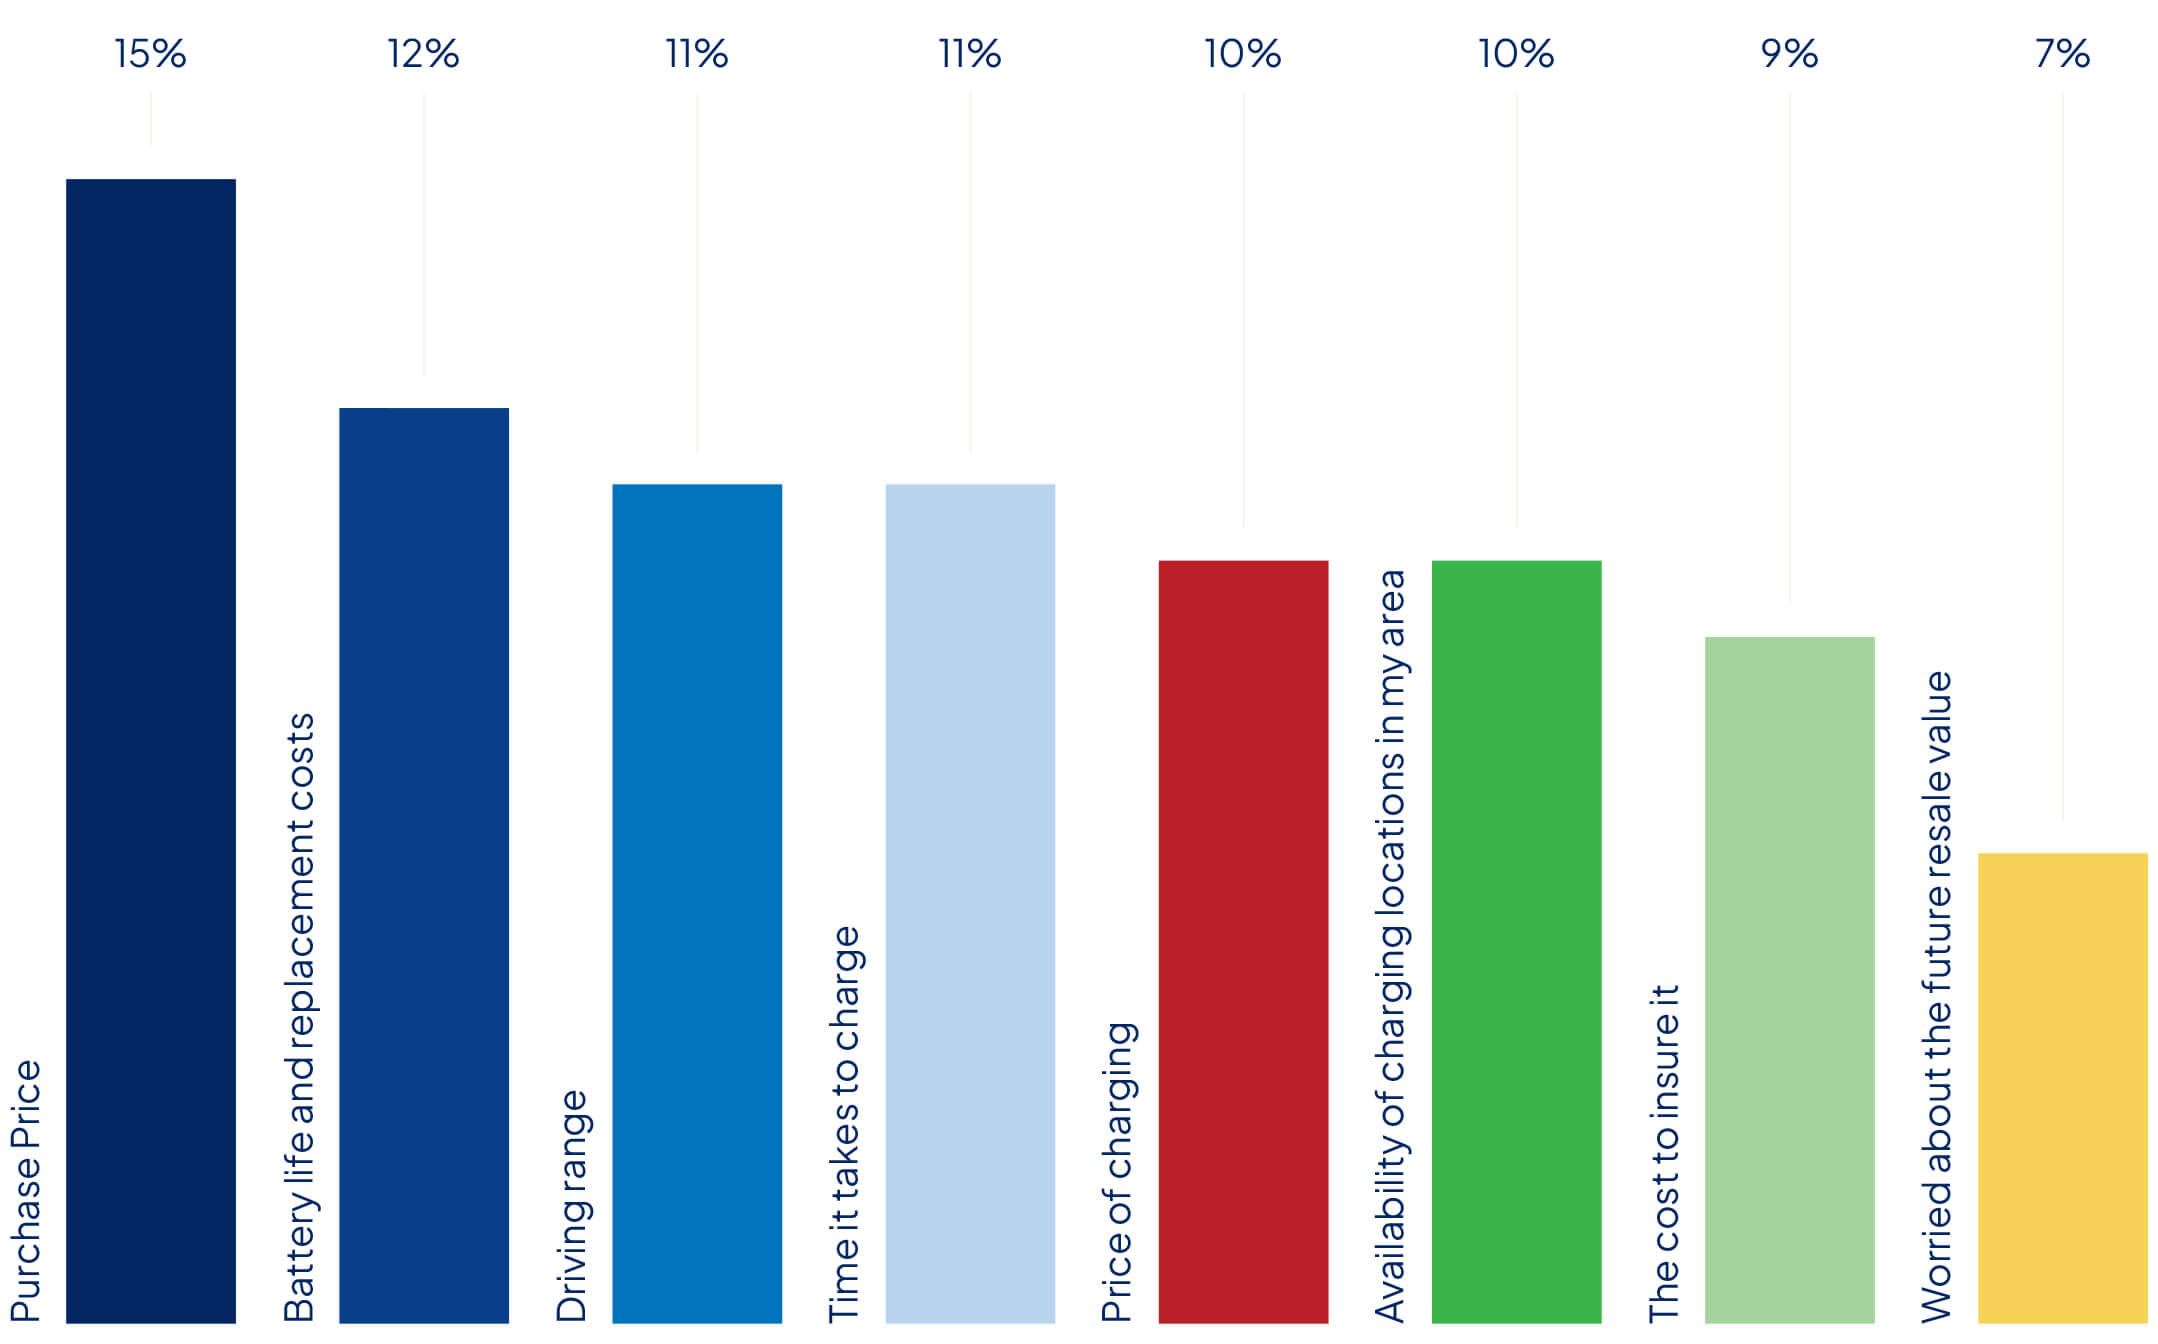
Over a third of Australians (38%) plan to make a new car purchase in the next three years. Only 9% of those people are considering a fully electric model, while 34% say they’ll go hybrid. More variety, cheaper models and charging station availability could increase uptake. An often-forgotten price barrier remains: insurance.
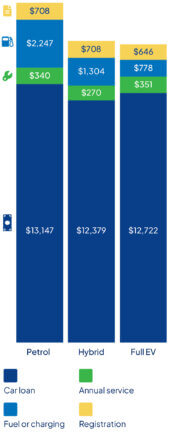
Compare the Market’s annual car running cost comparison study of three popular medium SUVs this year found a full EV model is still overall cheaper to run than a comparable hybrid and petrol model. However, there’s one big exception: insurance.
“Expect insurance prices to normalise as the market matures, but for now, don’t be deterred – shop around.”
– Adrian Taylor, Executive General Manager of General Insurance
Compare the Market tracks quote prices for comprehensive cover through its electric vehicle insurance index. In March, annual premiums for 10 popular pure battery-electric vehicle (BEV) models cost $2,100 on average. Quotes for 10 popular hybrid electric vehicle (HEV) and plug-in hybrid electric vehicle (PHEV) models were $1,600 on average.
| Average quoted battery electric vehicle insurance premium | $2,134.26 |
| Average quoted hybrid and plug-in hybrid EV insurance premium | $1,649.93 |
In each case, there was a significant price difference between the cheapest and most expensive quotes for the same vehicle.
The quoted difference between the cheapest and most expensive insurer was a shocking $3,100 for the Tesla Model 3 EV, $1,456 in the case of the Toyota RAV4 Hybrid, and $885 for the BYD Shark 6 PHEV.
With price gaps this big, it pays to shop around.
“We found a shocking difference between quotes from different insurers that could mean some motorists end up paying hundreds – sometimes thousands – more than they need to.”
– David Koch, Economic Director
Amid cost-of-living pressures and fluctuating fuel prices, EVs could be a cost-effective solution.
With greater model choice, a fringe benefits tax exemption for novated leasing eligible EVs and the New Vehicle Efficiency Standard (NVES), consumers and automakers are being incentivised to drive and sell low-emission vehicles.
Still, the initial outlay, price of charging, battery replacement and cost of insurance remain top barriers for Australian consumers.
Rebates have provided a shield against rising energy costs
The median quarterly electricity bill remained steady at $350 ($1,400 per year) in 2025 – equal to median spend in 2024, according to Compare the Market’s 2025 Household Budget Barometer.
Government rebates have helped offset rising prices. All households received up to $300 in energy bill relief in FY24/25. This was followed by another rebate up to $150, to be applied in two $75 installments by the end of 2025.
There have also been state-based hand-outs, including a $1,000 rebate in Queensland and $400 for households in Western Australia.
| Single-person household | $270/quarter ($1,080 a year) |
| Couple household | $300/quarter ($1,200 a year) |
| Family with kids/group households (3+ household) | $400 quarter ($1,600 a year) |
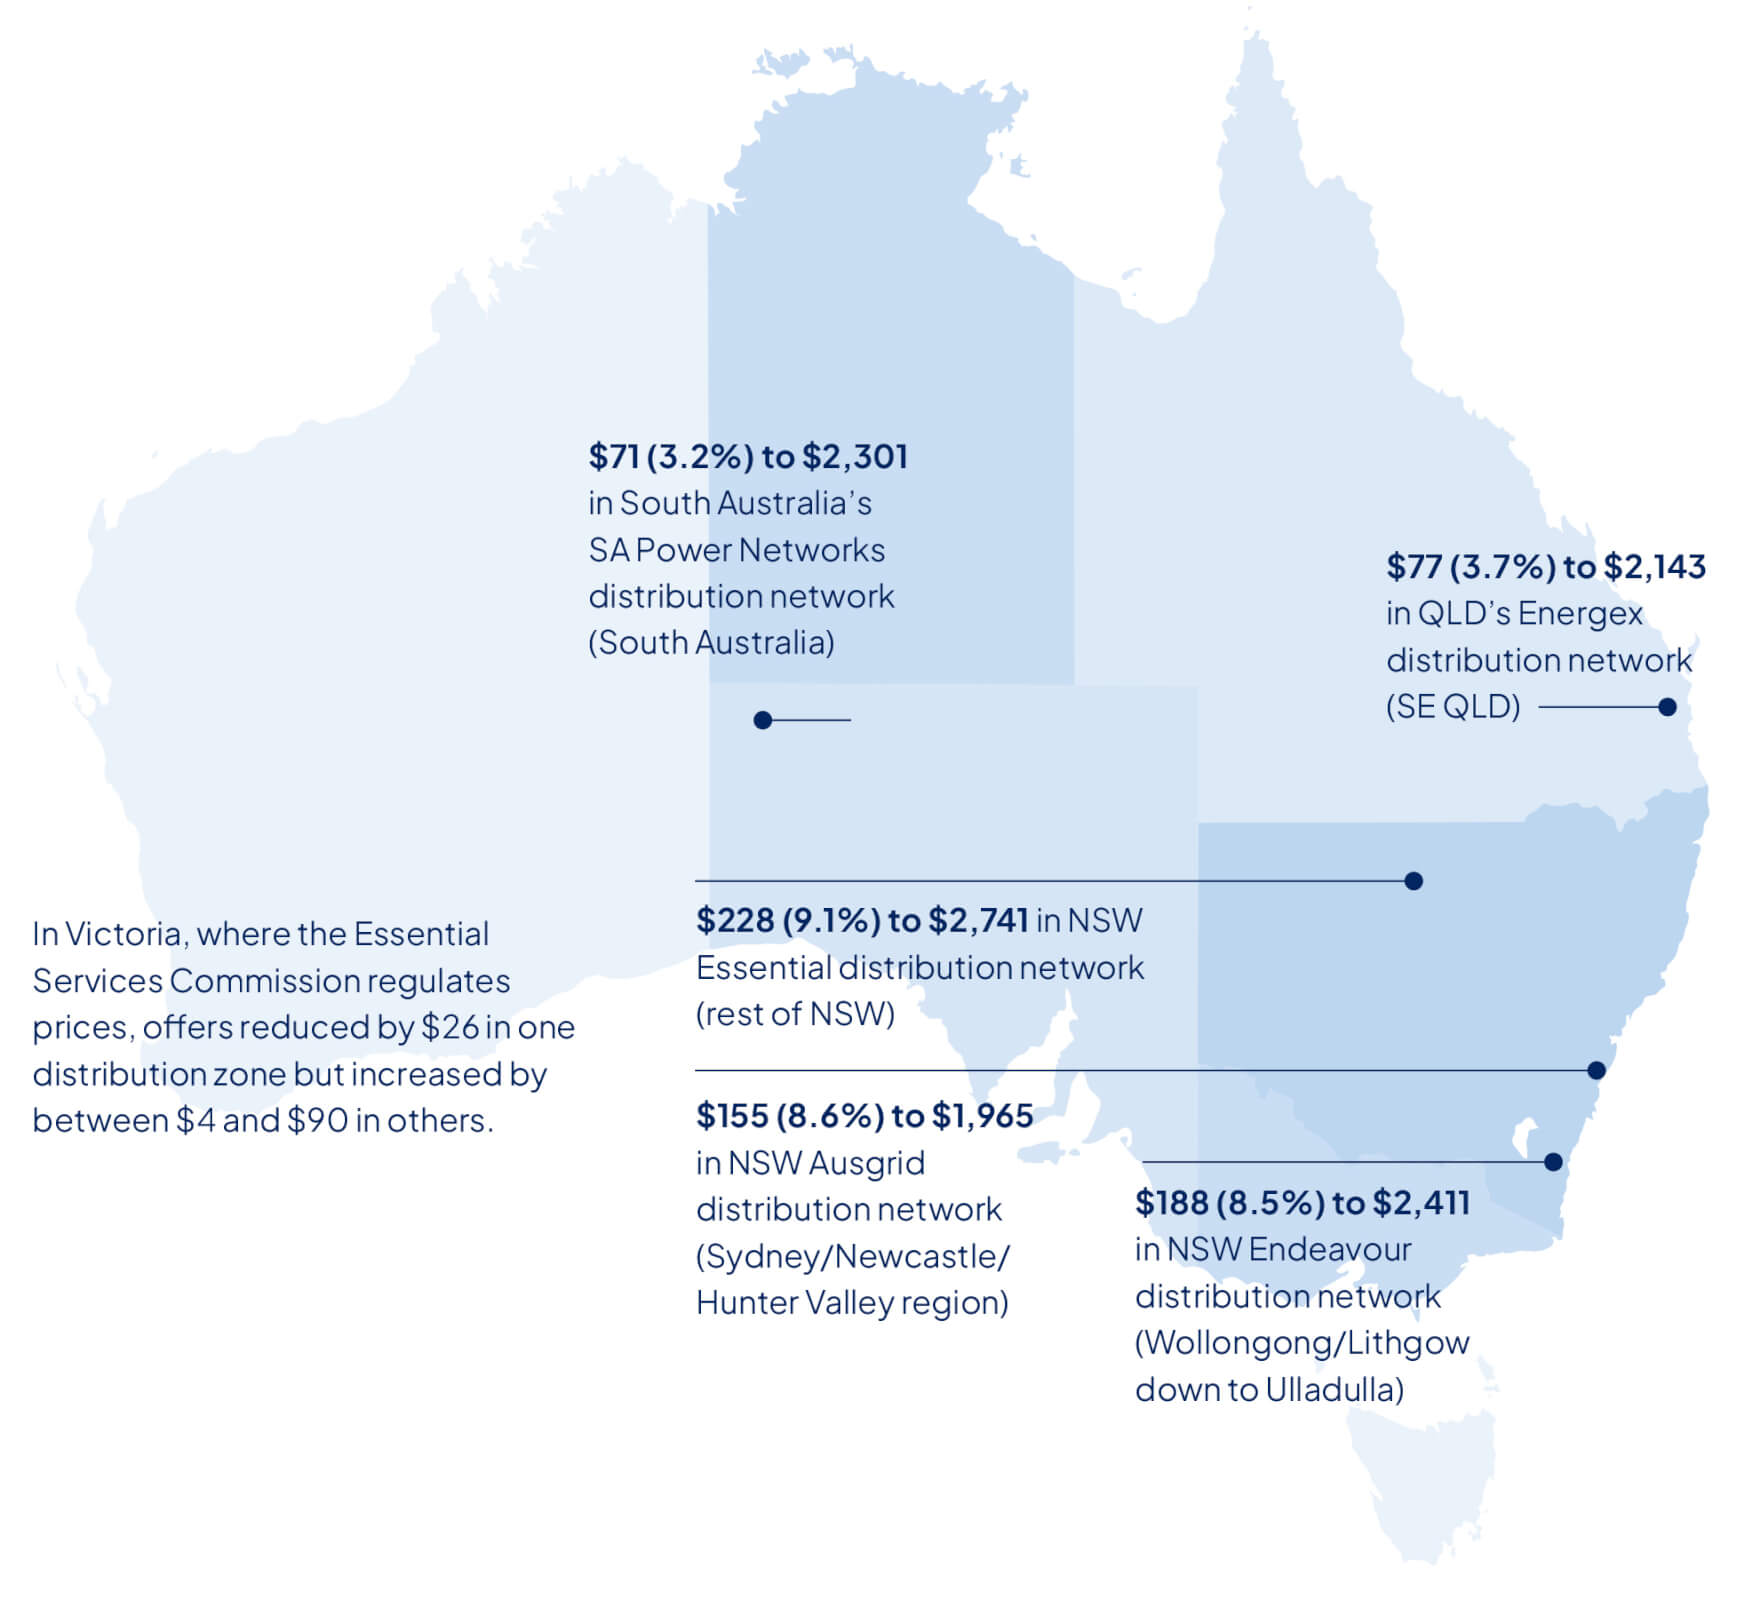
While electricity bill spending appears to have plateaued in 2025, default offers in many regions increased.
In July, the average annual household electricity bill for residential customers without a controlled load on the Default Market Offer (DMO), increased by:
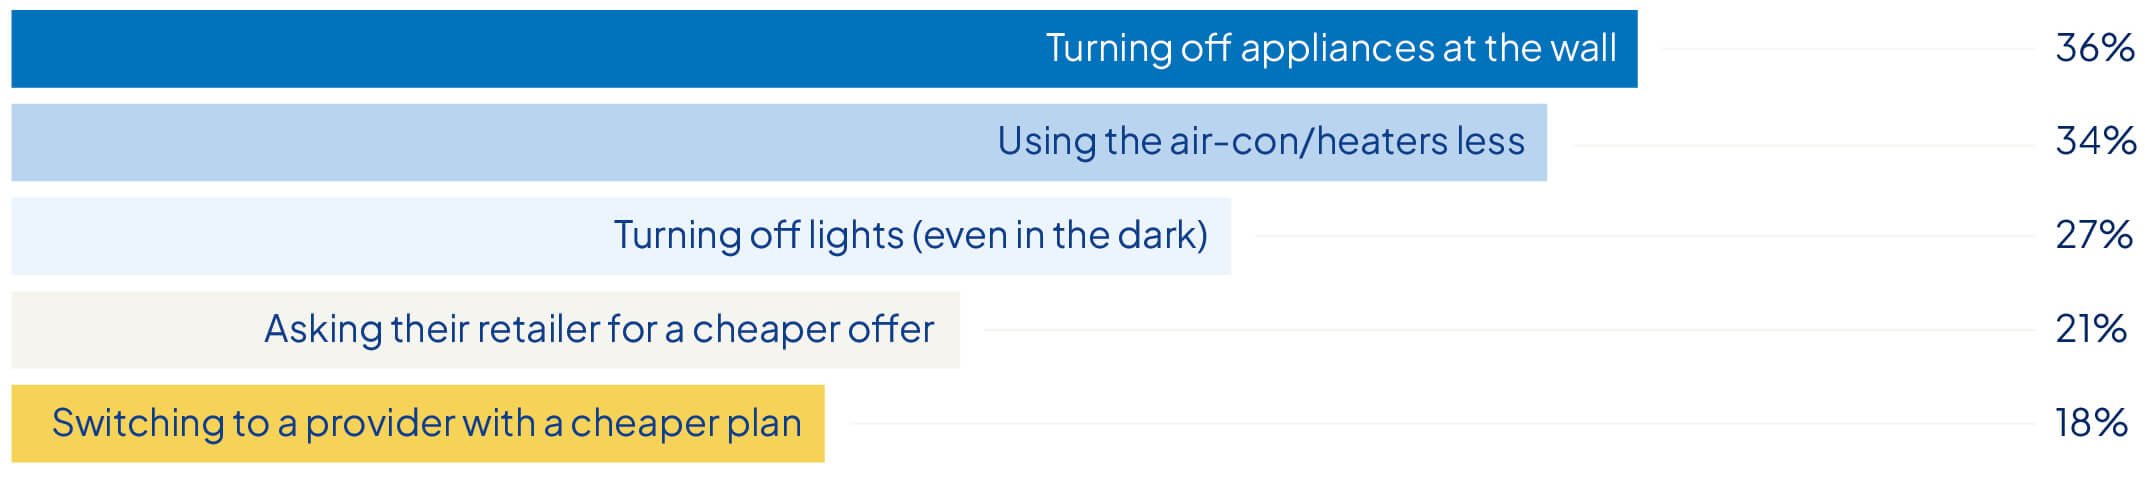
Around three quarters (77%) of Australians have taken action to reduce their energy spending, according to a pulse survey in March 2025. Top tactics include:
Wholesale prices only account for a third of what makes up an energy bill. A range of other factors influence prices, including:
Australians are fighting back against price pain at the supermarket
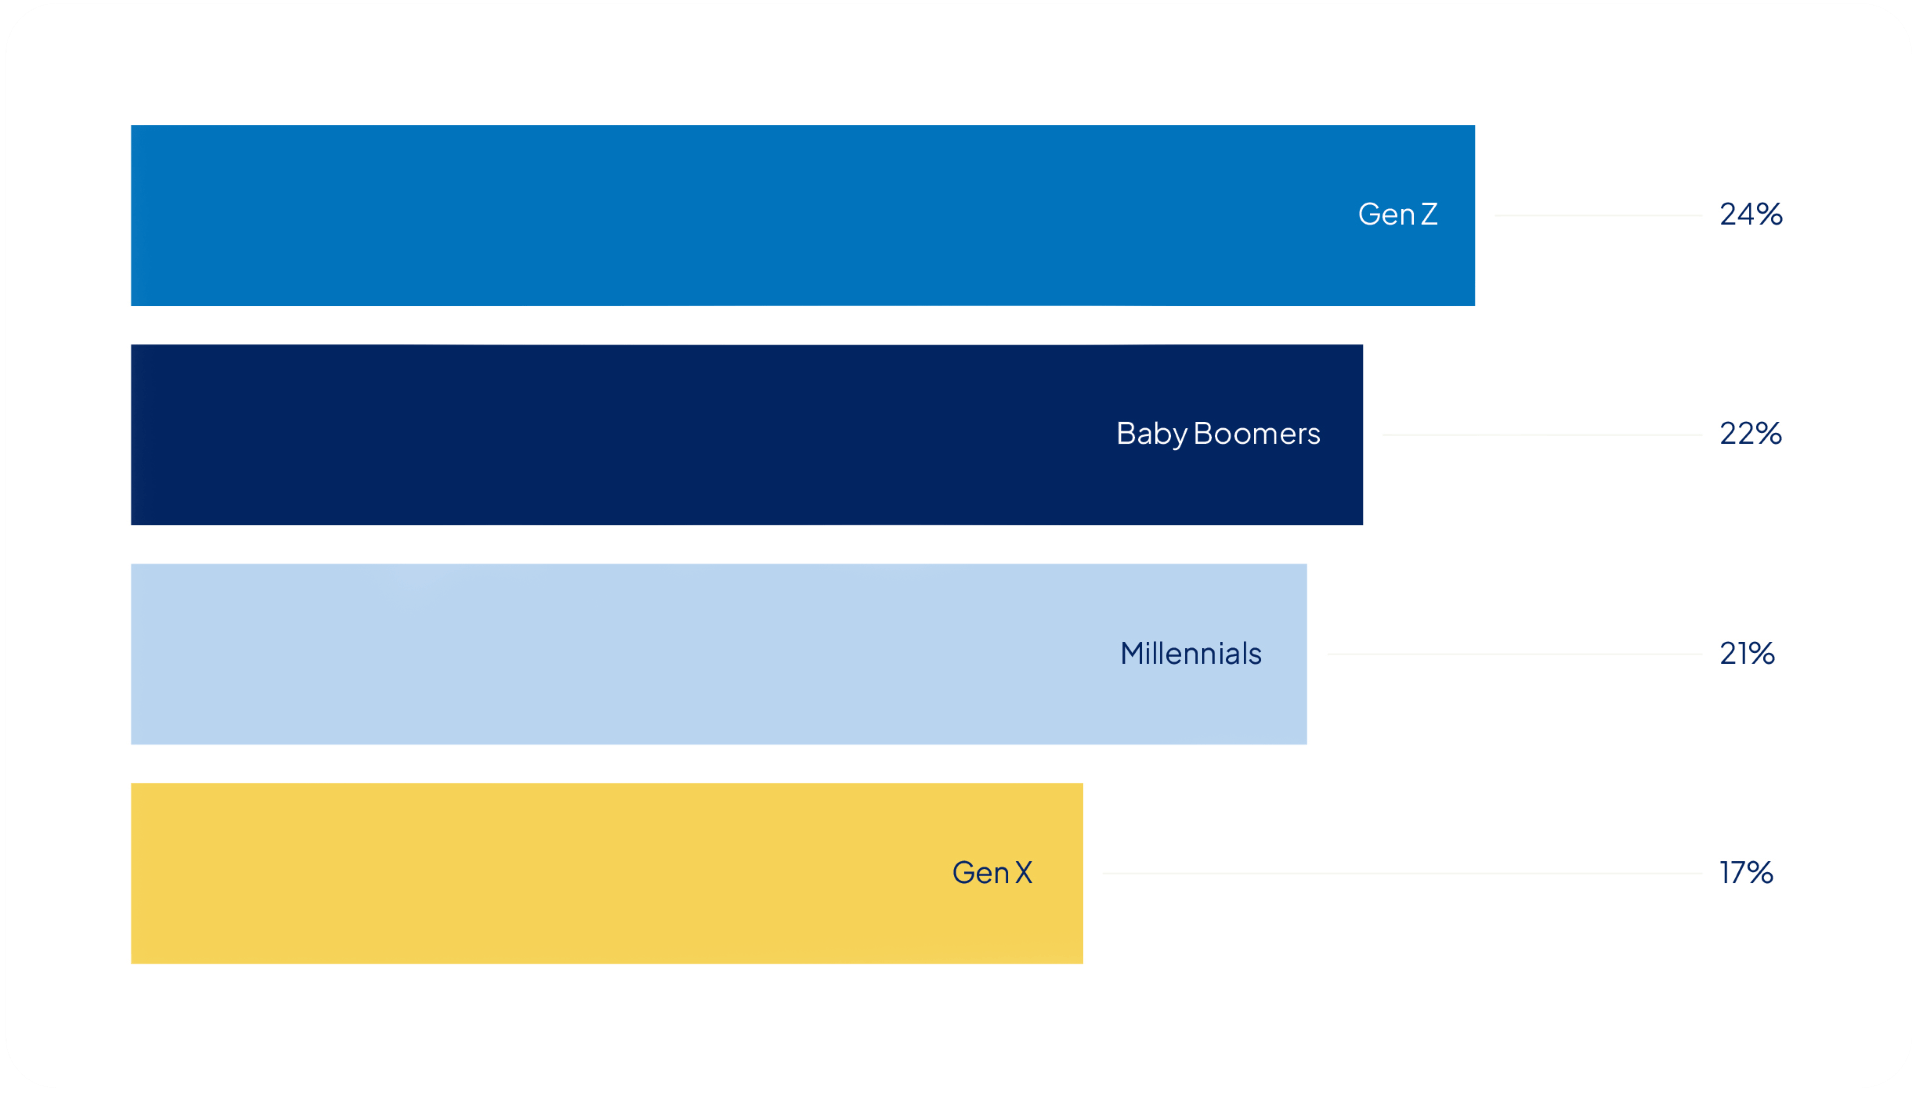
Spending at the supermarket remains a top concern for many. One in five Australians surveyed (21%) rated groceries as their most worrisome household bill.
Gen Z is feeling the pinch the most, with close to a quarter (24%) of the cohort listing grocery costs as their top household concern.
The average Australian spends $198.16 on groceries each week, equal to $858.69 each month and $10,304.32 annually.
Compared to January 2024, the weekly spend is up $6.50 (3.39%), which equates to $338 more a year.
While $6.50 in isolation doesn’t sound like much, it adds up over a year. In real terms, it’s about one and a half extra grocery shops a year, around six weeks of petrol or more than a month of health insurance premiums for the average Australian surveyed.
| Location | Weekly Spend groceries January 2024 | Weekly spend groceries August 2025 | Dollar difference Jan 2024 – August 2025 | Percentage difference Jan 2024 – August 2025 |
| National | $191.66 | $198.16 | +$6.50 | +3.39% |
| NSW | $195.94 | $193.69 | -$2.25 | -1.14% |
| QLD | $172.29 | $200.29 | +$28.00 | +16.25% |
| SA | $167.21 | $190.61 | +23.40 | +13.99% |
| VIC | $199.25 | $198.02 | -$1.23 | -0.61% |
| WA | $178.17 | $209.78 | +31.61 | +17.74% |
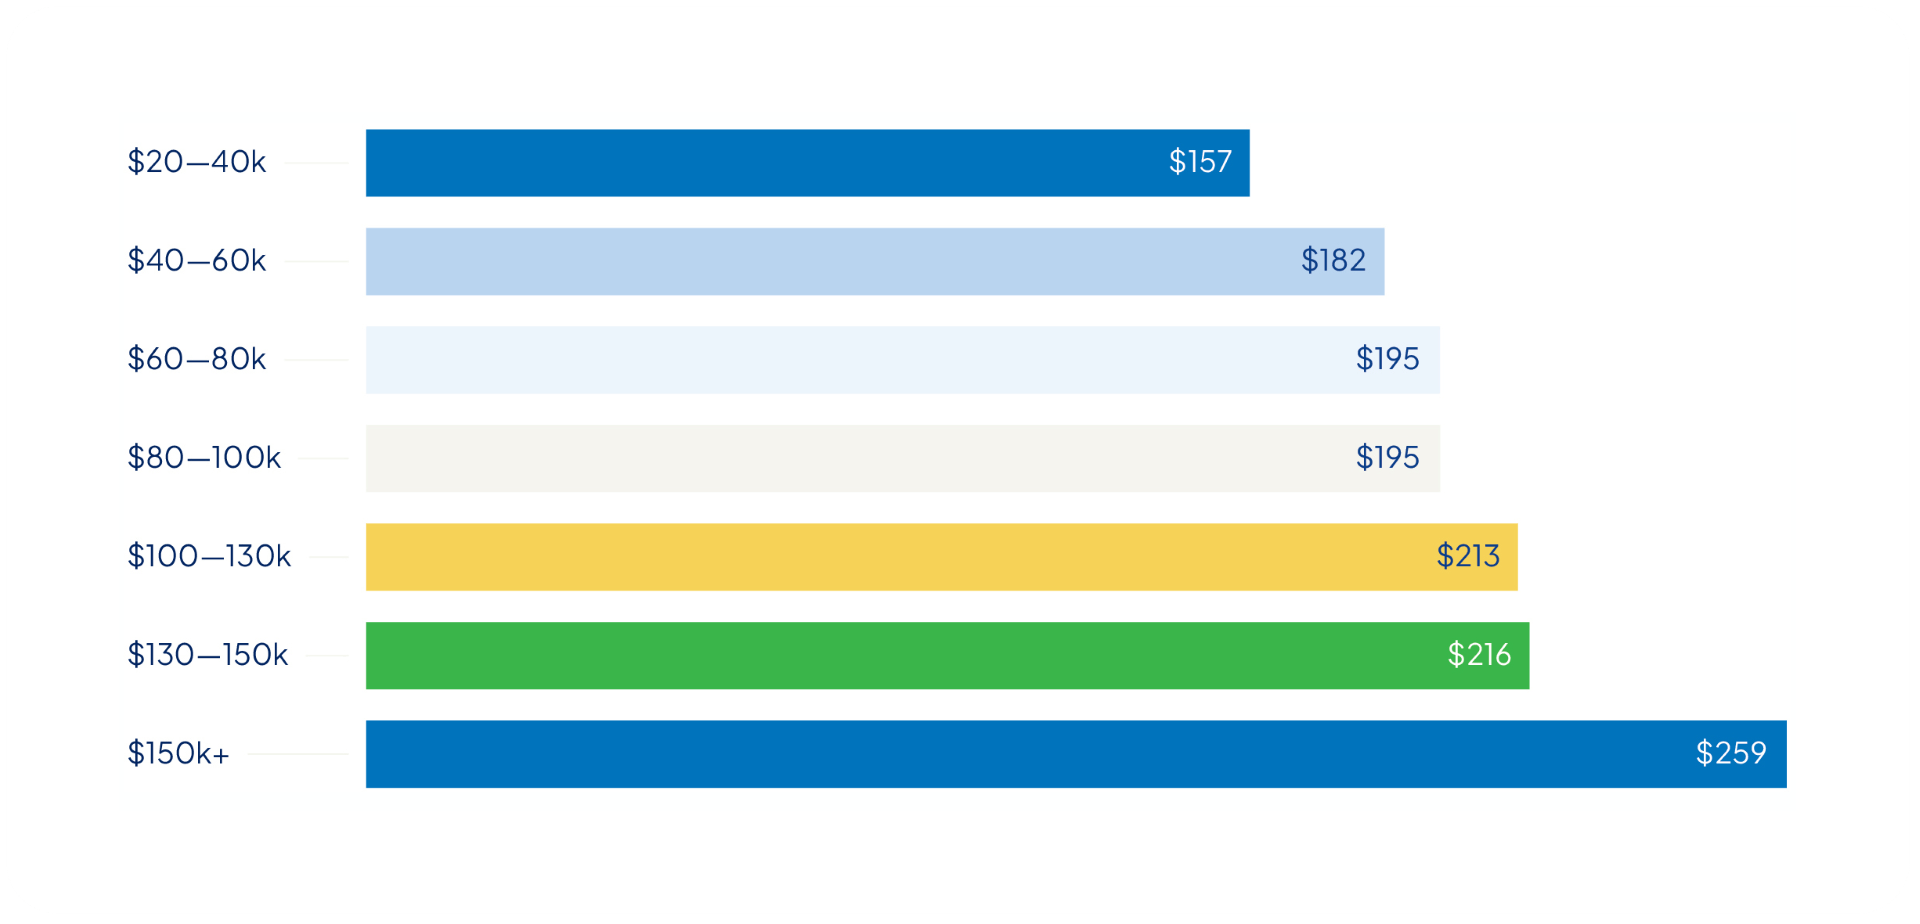
The more money Australians earn, the more they spend on groceries. Our analysis shows lower income earners ($20,000 – $39,999) spend an average of $157.15 per week on groceries, or $102.18 less than the $259.33 average those earning more than $150,000 spend. Over a year, higher income earners spend $5,313.36 more on average for groceries than their lower income counterparts. The weekly grocery spend increased for each higher income bracket in our analysis.
Top tactics Aussies use to reduce supermarket spending:
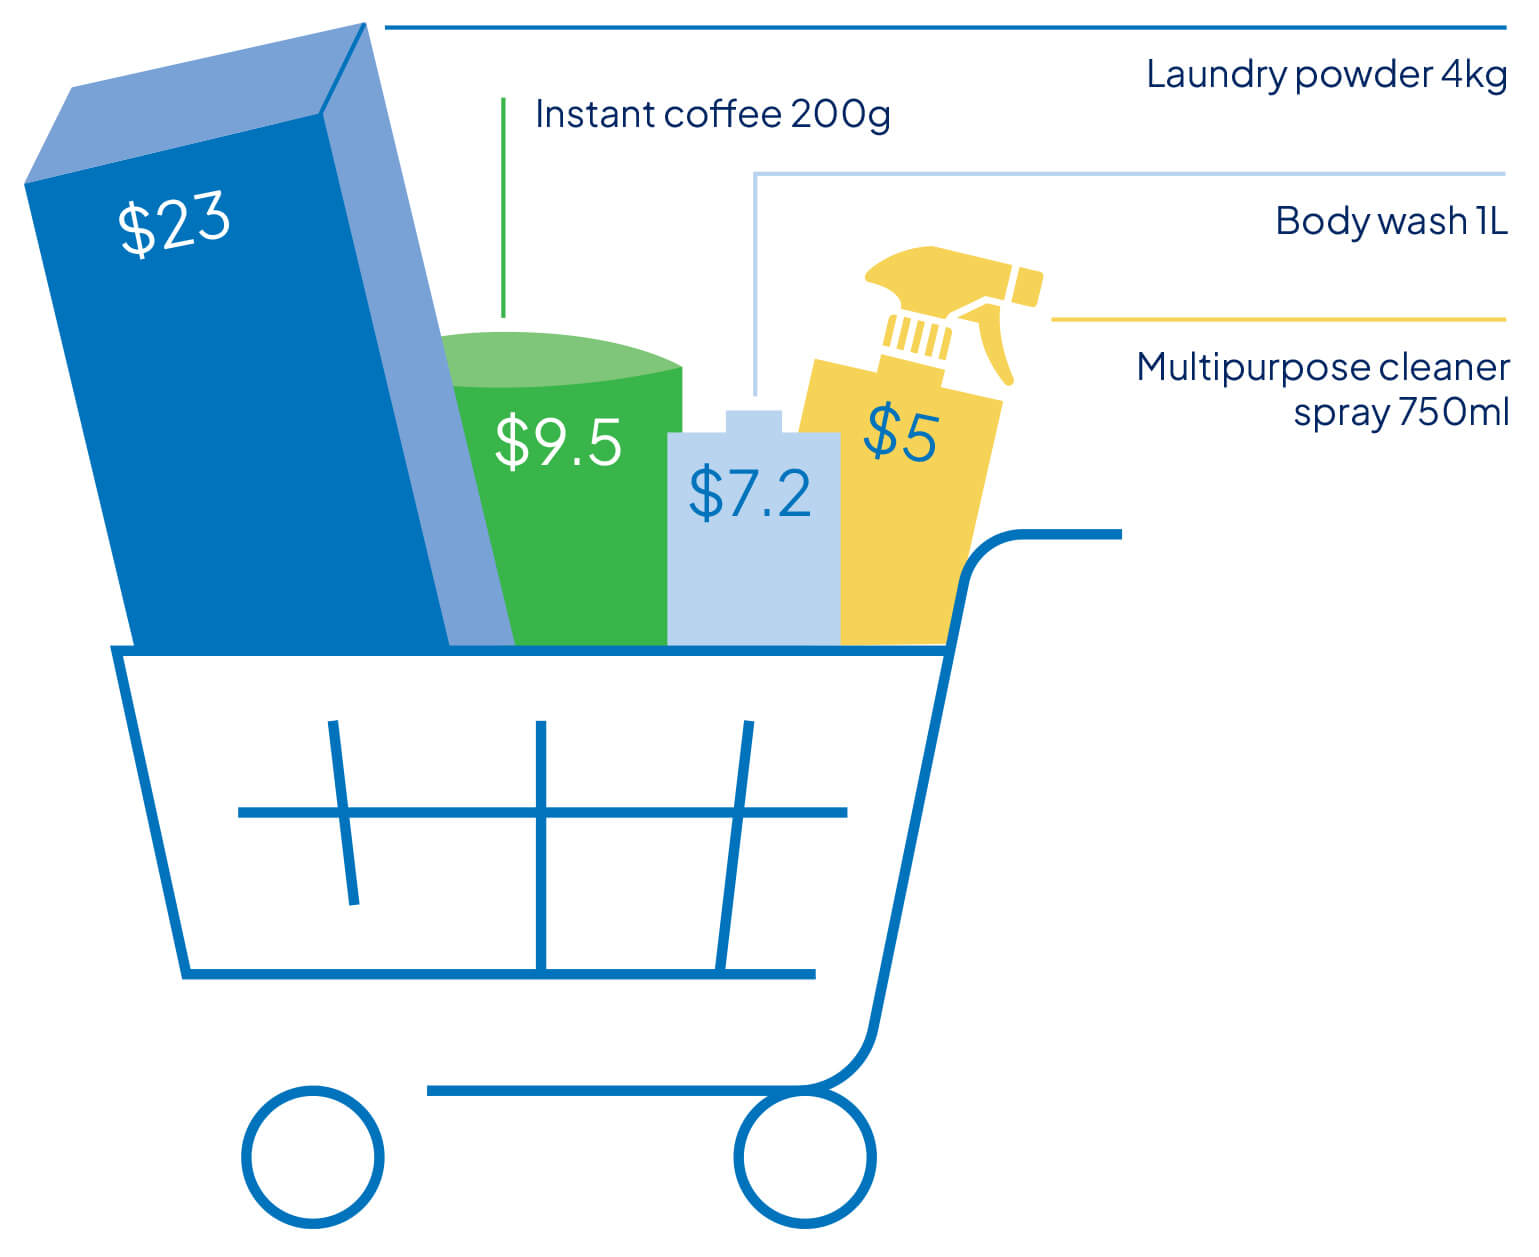
Compare the Market’s annual grocery haul revealed Aussies could cut their total basket spend almost in half by switching from well-known, named brands to generic home brand products.
We looked at 20 common household items at two major supermarkets and found Aussies could spend around $164 for a basket of named brand items or around $83 for similar generic or home branded items – representing a reduction of nearly 50%.
The products with the biggest price differences included:
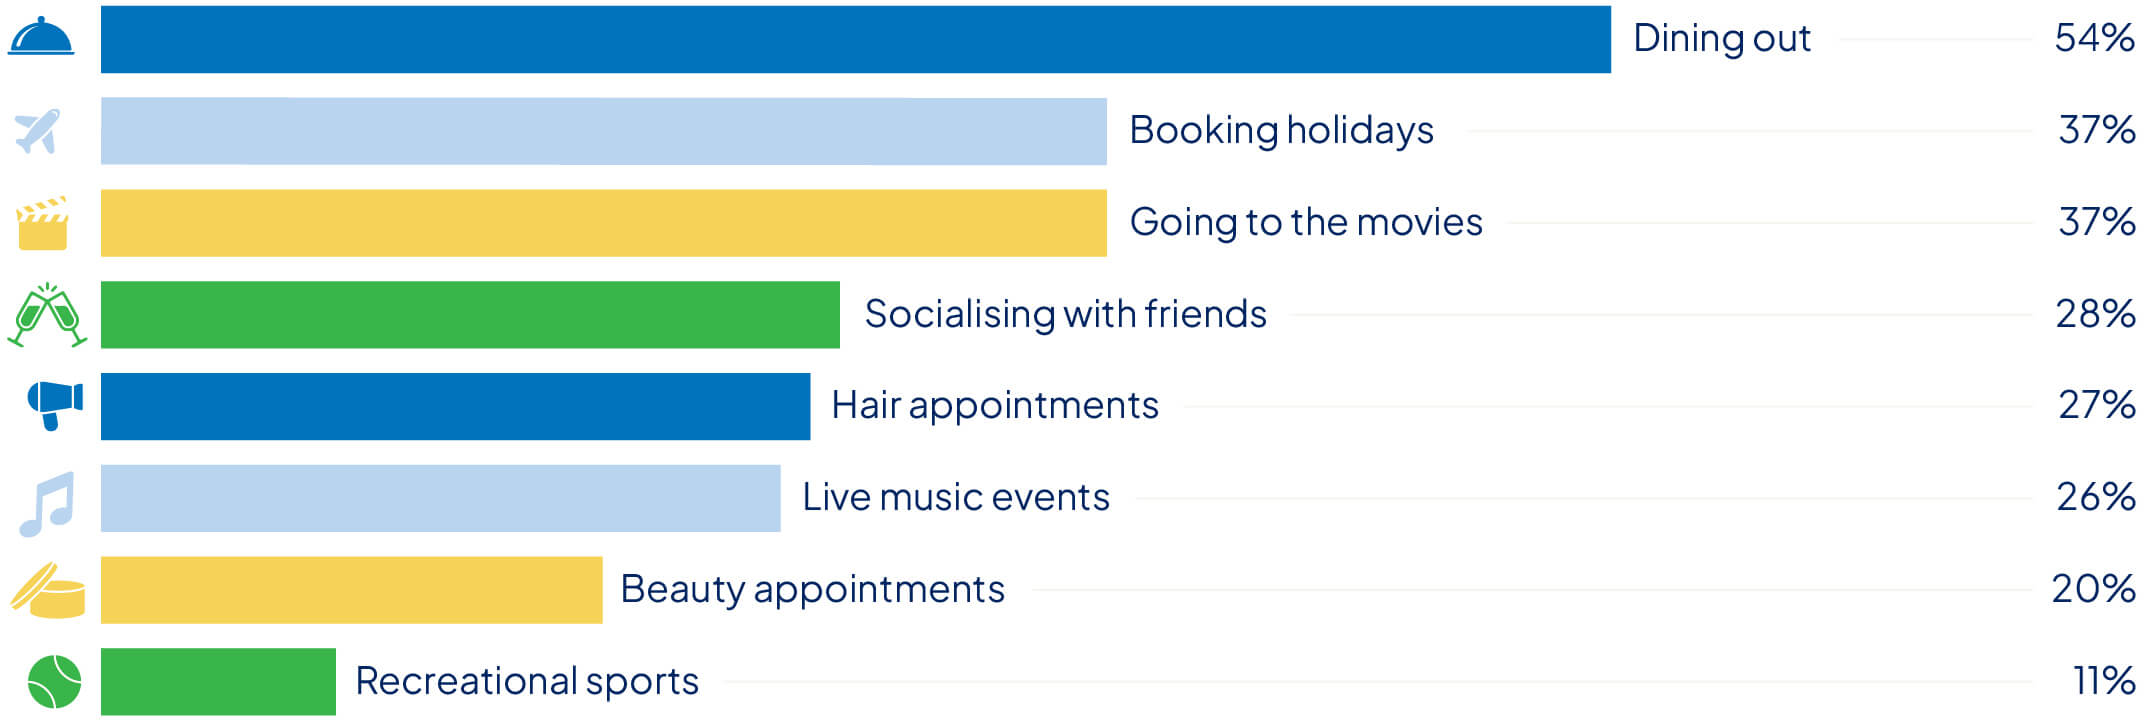
Little luxuries like holidays and family outings have also taken a hit.
With focus turning to everyday essentials, the social lives of many Australians have taken a back seat over the past 12 months.
Many Aussies have cut back on little luxuries like holidays, dining out, hair and beauty appointments, concerts or going to the movies.
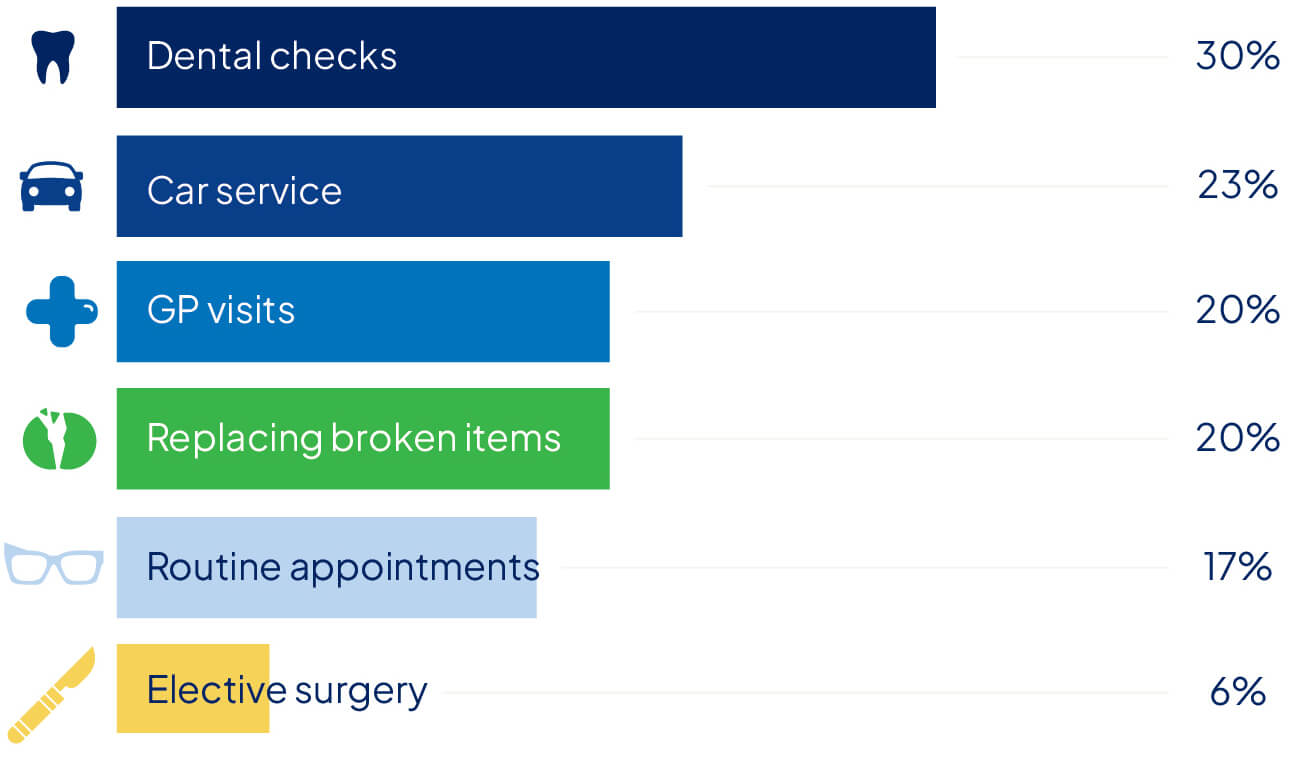
Concerningly, health appointments, home repairs, car maintenance and even vet visits have also been neglected due to rising cost-of-living pressures.
“We eat out or buy takeaway only very occasionally now. We used to do that without hesitation before.”
“We’ve had to ask family members for money just to pay bills.”
“I don’t go out for coffee with friends anymore, we go to each other’s house.”
Australians are working smarter, not harder, to save money in 2025.
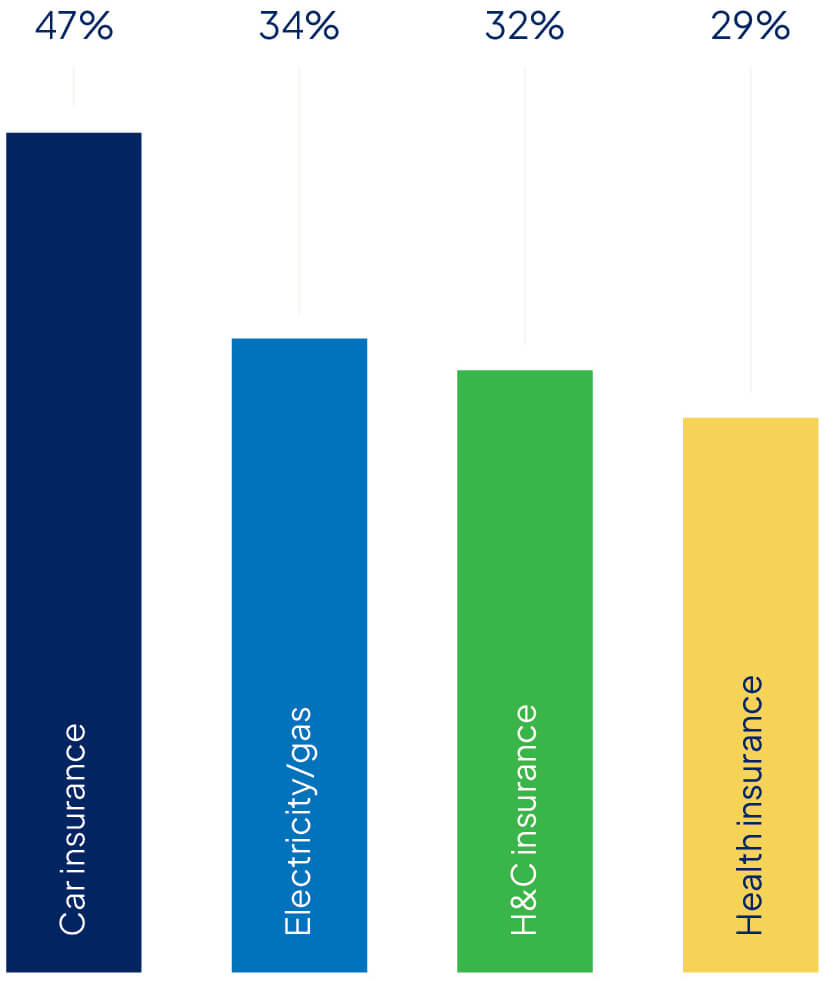
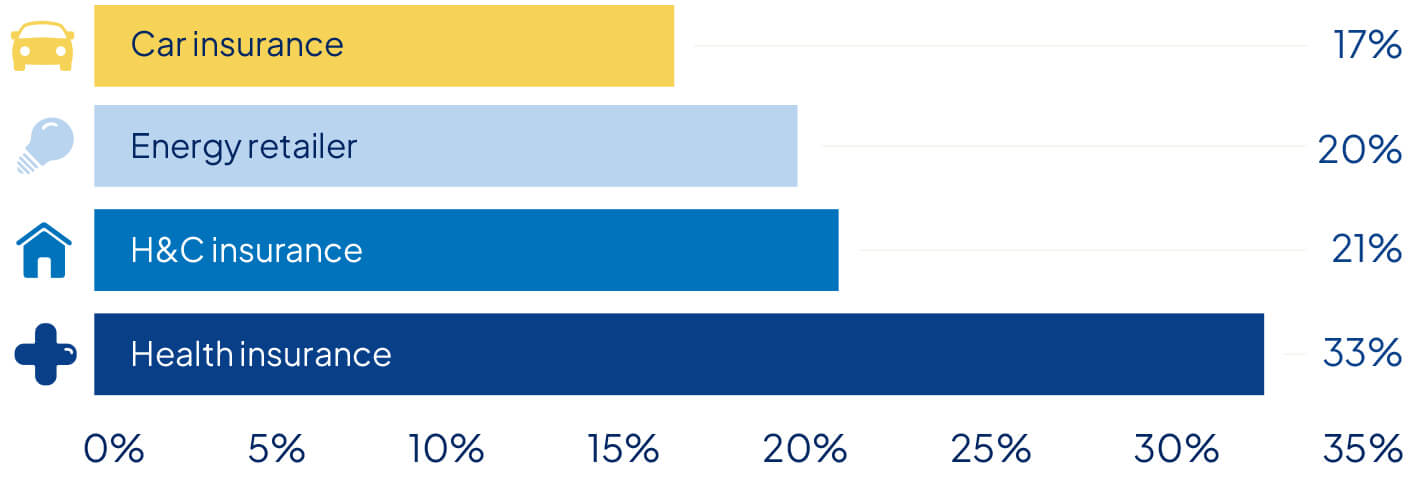
The majority of Aussies surveyed (73%) told Compare the Market they had have shopped around for a better deal in the past 12 months.
The most popular place to look for savings was car insurance, with almost half of Australians (46.6%) hoping to switch gears with a cheaper policy.
Around one-in-three participants had compared energy plans. A quarter had looked for better offers for their home and contents insurance and a similar number had compared private health insurance.
“Australians are taking control of their biggest bills. They want to keep more money for themselves… that means handing over less to line big corporate pockets.”
– David Koch
Not everyone is scrutinising their bills, though.
Of the 27% of people who had not shopped around in the past 12 months, most said they haven’t compared because:
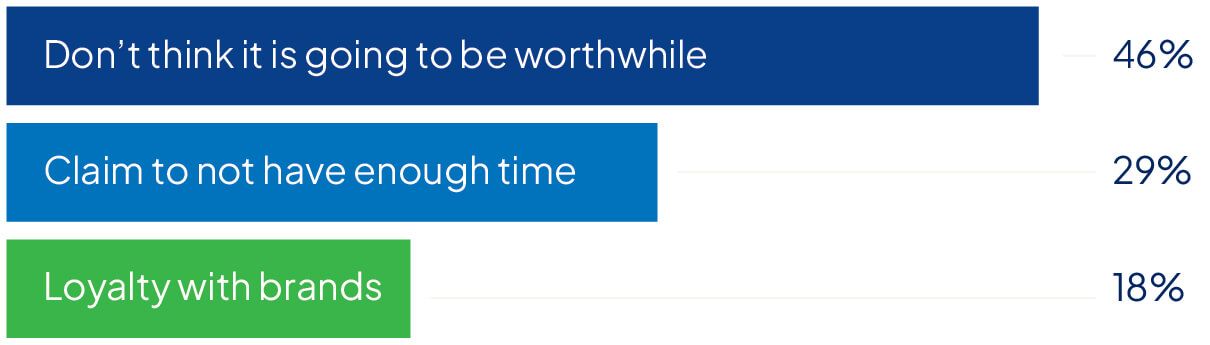
Customers who remain loyal could be missing out on significant savings. The experts at Compare the Market routinely find big price gaps between similar products from different retailers.
An alarming number of Australians have stayed loyal to the same provider for more than 10 years.
Consumers were most attached to their private health fund, followed by their home and/or contents insurer.
A staggering number of Australians surveyed have been loyal for five or more years including: 58% of health insurance customers, 48% of home and contents customers, 47% of energy customers, and 40% of motorists with car insurance.
Consumers should be wary of marketing messaging on bills around so-called “loyalty discounts”. Better deals and perks are often reserved for new customers, so don’t assume you’re on a good offer until you’ve shopped around.
Allowing insurances to auto-renew could also mean paying for features you no longer want or need to use. It’s worth reviewing your policies each year to make sure they’re a good fit for your needs.
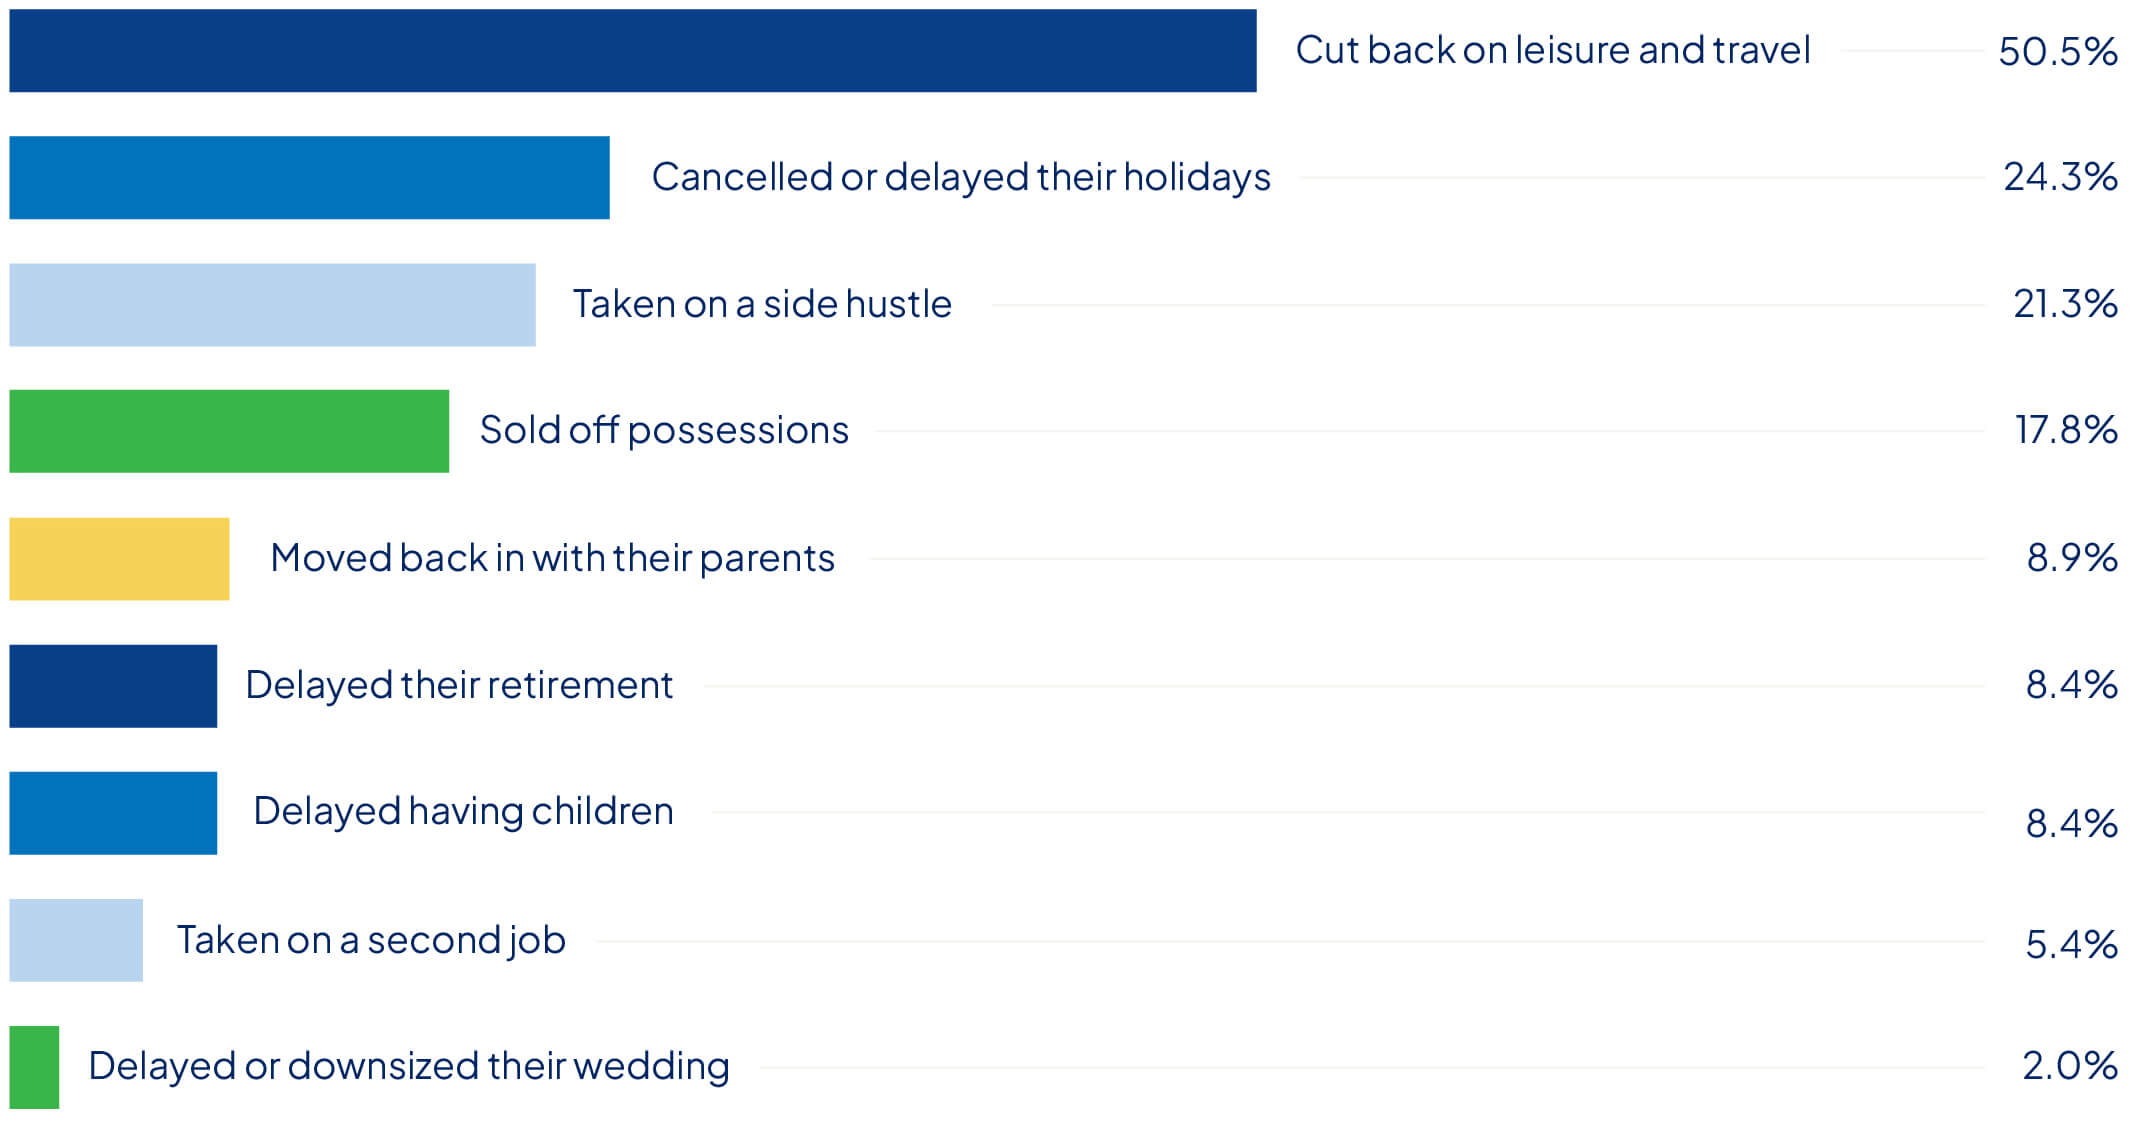
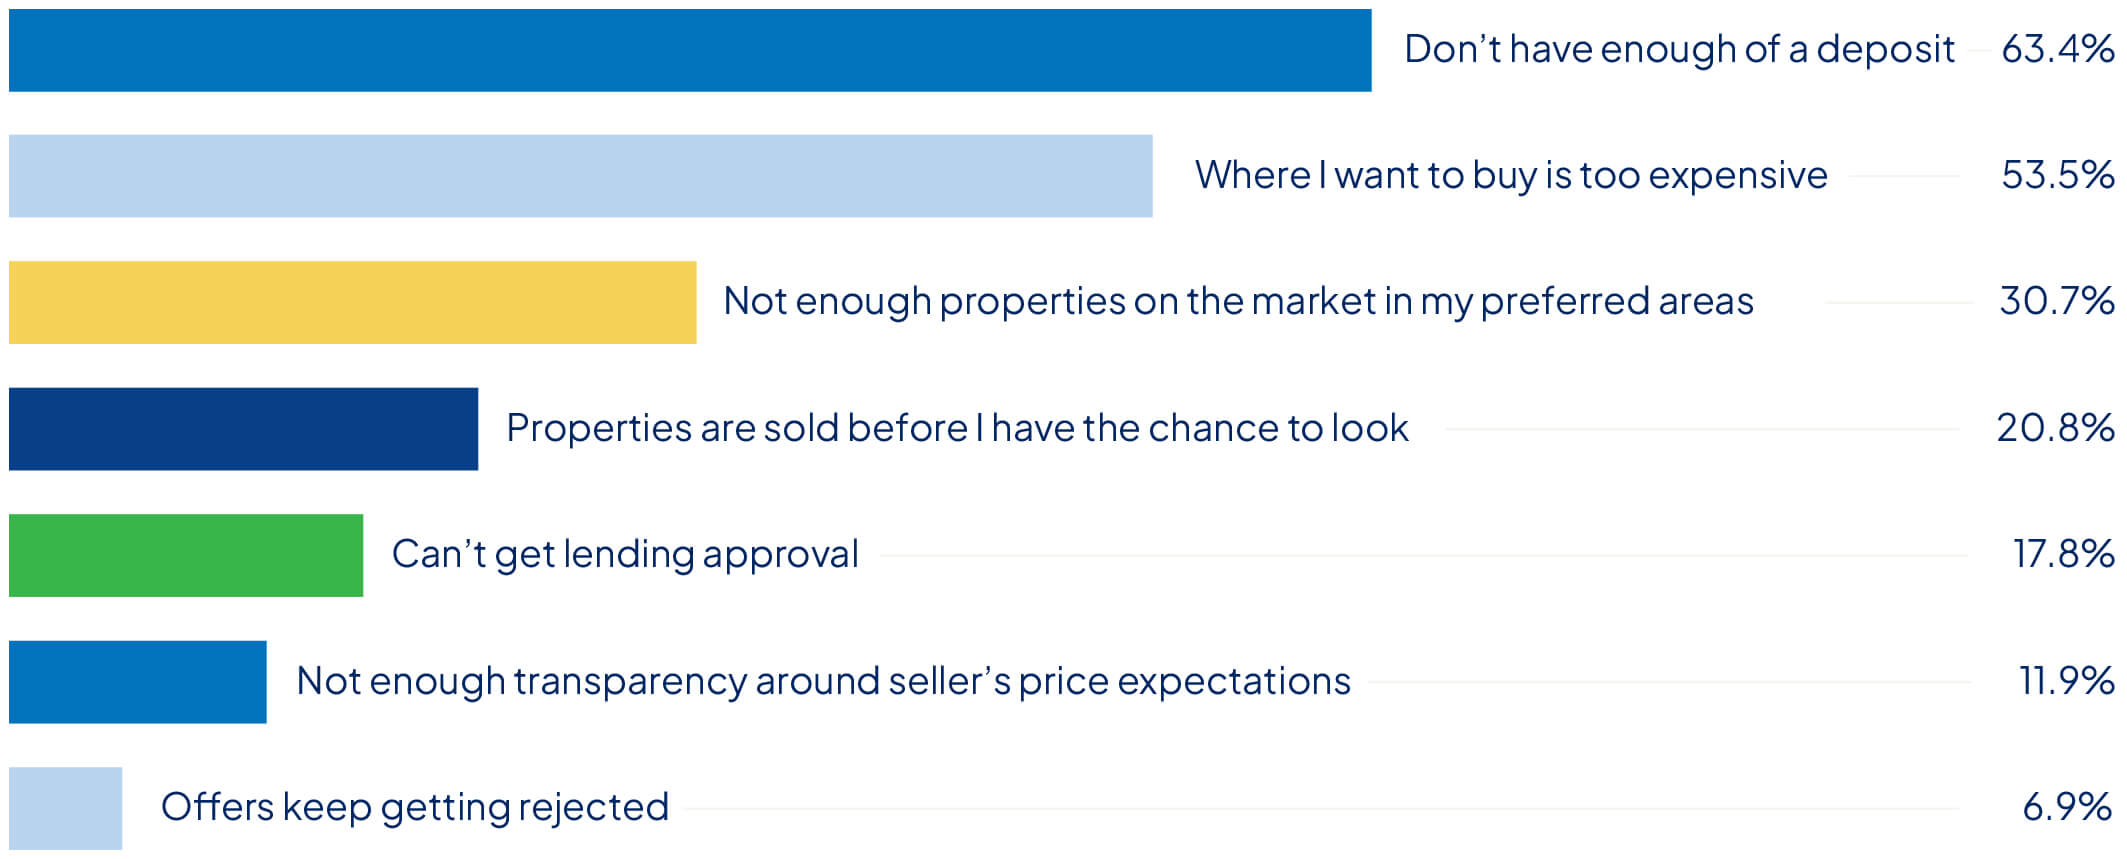
Raising a deposit remains the biggest hurdle for 63% of aspiring buyers, despite the vast majority making sacrifices like cutting back on travel and leisure in order to save.
Several government initiatives such as the Help to Buy shared equity scheme aim to remedy this by chipping in equity contributions of up to 40% for eligible homes.
However, there are limitations on the kinds of properties that can be purchased through the scheme, including value caps that will rule out houses in many metropolitan areas.
Around 29% of homeowners with a mortgage said they received financial help from their parents with 13% receiving money towards a deposit.
The median amount gifted was $40,000.
Around 53% of buyers said their desired areas had become too expensive, while 31% said there just weren’t enough properties on the market in their favoured suburbs.
One in ten buyers said a lack of transparency around seller’s expectations had become a barrier in their property search.
“If you were buying anything else — car, a TV or a beer at the pub — you’d be appalled if a price wasn’t quoted. We deserve better when it comes to property in Australia. Time to stop playing pricing games and give us back a free market.”
– Andrew Winter
Rate cuts will have returned hundreds of dollars to Australian borrowers over the past year.
Someone with an average $678,000 loan may have seen their repayments reduced by as much as $329 a month – or $3,948 a year – assuming their banks passed on the discount.
While homeowners have struggled with higher rates, many have benefited from positive value growth.
National dwelling values grew 3.4% on average over the year to July 2025, according to Cotality’s Hedonic Home Value Index.
Over 60% of homeowners surveyed believed they had $500,000 or more in equity, with around 18% estimating their equity exceeded $1 million.
| What if interest rates change by – 1.00%? | ||
| New interest rate 5.00% | Your new repayments $3,640 per month | Your repayments will reduce by $425 per month |
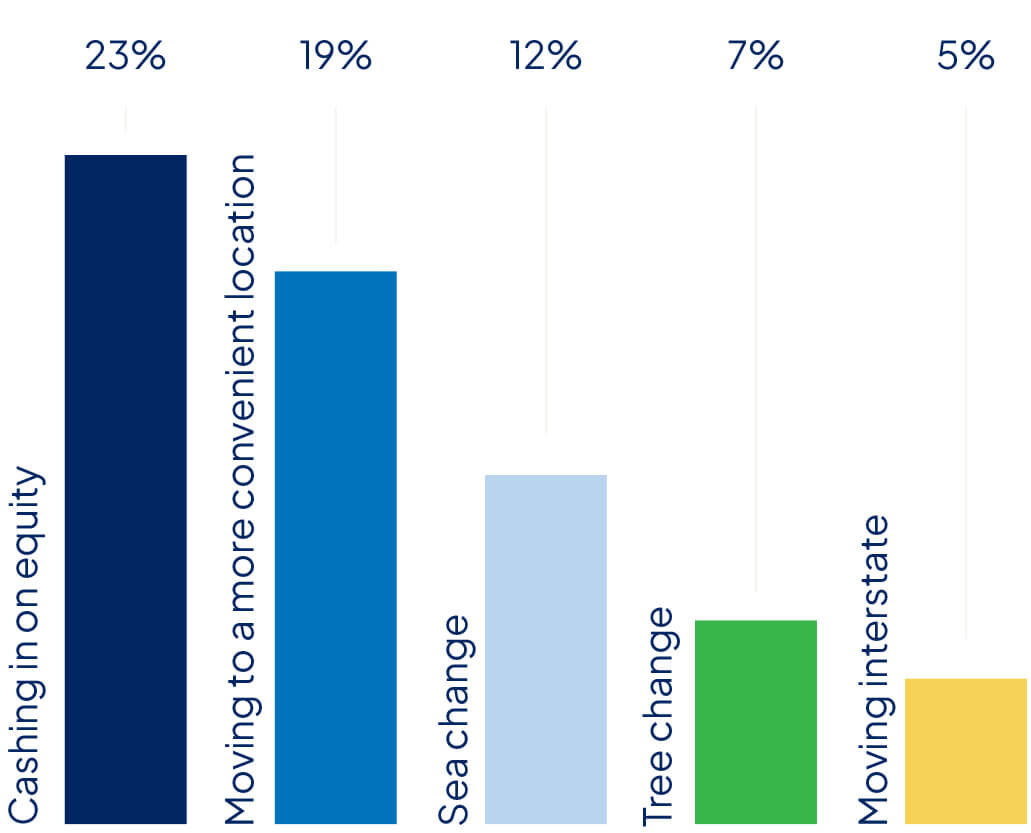
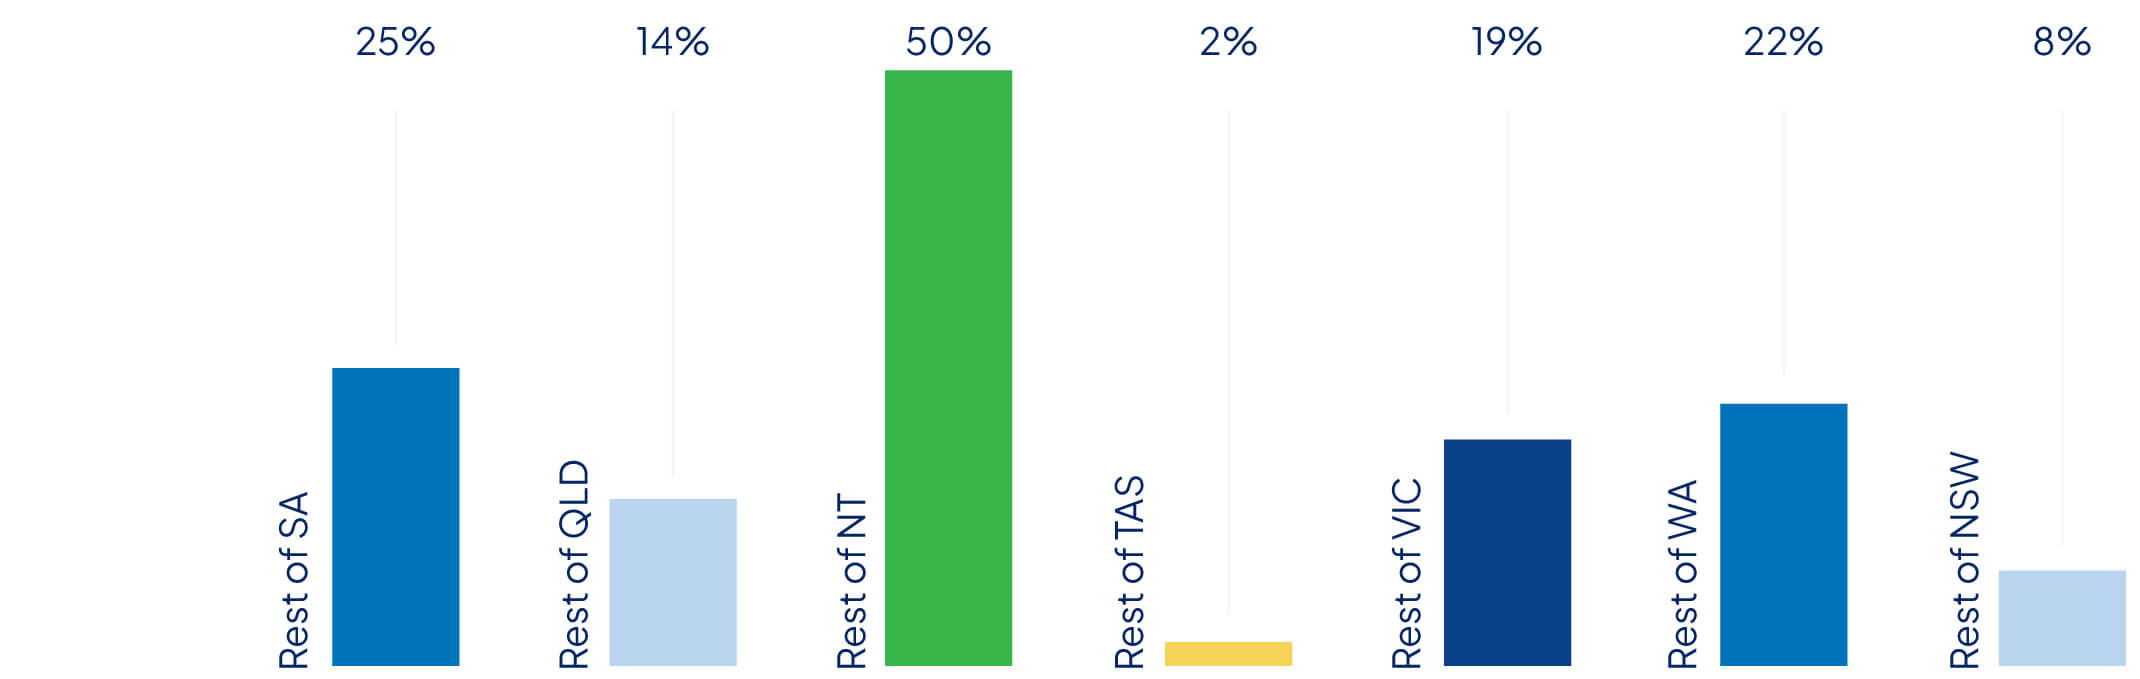
19% of homeowners Compare the Market surveyed said they were looking to sell in the next 12 months. A further 37% will consider selling in the next 2-3 years.
Most of the prospective sellers surveyed wanted to downsize, with 29% stating they wanted a smaller and more manageable property, and 19% reporting they no longer needed space because the children had cleared out.
There are buyers waiting in the wings to swoop on these empty nests. The next largest group of sellers were looking to up-size with 20% having outgrown their current space and 27% looking for a bigger and more desirable property.
Around 15% of sellers say the Reserve Bank’s rate cuts had given them the confidence needed to make their move. Around a third of prospective sellers (34%) say they are waiting for more rate cuts before cementing their decision.
While rate cuts have reinforced some decisions, they have also raised some concerns. Around 68% of sellers said they were nervous about finding their next property, fearing they may need to spend more or face a higher level of competition.
On the flipside, over a third (34%) said they were worried about selling before the market peaked and 30% were concerned their property may be undervalued.
“You may find your borrowing power has increased since the last time you checked but remember – just because you can, doesn’t mean you should borrow more money. Stress test your mortgage to make sure you won’t be too uncomfortable meeting those repayments.”
– Andrew Winter
While lower interest rates have made repayments more affordable, higher property values remain a significant hurdle for many aspiring buyers.
Compare the Market uses Cotality’s median property data to track affordability across 2,168 capital city suburbs by measuring average salaries against typical repayments. We applied the general rule that no more than 30% of the household income should be put towards repayments in order to live comfortably.
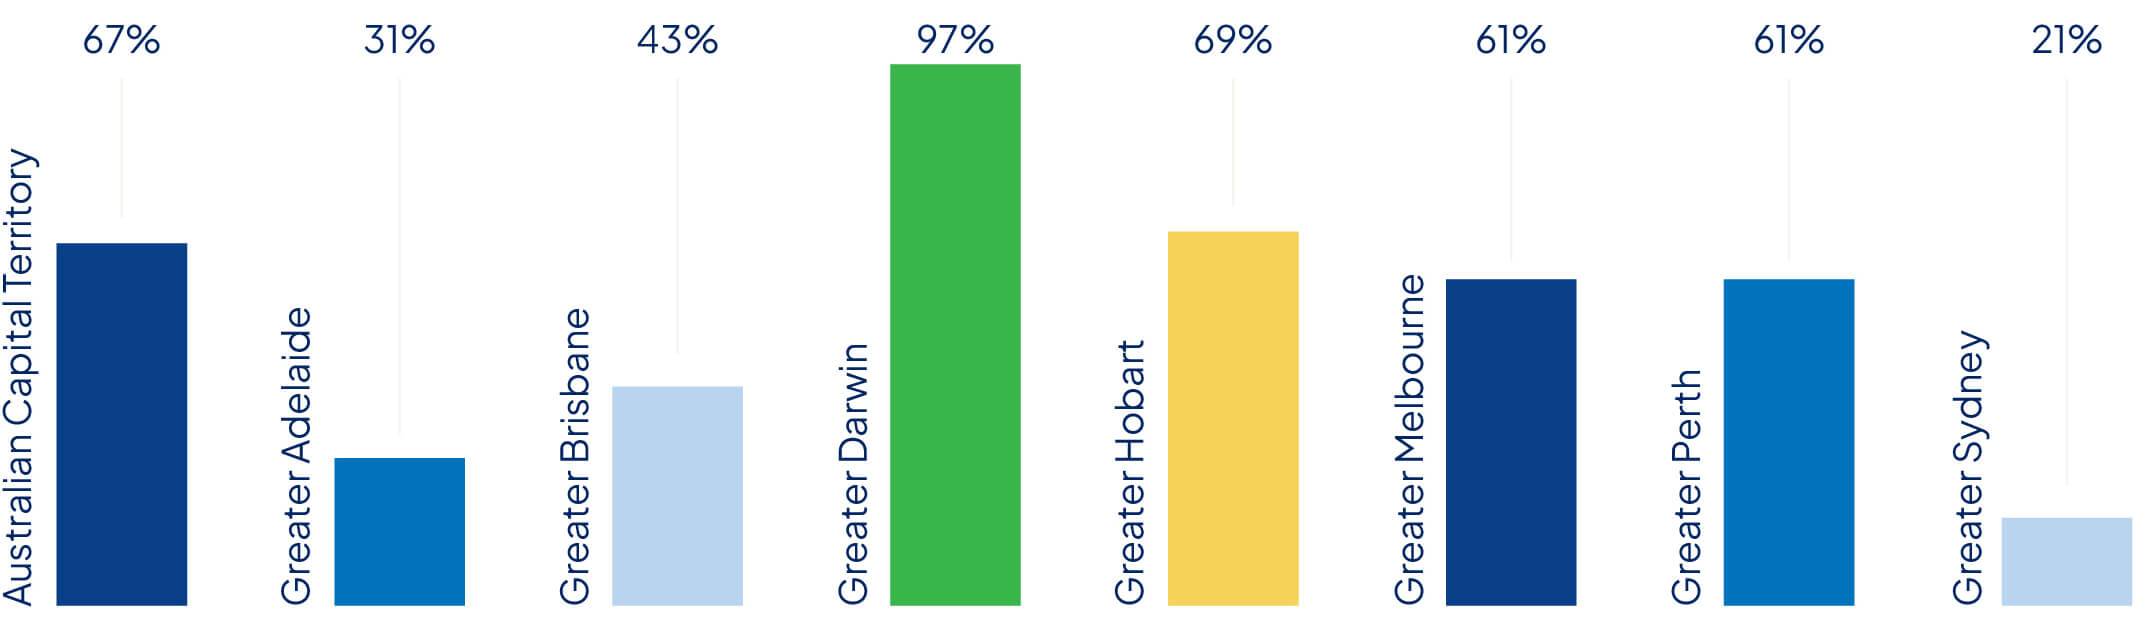
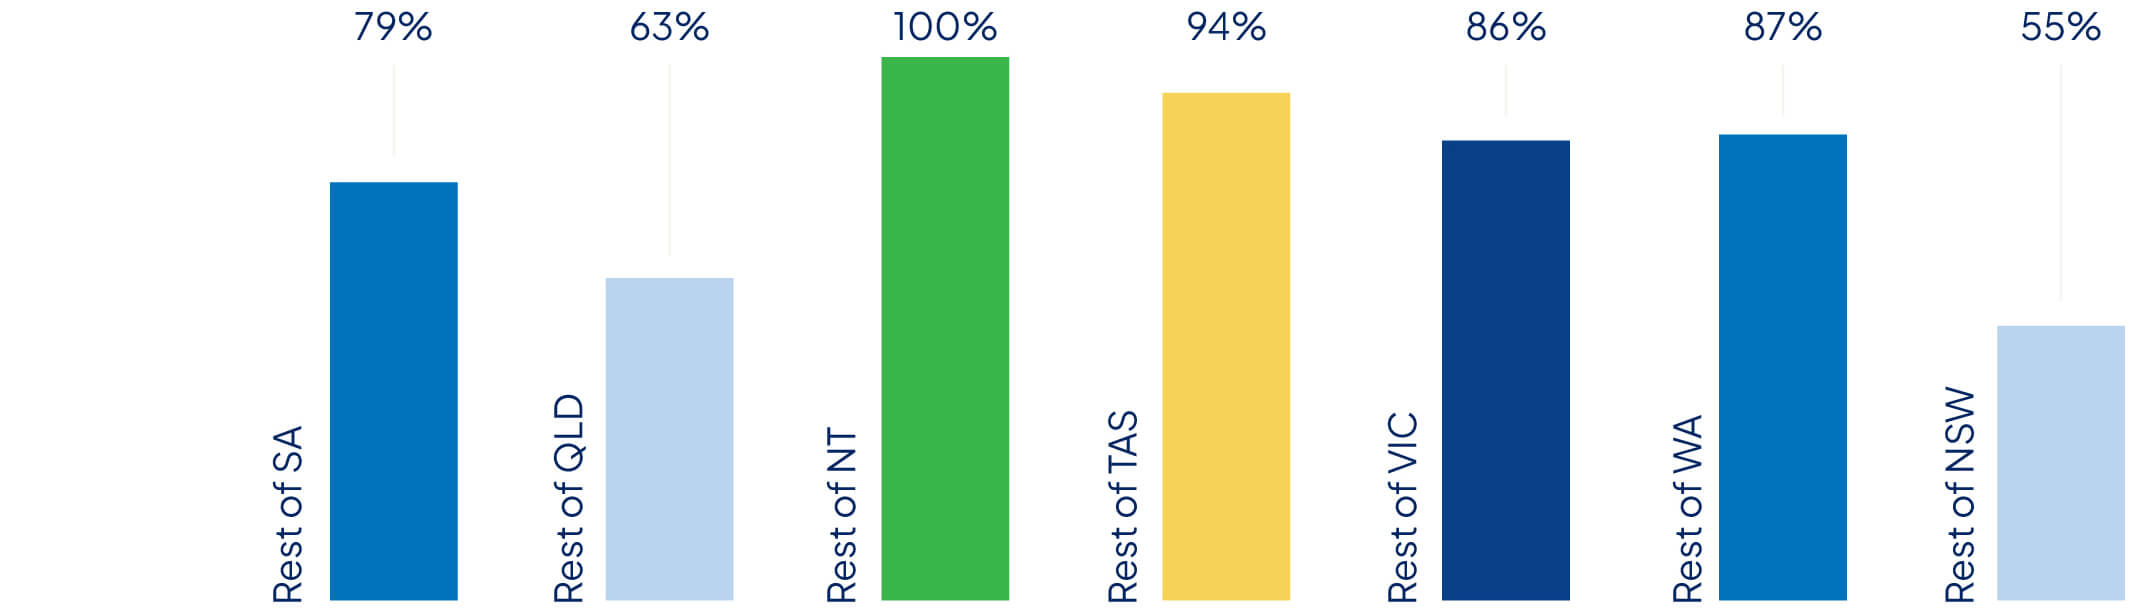
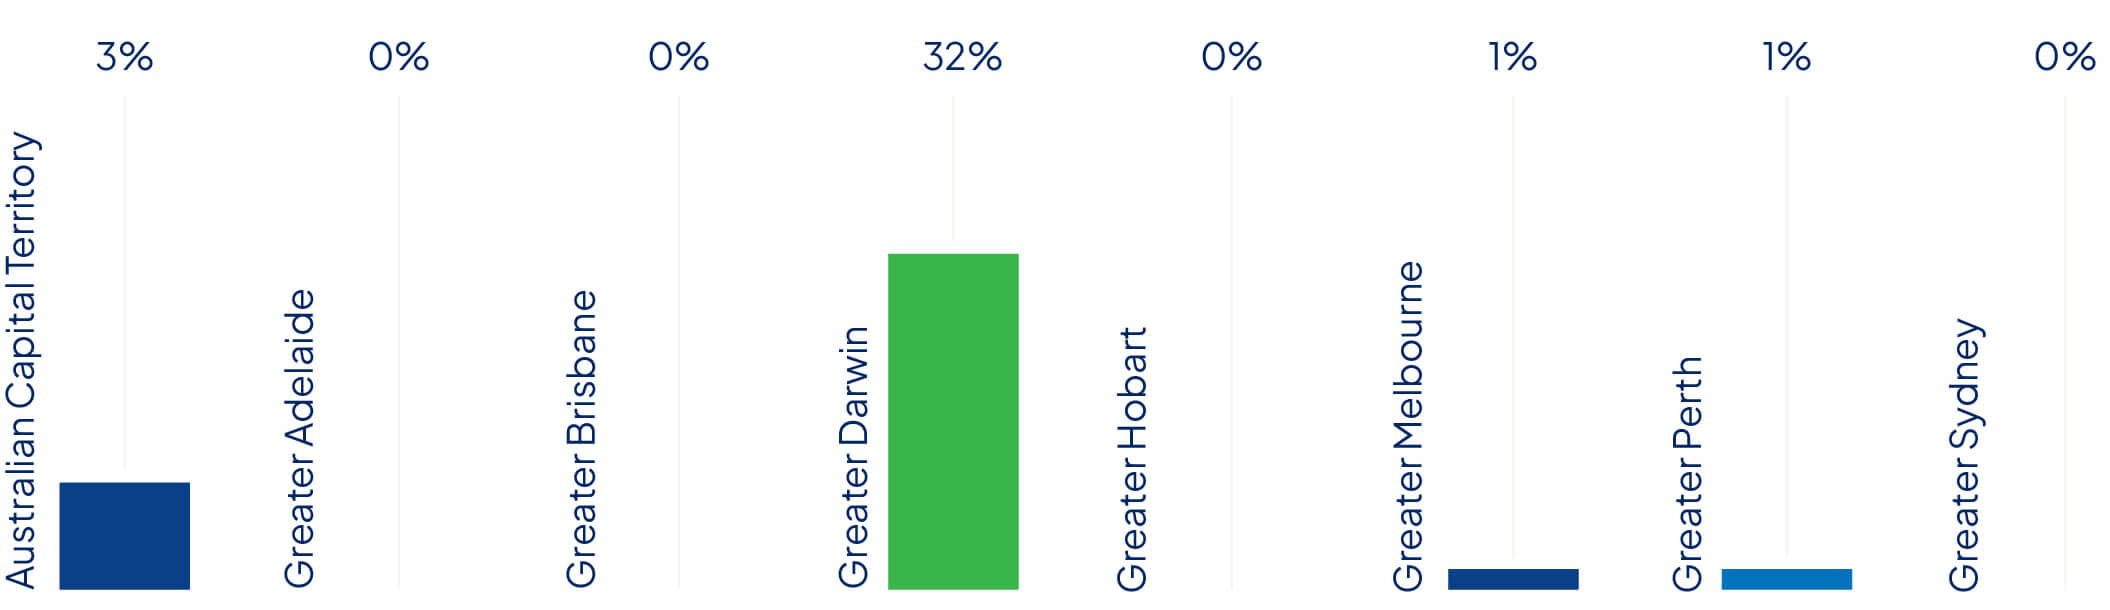
Despite several rate cuts since February, single people earning average salaries remained priced out of 99% of locations, in September 2025.
Units were an exception in some locations, including Albion, Carlton, and Melton in Melbourne, and Orelia and Swan View in Perth. There were also opportunities for singles outside the greater metropolitan areas.
Couples continue to enjoy more opportunities. Two average wages could unlock up to 44% of suburbs in the greater city regions: 247 suburbs in Melbourne, 184 in Perth, 152 in Brisbane, 135 in Sydney, 92 in Adelaide, 66 in the Australian Capital Territory, 34 in Hobart, and all but one suburb assessed in Darwin.
Australia’s housing affordability dilemma is a big messy problem. But put simply, there are more people than there are properties to put them in.
Shortfalls create demand and demand forces prices up. So, an obvious solution is to build more houses. Last year, the government set a target to build 1.2 million new properties by mid-2029, dishing out billions of dollars to state governments to get the ball rolling.
Our cities should be awash with cranes and diggers – a sea of steel, cement and cinder blocks! But progress has been slower than watching paint dry.
Latest building approvals data from the Australian Bureau of statistics does show an 11.9% uplift in seasonally adjusted approvals in June this year, but numbers have been sluggish since the end of the pandemic.
If we want to get serious about building houses, we need to see approval levels that look like the peaks achieved in December 2017 and June 2021.
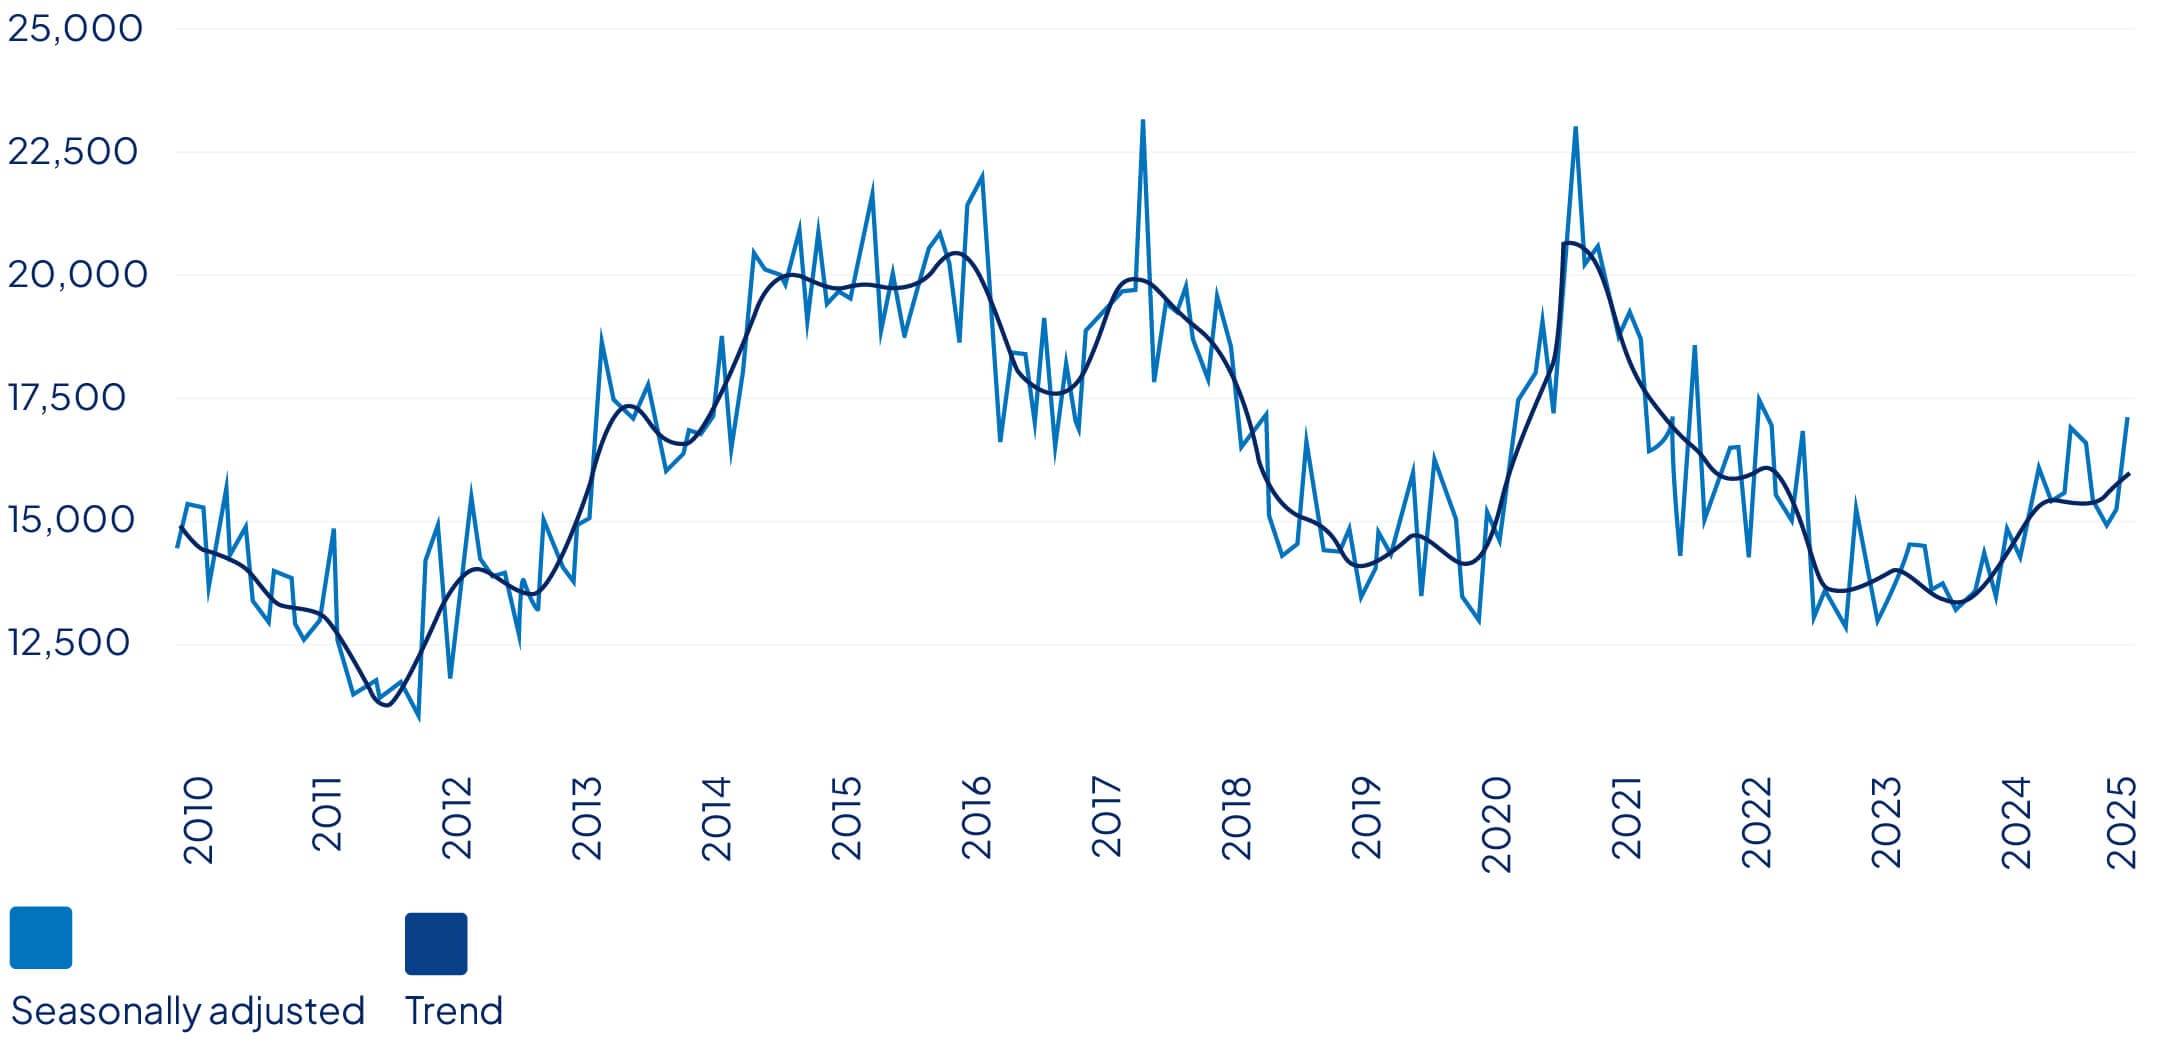
The Compare the Market team crunched the numbers and found that just 171,913 dwellings have been approved since efforts started in July 2024.
Meanwhile, 47,645 building projects commenced in the March quarter of this year. Master Builders Australia estimate that figure should be around 25% higher to meet targets.
If work doesn’t accelerate soon, the government could end up hundreds of thousands of dwellings short of its mid-2029 target.
But the real dilemma isn’t just about adding stock – it’s about adding the right kind of stock. New dwellings at the higher end of the market are springing up across the country, while the low to mid-range developments that most Australians actually need remain in desperately short supply.
The reason comes down to one thing: viability. In most cases, there is little to no profit in building medium-density properties. For many developers, it’s a loss-making exercise. The homes Australians need most are often too expensive to build at a price people can actually pay.
That’s why many in the industry argue we need stronger subsidies and incentives to make these projects financially feasible. Without a shift in economics, the cranes we do see may continue to focus on luxury apartments and prestige builds, leaving the gap in affordable supply unresolved.
If governments can’t support the private sector, they might have to get their hands dirty and take on some projects themselves.
Clearly something has got to happen to get work moving faster on the right projects.
We need to scrutinise our approval processes, to see where red tape may be excessive, and understand what supports builders need to make sure their projects are commercially viable.
Lower interest rates will help keep borrowing costs down, but more can be done to reduce prohibitive financial hurdles like taxes.
Because the lack of affordable housing doesn’t only impact people trying to get into the market – homeowners need confidence too.
Forget upsizing and downsizing – people want to right size their property. But the lack of availability of affordable housing has trapped many people in homes they have outgrown.
Compare the Market surveyed 800 homeowners looking to sell their home in the next three years and found that over half were concerned about finding their next property, due to increased competition or the cost of an upgrade.
We’ve talked targets. We’ve talked timelines. Now we need to see real progress and that means faster approvals to get boots on the ground and cranes in the sky.

Property expert at Compare the Market
Health insurance remains Australia’s forgotten insurance, despite high uptake
More than 15 million Australians now hold some form of health insurance – that’s over half the population. But despite being common, private health cover often remains one of our least understood household expenses. More than a third of Australians surveyed (37.6%) who said they hold some level of private cover have been with the same provider for 10 or more years – potentially missing out on lower premiums and savings with other insurers.
Of Australians surveyed, the rate of long-term loyalty is higher for health insurance than it is for other kinds of insurance including home or contents (25%) and car (20%).
This may reflect some misunderstandings around how private health cover works, including potential concerns about having to re-sit wait periods, or claiming for pre-existing conditions.
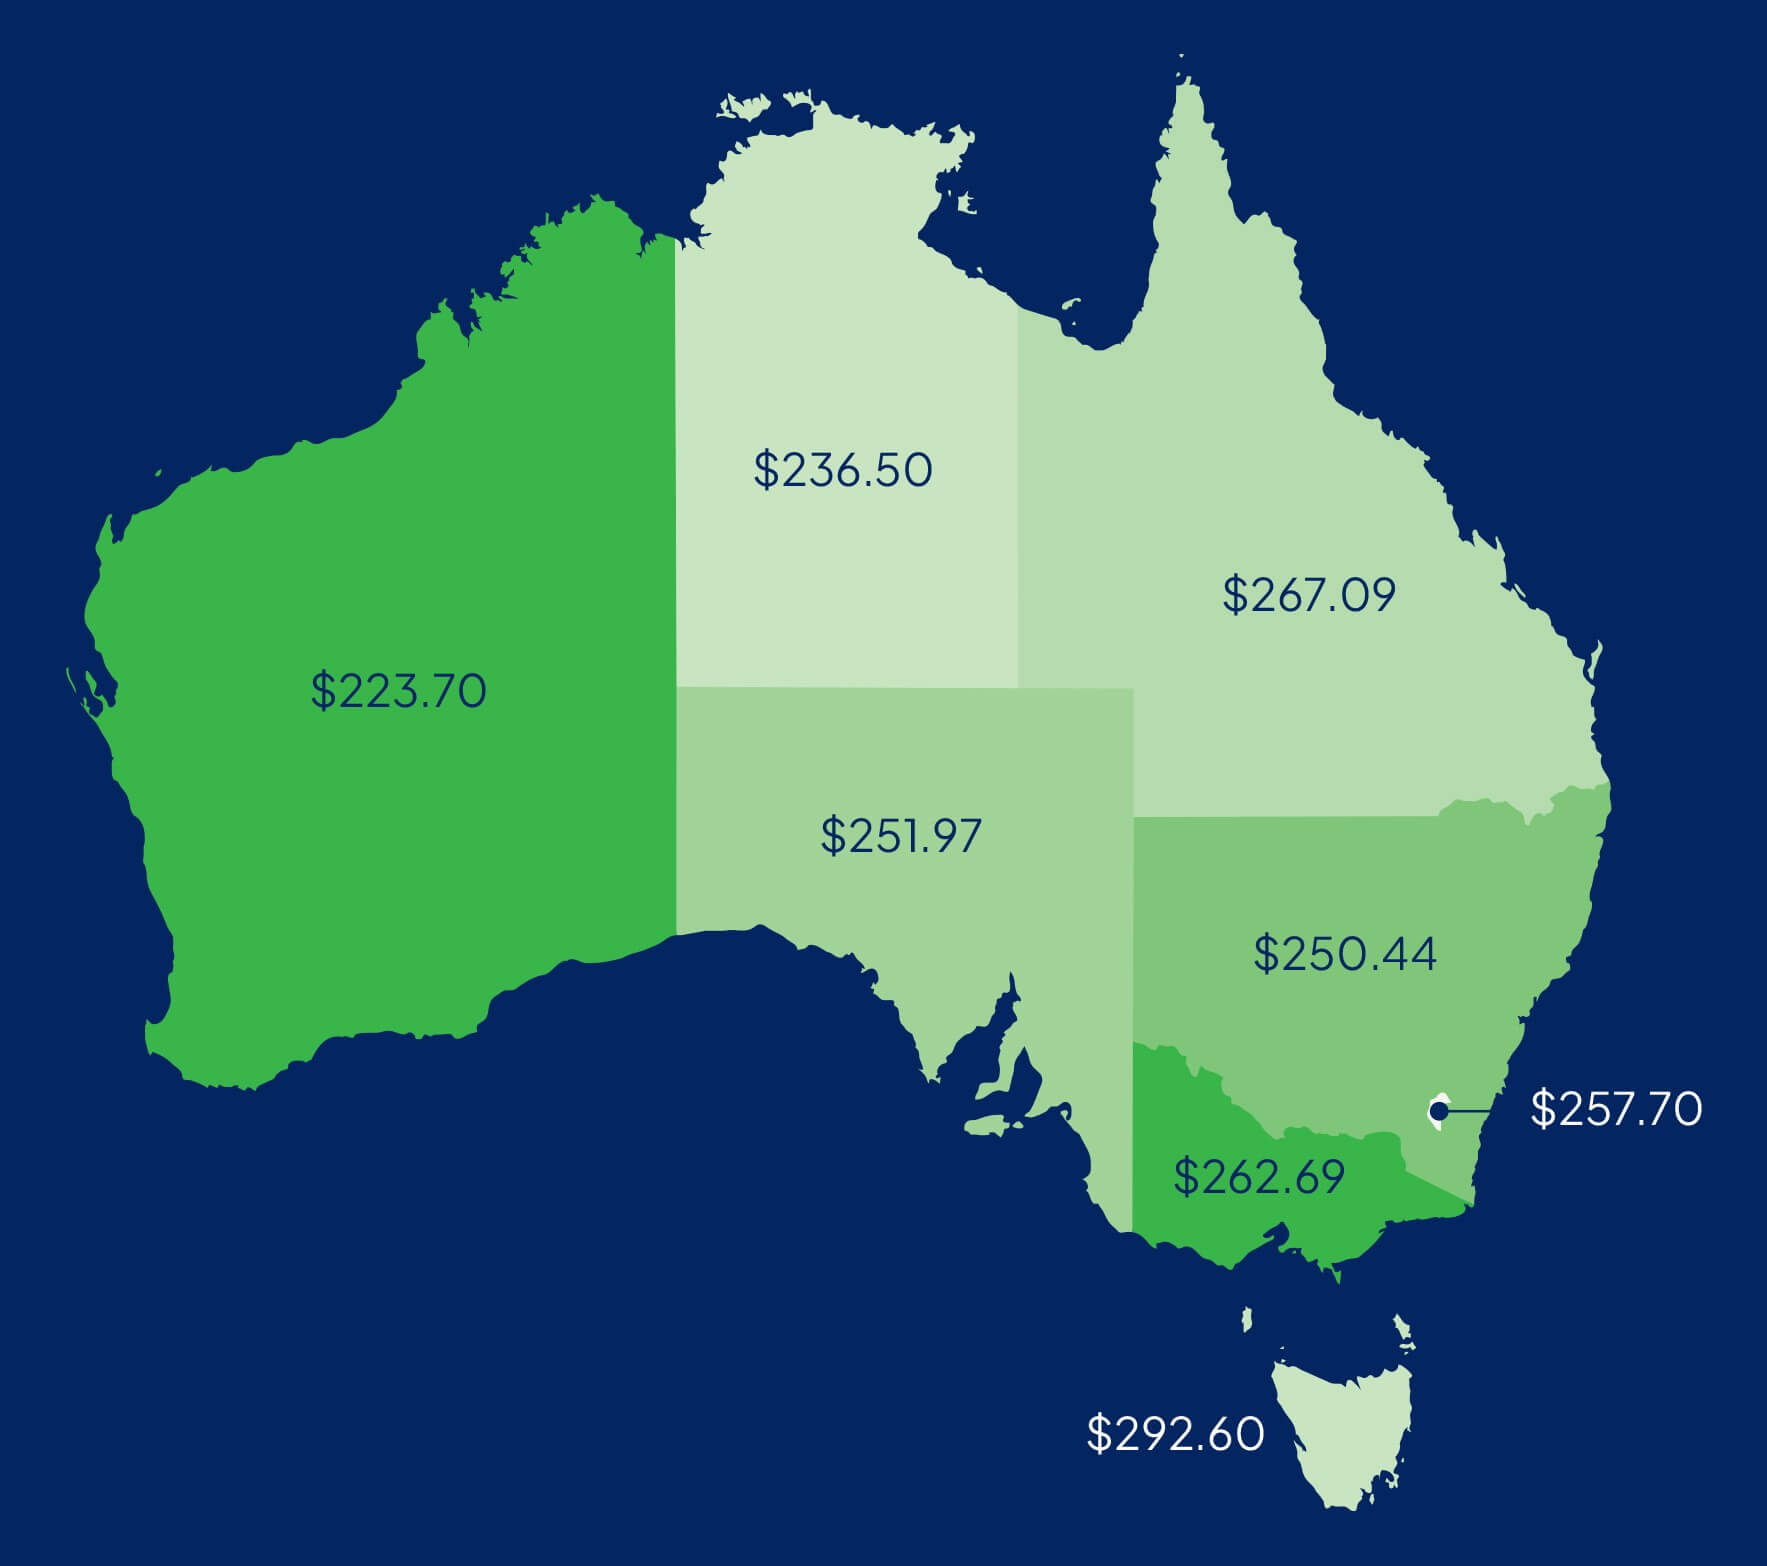
Of those surveyed, on average, Australians spend $255.67 on health insurance each month. This could be a hospital policy, an extras policy or a combined hospital and extras policy. Over a year, the average spend is $3,068.04.
Queensland and Victorian respondents spend more than the national average on health insurance, while South Australian, New South Wales and Western Australian respondents spend slightly below the national average.
A number of factors can influence the amount Australians pay in premiums. These include:
Australians surveyed who have been with the same health insurer for more than 10 years pay an average of $306.88 each month in premiums.
In contrast, respondents who had been with the same provider for just one year paid an average of $237.84 in monthly premiums. Over a year, based on these averages, people who stick with the same insurer for a decade or more would have paid $828.48 more annually (29% more) on premiums than those who had been with the same fund for a year.
The industry average health insurance premium has increased every single year over the past decade, which can potentially add hundreds or even thousands of dollars to some specific policies.
Premiums increase every year due to a range of factors, including:
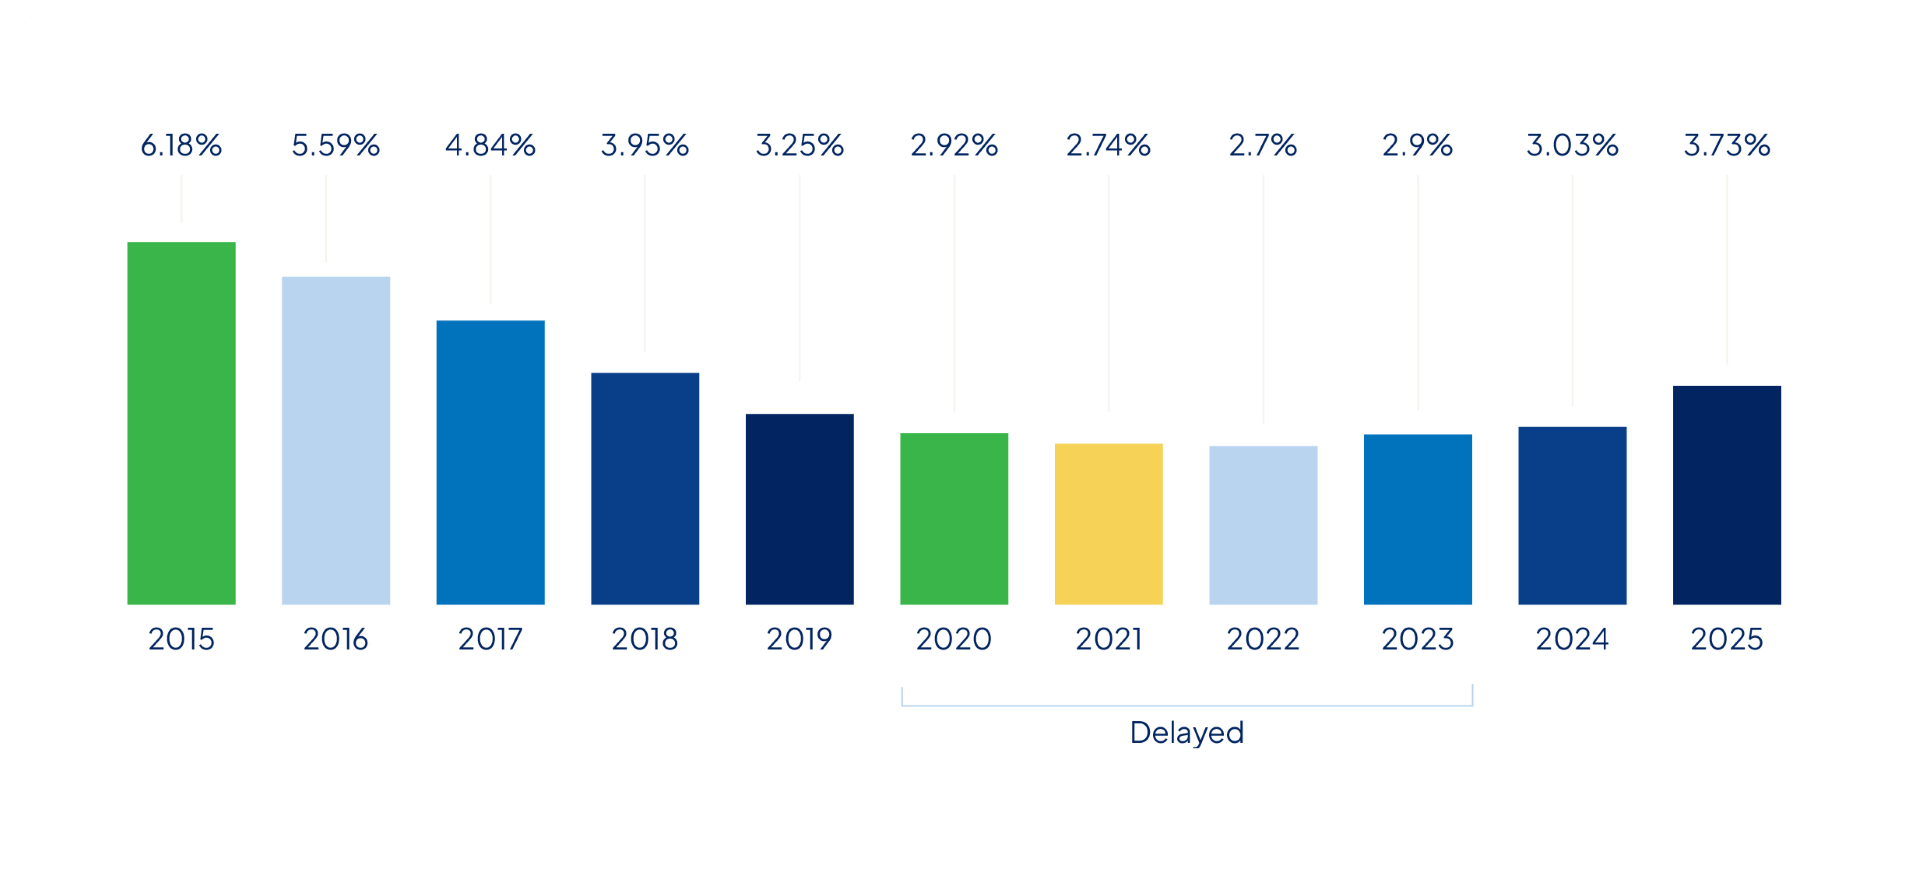
However, premiums for specific policies with different health funds are typically adjusted every year on 1 April, and the difference can be huge. In 2025, one health fund’s average premium increase was as high as 9.56%, while the lowest was just 1.91% on average.
Many Australians still see value in having private health cover. A pulse survey in June found over half (53%) of respondents believe having some form of health insurance was worthwhile. Around 1 in 10 people (12%) said it was worth having to avoid the Medicare Levy Surcharge.
As of August 2025, Australians earning $101,001 or more as a single or $202,001 or more as a family who don’t hold valid hospital cover are subject to pay an additional tax between 1% and 1.5%, depending on their income. The Medicare Levy Surcharge is intended to encourage Australians to take out hospital cover and is applied each day in a financial year you don’t have hospital cover.
In the June quarter, insurers paid out over $4.981 billion in hospital benefits and over $1.709 billion in extras benefits.
According to CoreData, around $4.9 trillion could be passed on from Baby Boomers to their children, grandchildren and charities by 2034.
Yet almost a quarter (24%) of respondents to our survey aged 59-plus had not done any inheritance planning. More than half (54%) of Gen Xers aged 43 to 58 admitted they had not considered passing on an inheritance.
It suggests that many Australians hold off writing a will until they are entering their retirement.
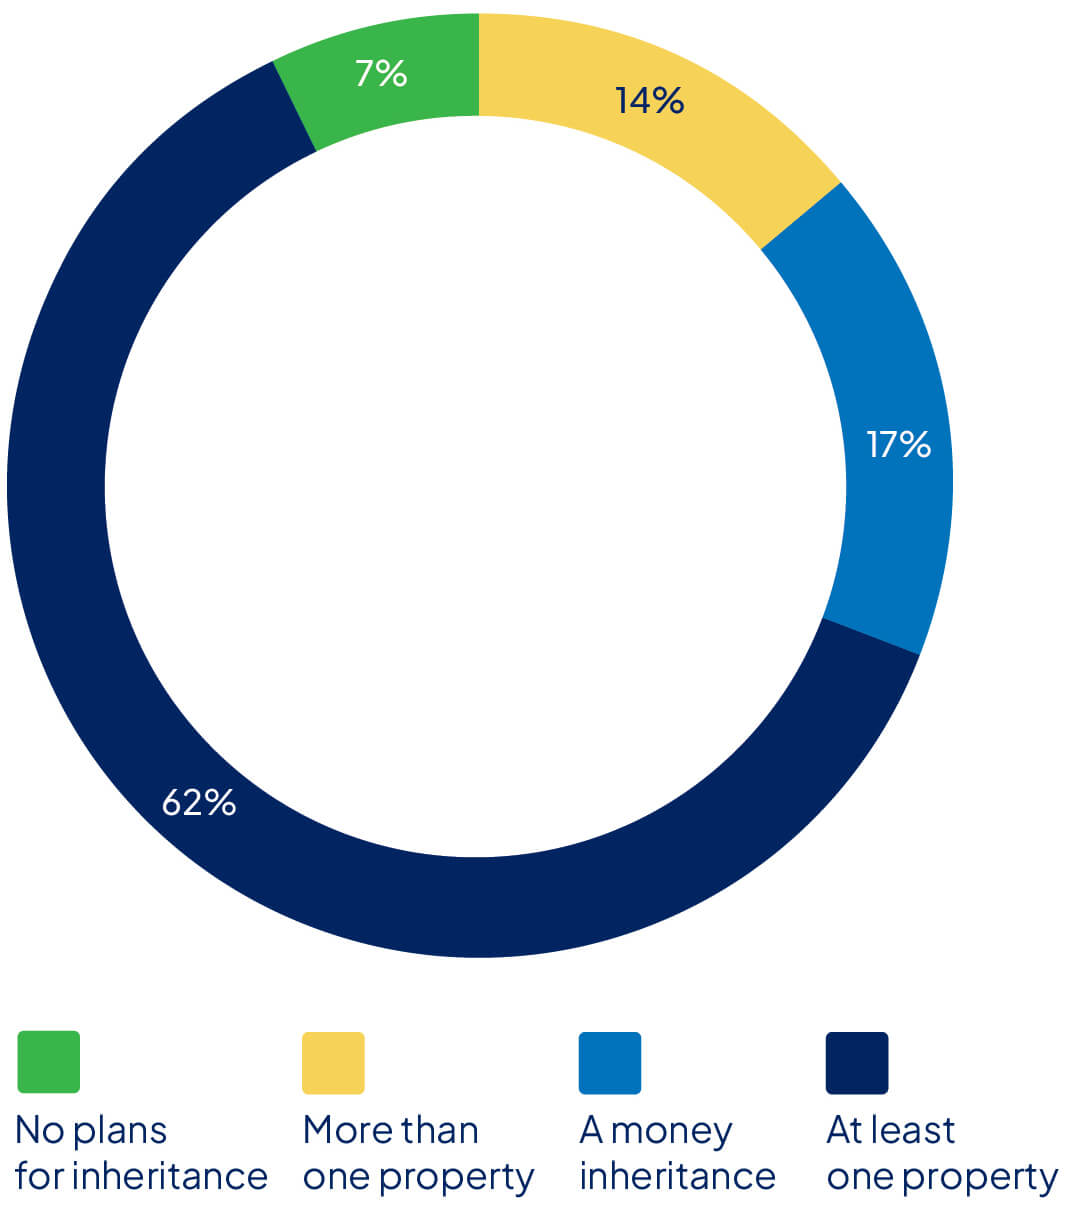
Of the survey respondents who said they had children, and had mapped out an inheritance plan, the majority planned to pass on at least one property (62%) with a further 14% stating they would gift more than one home to their offspring.
Almost one-in-five (17%) intend to pass on inheritance money to their offspring, with a median amount of $250,000.
A minority (7%) said that they did not plan to pass anything on to their children.
“As some lucky young Australians benefit from the passing intergenerational wealth, we are seeing the gap widen between the haves and have nots.”
– David Koch
Intergenerational help has gone beyond money alone in 2025.
Around 93% of Australian parents and grandparents say they have supported their adult children in some way – a 20% increase from last year. From cooking meals, purchasing clothes, toys and essentials, and providing free childcare, aging parents are pitching in.
Education is crucial for improving financial literacy and building more resilient household budgets.
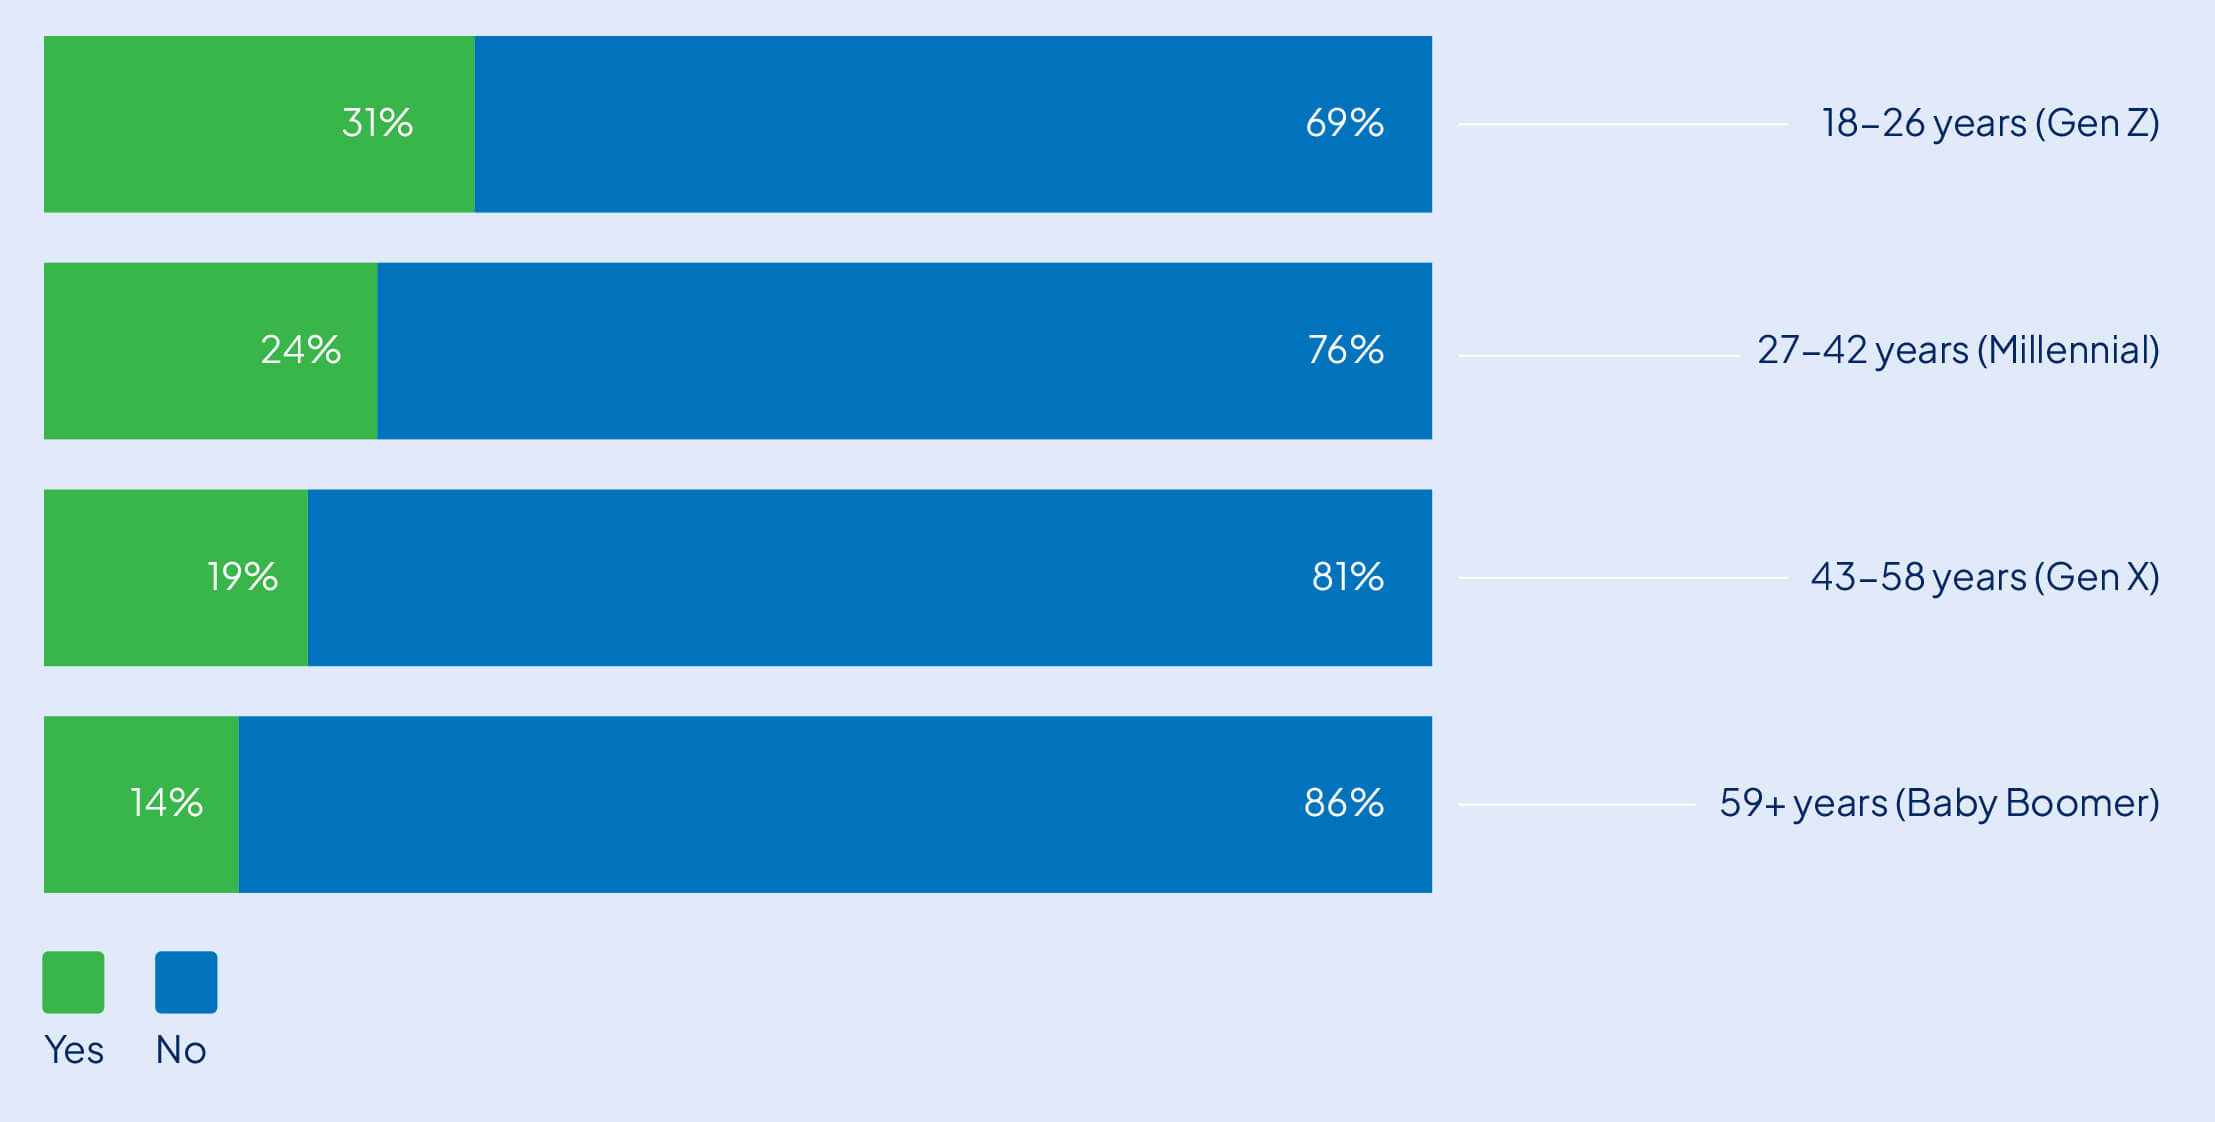
Yet the majority of graduates – almost 80% – say they did not receive a financial education at school.
A generational breakdown shows there has been some improvement, but there’s still a long way to go. Around 31% of school leavers aged 18 to 26 covered some financial topics, compared to just 14% of Baby Boomers.
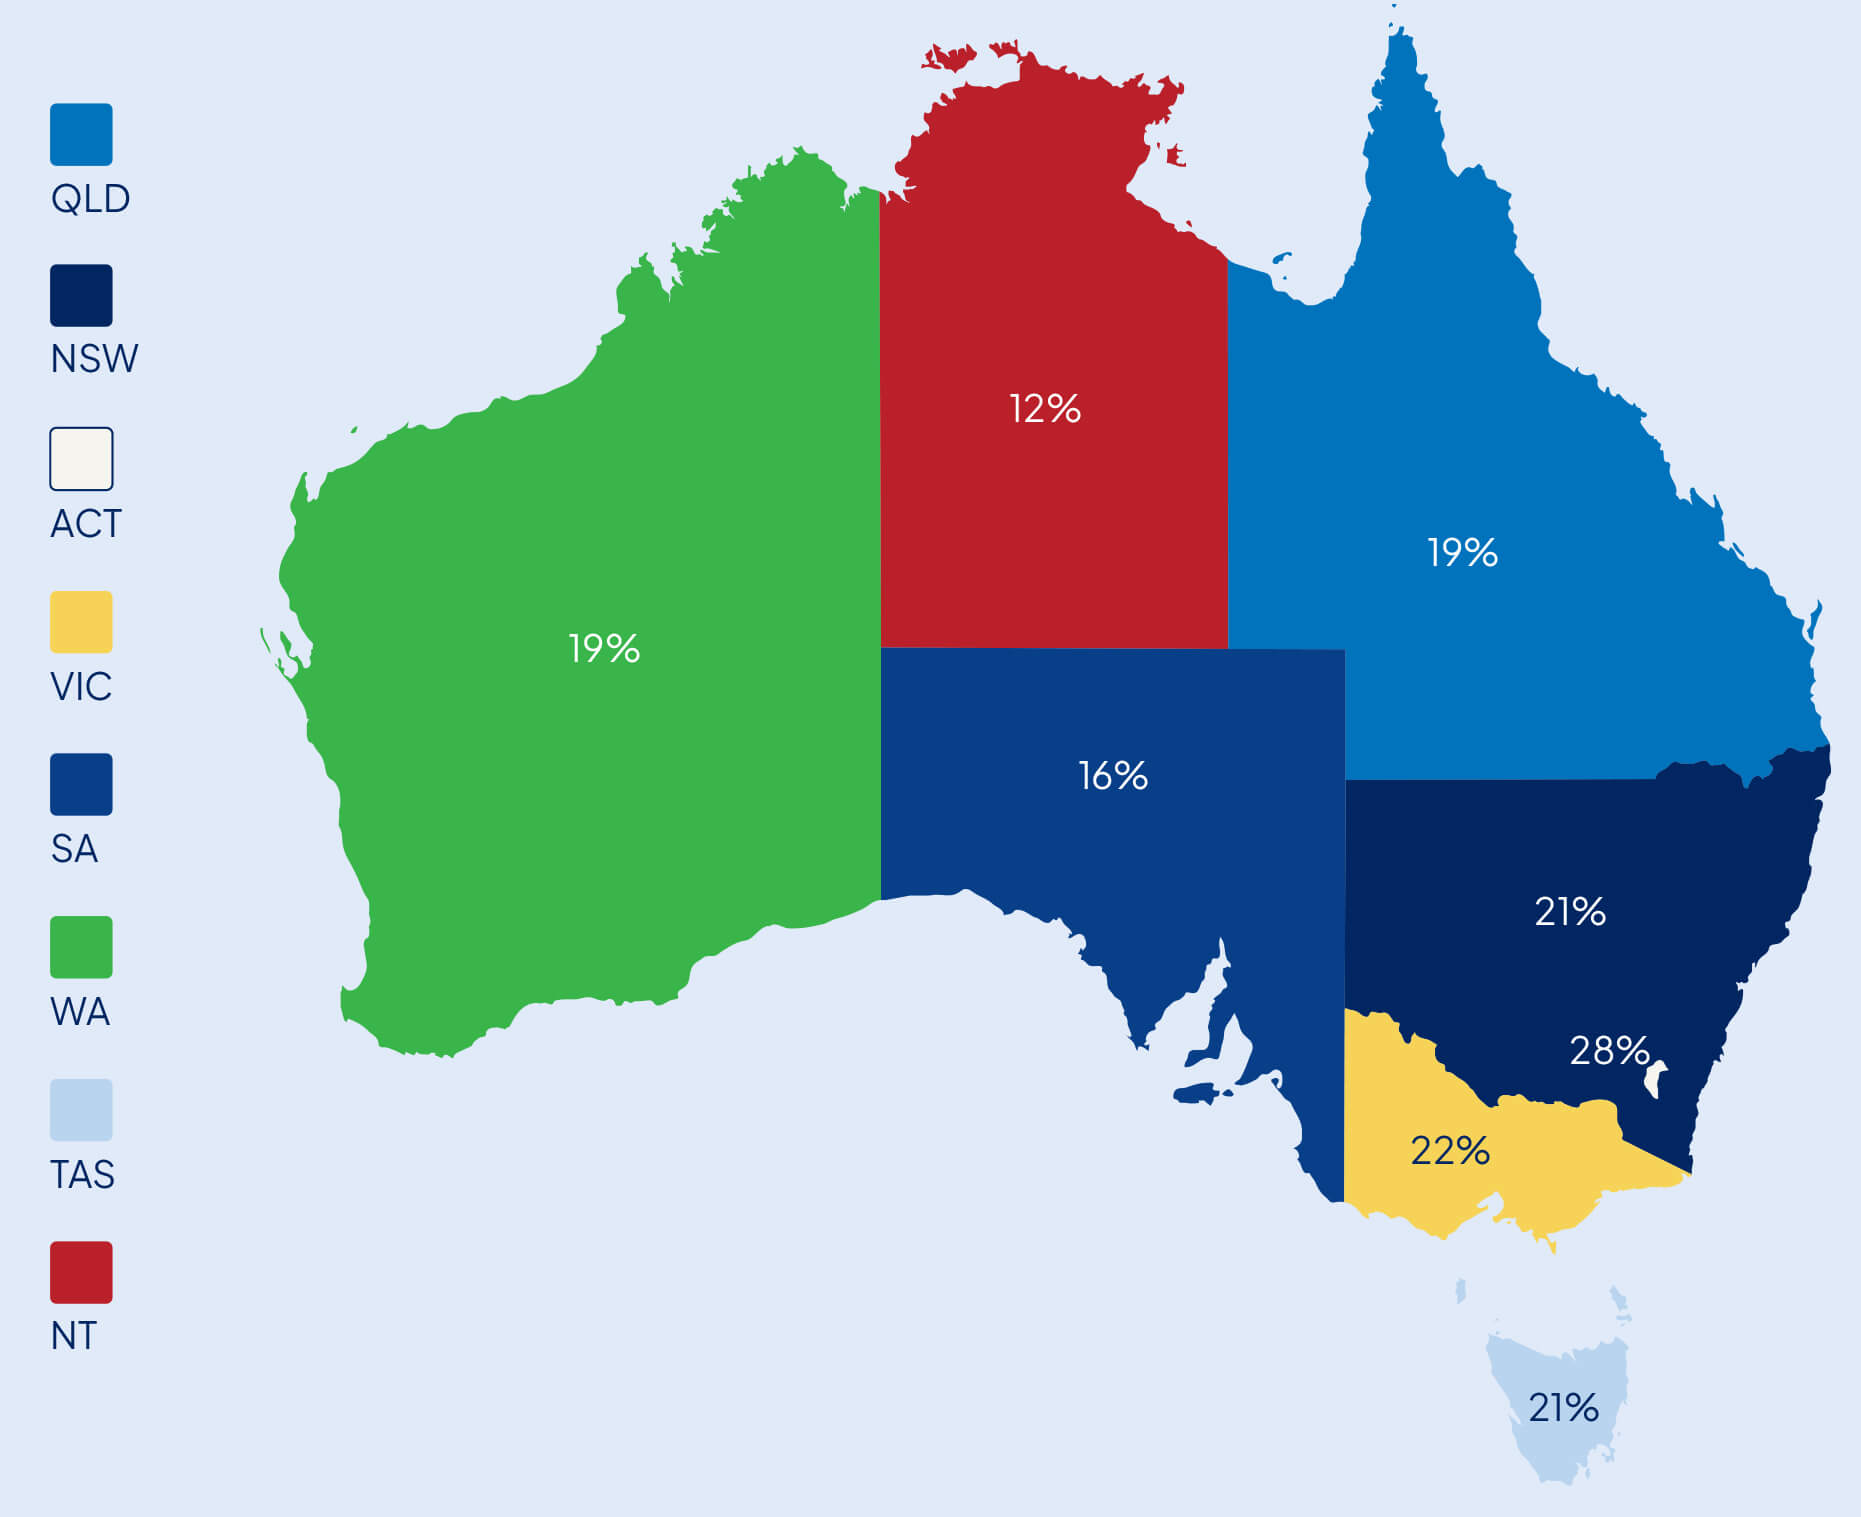
By state, those in Australia’s capital reported being taught more money-related topics, followed by Victoria, and New South Wales across the border.
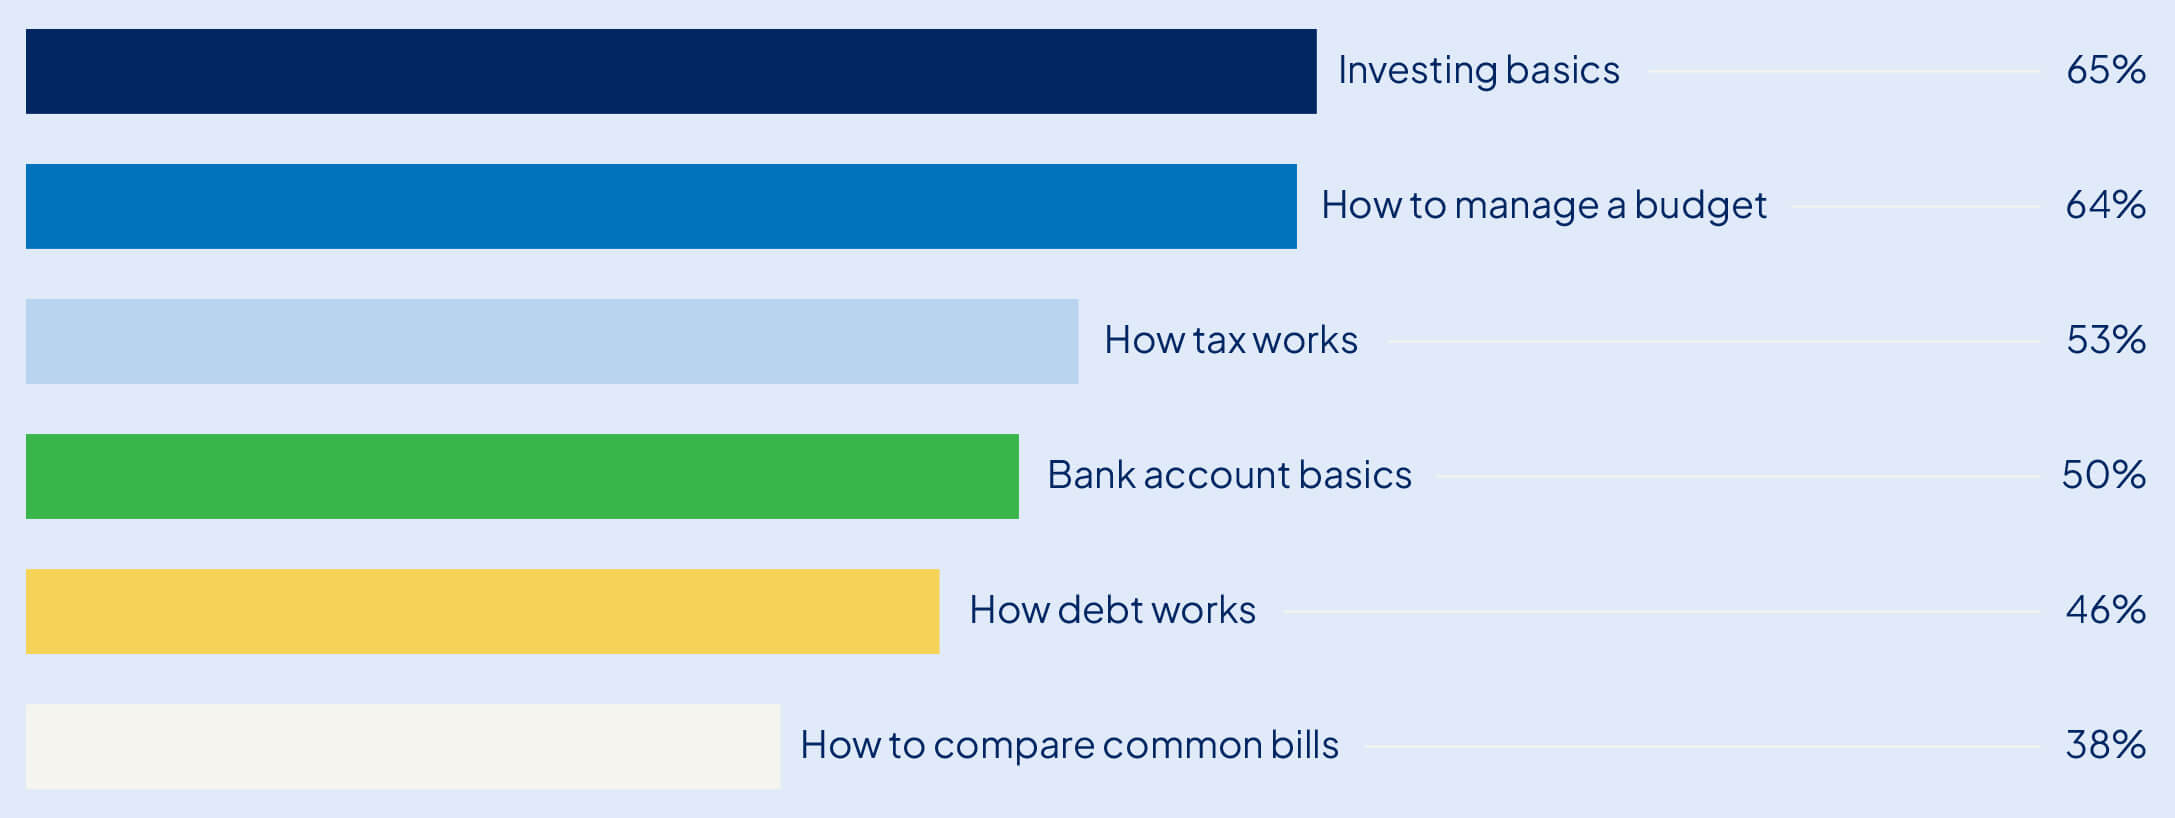
The majority of respondents said managing a budget, investing basics, and tax essentials should be included in school curriculums.
Jane & Vincenzo could pay less
The Melbourne couple could reduce their annual household bills by about $9,737 by shopping around.
By refinancing to a more competitive home loan, they could reduce their repayments by around $7,200 in a year. Also, “sizing” their private health insurance to a more appropriate silver plus with starter extras could cut their policy bill by $1,068 annually.
“Even grabbing a $5 coffee and a $10 breakfast at the local cafe feels like a luxury now. I’m worried that as costs rise, these little joys that make Australia “home” will become unaffordable.”
“Healthcare costs are also a worry. I have several ongoing, chronic conditions and worry about how I will afford treatments in a timely manner if I fall ill or get injured.”
“Inflation in gas and electricity have thrown the bills through the roof and it’s very uncomfortable trying to pay these bills as they’re becoming $150-$200 more every quarter.”
“Even the middle-class households are struggling. I’m worried that despite holding a professional job and tertiary education I’ll never own a home or go on a holiday overseas.”
“My children are about to start high school. We have well-paying jobs and a very low mortgage, but it will be hard to cover the cost of private tuition.”
“We are skipping on a lot of things that used to be normal. We rarely go out with friends or for dinners out… We don’t do fun things like we used to.”
“My biggest concern is that the prices will not go down. This is the norm now and it’s a struggle… I’m worried I will not be able to cope.”
“We have put off birthday presents.”
“It’s crippled our savings.”
“We can’t afford to heat the house.”
“The cost of living is making life less enjoyable.”
“Electricity and gas prices have gone up significantly… We only use heating when we really need to. I do plan on doing a comparison to see if I can get better prices.”
“House prices are insane. When will we ever be able to afford to buy? Where will we live when we retire and can’t afford to pay rent anymore? Will we be homeless? Will we still be working in our 80s, if we can find jobs?”
“I have not been able to go interstate to see my daughter and my new grandson because I am spending more on rent and living expenses.”
“Even filling the car’s tank for weekend trips to the beach hurts – petrol’s a killer.”
“The pension doesn’t seem to be keeping up with higher prices, especially rent.”
“I sometimes skip meals or have snacks for meals instead.”
“Rising costs hit hard at the shops… my weekly shop now costs $30 more.”
“I want them to address the cost of food. Everyone should be able to eat in Australia, and farmers need more support to provide fresh produce.”
“We have made a budget and decided to save one partner’s income completely and live off of the others.”
“I am very conscious of wasteful spending and actively search for discounts on goods, and better rates for things like power.”
“We have tracked down where our money goes and follow the ‘pay yourself first’ ideology.”
“I spend more time comparing prices and look out for deals and discounts.”
“I have had to put off my car service for 6 months… I limit my car trips to save petrol costs.”
“Trying to make food go further, have a vegetable garden, drive less, cut back where I can.”
Time to change our fortunes

The findings in this report only reinforces what I hear every day — Australians are doing it tough. We’re supposed to be the lucky country, but right now, not many of us feel that way.
It seems like this cost-of-living crisis knows no end. It’s no surprise that nearly half of the Australians that we spoke to said that their finances have worsened in the past year, and just as many feel pessimistic about the future of our economy.
That’s why being part of this business feels more important than ever. We’re all about saving people money. It makes coming to work genuinely rewarding. We do this because we love helping people — and right now, people need help.
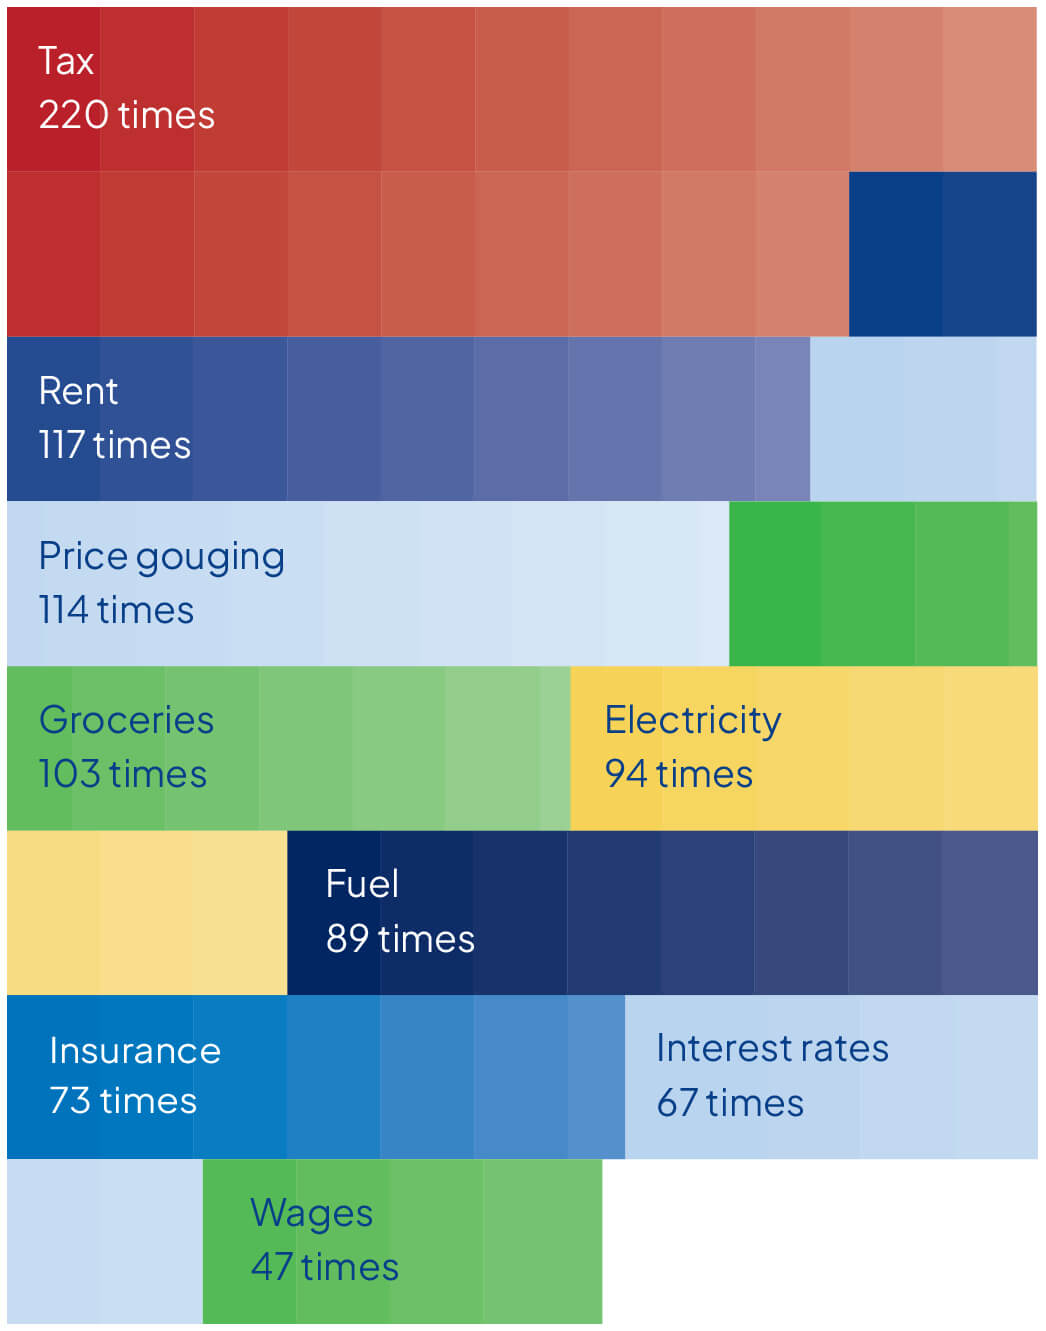
We asked everyday Australians what they want from their leaders. The most common answer? Tax reform. Our system leans heavily on income tax. People want fairness — whether it’s rethinking negative gearing or ensuring our nest egg is looked after.
Another recurring theme was price gouging. When some companies post record profits while everyday bills skyrocket, it’s hard to feel like the system is working for the average household.
At Compare the Market, we see this firsthand. Our general insurance tracker again found price differences of hundreds — sometimes thousands — between quotes for the same house or car. Without transparency, families are left in the dark.
That’s why we’re proud to offer free tools that help Australians compare and save. But there’s more to do. Consumers have power too. If your renewal comes in high, call your insurer. Ask for a better deal. If they won’t budge, walk away.
After years of financial strain, Australians deserve better. The next five years must be about connection, not division. Our government are our custodians — and in tough times, we need leadership that brings us together.
So how do we bounce out of this financial rut? Where will we be in 12 months’ time? The wheels are in motion — but are they just spinning?
Let’s focus on what matters: fairness, transparency, and reform. That’s how we help households breathe easier — and how we change our fortunes for good.

What’s one thing you’d like to see policy makers change to address the cost of living?
“Greater regulation of price hikes in the home insurance industry, as the cost of home & contents insurance is becoming increasingly unaffordable and many people are now living in uninsurable properties.”
“Hold supermarkets to account and prevent price gouging. It’s outrageous they boast massive profits while people struggle to put food on the table. It should be cheaper to buy fresh produce so people can cook healthy meals instead of buying fast food.”
“One key thing I’d like policymakers to address is strengthening and expanding targeted support for lower and middle-income households to offset the rising costs of essentials like food, housing, and utilities.”
“Bring down energy costs. This should make our bills cheaper, with the flow on effect that manufacturing costs and food production will also become cheaper and hopefully the savings will be passed onto the consumer.”
“I’d like to see policymakers address the rising cost of housing. Making rent and homeownership more affordable would ease a major financial burden and help stabilise the cost of other essentials too.”
“Force big companies to stop increasing prices so the average person can afford basics like food, rent, health services and keep the kids in school.”
“I’d like to see wages and salary keep up with the rising cost of things like food, rent, and bills.”
“Find a way to ensure that insurance companies premiums are fair and not only there to strongly improve the profit of insurance companies.”
When every dollar counts, it pays to compare.
We believe the best decisions start with a comparison. That’s why our team has spent over a decade helping millions of Aussies compare prices and search for a better deal.
We strive to empower our customers to make better choices, saving them time, money and stress.
What started in 2012 as a handful of people passionate about building a helpful comparison service has grown into a proud group of over 600 employees based in Brisbane.
Comparing through us will always be free of charge and we don’t play favourites with the brands we compare.
Next time you receive a renewal notice, look and see if you could save.
Betsy and Brett saved more than $3,000 a year by switching their car and home & contents insurance policies with Compare the Market.
Sandra from NSW reduced her annual premium by $628 by moving to a health insurance policy better suited to her current needs.
Compare the Market commissioned PureProfile to survey a nationally representative sample of 3,006 Australians in August 2025.
Car insurance quote index
Average indicative quote prices were based on comprehensive car insurance quotes available through Compare the Market and also from three popular industry brands not available through Compare the Market. Quotes for a white 4-door 2020 Toyota Corolla sedan (no modifications) driven by a hypothetical 30-year-old male who is employed full time, obtained their licence at age 17 and has no previous claims. The car is used primarily for private or commuting purposes and is driven 12,000kms per year and is parked overnight in the following suburbs which were selected as approximately 15km north, south, east and west of the nearby city centre:
Only policies with an excess of $1000, or as close to this figure as was possible with the relevant insurers, were used to calculate averages for these different locations. Every three months or as close as possible from a start date of 30/08/2024 – 01/09/2024. Your quotes will vary depending on your unique circumstances.
Home and contents insurance quote index
Average indicative quote prices were based on home and contents insurance quotes available through Compare the Market and also from three popular industry brands not available through Compare the Market. Quotes for a typical low-set, 4 bedroom 2 bathroom, 2 undercover carparks, freestanding brick veneer home with tiled roof, insured for $700,000 with $80,000 in contents with a target excess of $1000 for both home and contents. Where these sum insured values or target excess were not available we used the closest possible option with the relevant insurer. Our hypothetical home owner was a 30-year-old male who lives alone with no previous claims. The following suburbs which were selected as approximately 15km north, south, east and west of the nearby city centre:
Only policies with an excess of $1000, or as close to this figure as was possible with the relevant insurers, were used to calculate averages for these different locations. Quotes collected Every three months or as close as possible from a start date of 30/08/2024 – 01/09/2024. Your quotes will vary depending on your unique circumstances.
Additional notes
Our standardised hypothetical house parameters were applied to each address, regardless of the actual property at that location. This allowed for an accurate comparison across multiple locations.
It is important to keep in mind that these prices reflect a diverse range of prices, with a difference of hundreds of dollars between the cheapest and most expensive policy. These averages could be markedly different to how much it costs to insure your own car or home and contents, and you should exercise caution in applying these averages to your car or home before purchasing an insurance policy.
This insurance index is designed to provide an overview of insurance prices across various Australian cities and insurers. Please be aware of the following:
Ownership Cost Comparison
Purchase price
New vehicle drive-away figures are accurate as at 7 April 2025, according to each manufacturer’s website, and are subject to change.
Car loan
Average annual car loan repayments were calculated using the Australian Government’s Moneysmart calculator, according to advertised fixed interest rates from five financial lenders as at 6 May 2025.
Calculations assumed no ongoing fees and repayments do not take into account the reduction of the loan balance over time.
Where an interest rate range was provided, the median or representative rate was used. Some lenders offered discounted rates for hybrid and/or electric vehicles.
The car loan terms were for five years with a $5,000 upfront deposit, paid monthly (where possible), and based on the drive-away price of each vehicle in Queensland as at May 2025.
The three vehicles – petrol internal combustion engine (ICE), hybrid electric vehicle (HEV), and full battery-electric vehicle (BEV) – were selected with a comparable price and equipment level to ensure a fair comparison.
Annual servicing costs
The cost of servicing each model was calculated based on averaging the first five years’ worth of scheduled capped-price services from each car manufacturer, as at May 2025 and are subject to change.
EV charging costs
Electric vehicle charging costs were calculated based on the average home energy plan rate ($0.30 per kWh) on a single-rate tariff in Alderley, Brisbane (4051) as at 11 April 2025.
Running cost calculations were based on the energy consumption claims according to the manufacturer – which will likely vary in real-world driving – and we assumed the vehicle drives 15,000km annually.
Fuel costs
Petrol and hybrid vehicle fuelling costs were calculated based on the average retail cost of unleaded 91 RON petrol ($1.85 per litre) between 8 April 2024 to 7 April 2025 across Australia’s five biggest capital cities.
Running cost calculations were based on the fuel consumption claims according to each manufacturer – which will likely vary in real-world driving – and we assumed each vehicle drives 15,000km annually.
Comprehensive car insurance
Always read the Product Disclosure Statement (PDS) and Target Market Determination (TMD) to check for the inclusions, exclusions and restrictions before purchasing.
Comprehensive car insurance policies were quoted across 14 different comprehensive products across 10 brands and six underwriters for three comparable new vehicles:
Premiums were quoted for participating brands using Compare the Market’s car insurance comparison tool and directly through well-known insurance brand websites on 11 April 2025, with a next-day commencement date.
Quotes were then averaged for each model. Not all insurance policies were available for all vehicles.
The annual comprehensive car insurance policies were based on a targeted $900 excess for a 34-year-old male living in Alderley, Brisbane (4051) with market value coverage. Where an insurer did not offer a $900 excess option, the closest amount within $100 was selected. Where an insurer did not offer the market value option, the default agreed value amount was used.
We assumed the owner drives up to 15,000km per year (for private use and/or commuting to work only) with a clean driving history, parks the vehicle in a garage, does not own a home, does not own another vehicle, and is employed full-time. All three vehicles had a white exterior colour, no pre-existing damage, and no options or modifications.
Registration and Compulsory Third-Party Insurance
The cost of annual registration and compulsory third-party insurance (CTP) in Queensland for a private use vehicle was sourced from the Queensland Department of Transport and Main Roads during the 2024-25 financial year. A cheaper fee applies for full electric vehicles and models with three cylinders or fewer.
Prices were accurate for the 2024-25 financial year and are subject to change.
Average quoted BEV and PHEV insurance premium
Comprehensive car insurance policies were quoted across 11 insurers and six underwriters for 10 popular and notable full battery-electric vehicle (BEV) models, and 10 popular and notable hybrid (HEV) and plug-in hybrid electric vehicle (PHEV) models. Not all insurers and products were available for all vehicles.
The latest-available models and entry-level variants were selected.
Premiums were quoted using Compare the Market’s car insurance comparison tool and other well-known insurance brands, based on a next-day 15 March 2025 commencement date.
Quotes obtained were averaged for each model, and overall for all 10 BEV and all 10 HEV/PHEV models.
The annual comprehensive car insurance policies were based on a targeted $900 excess for a 34-year-old male living in Alderley, Brisbane (4051) with market value coverage. Where an insurer did not offer a $900 excess option, the closest amount within $100 was selected. Where an insurer did not offer the market value option, the default agreed value amount was used.
We assumed the owner drives up to 15,000km per year (for private use and/or commuting to work only) with a clean driving history, parks the vehicle in a garage, does not own a home, does not own another vehicle, and is employed full-time. All three vehicles had a white exterior colour, no pre-existing damage, and no options or modifications.
Percentages were rounded to the nearest whole number.
Percentages were rounded to the nearest whole number.
Additional sources: