The Burrow

Feb 22, 2023
Being an entrepreneur (someone who starts their own business) is an exciting endeavour with its own risks. Some people live for the highs and lows of operating a business, forging success by their own two hands and the support of their team and employees as they chase success, growth and profit. Others may operate for a time and be forced to or choose to withdraw from the game, potentially happy or disappointed in how their business performed.
But where in the world should one start their own entrepreneurial enterprise? Is it even possible to pinpoint a specific nation as a location where business thrives more than anywhere else?
We thought we’d take a look.
As experts in protecting businesses in the form of business insurance for when things go wrong, Compare the Market has crunched the numbers across several data metrics collected by the OECD (organisation for Economic Co-operation and Development) to see which country could be ripe with opportunity for the savvy entrepreneur. These metrics include the number of Small and Medium Enterprises (SMEs) as a percentage of all businesses, the number of active, medium, and high growth enterprises, the number of enterprise bankruptcies, the GDP per hour worked, the national GDP, and the self-employment rate.
All of these metrics can be signs that a country presents good opportunities for entrepreneurs, though there are other factors that can also have an influence on an entrepreneur’s success that aren’t collated in these results table.
Of course, this list is no definitive guarantee that your new business venture will find success if you go to a high-ranking country. That being said, it’s clear some countries are more of a haven for the self-employed entrepreneur than others.
So, who comes out on top?
Starting a business can be a stressful, risky adventure. As an entrepreneur, you want to protect the business that you’re passionate about (and is the source of your income as a self-employed worker). Business insurance can provide peace of mind as it provides a financial safety net for a wide range of events– depending on what policy you get (coverage, exclusions, limits plus terms and conditions vary from policy to policy, so be sure to read your Product Disclosure Statement before you buy). There are different products to suit all kinds of businesses, and some may be a legal requirement depending on the laws in your jurisdiction and the industry you operate in.
As a busy business leader, you understand that time is precious. Comparison sites like Compare the Market can help you save time by collating a wide variety of products together and providing you quotes based on your needs with ease. Comparing insurance also helps you potentially snag a good deal, saving money in the process as well as time.
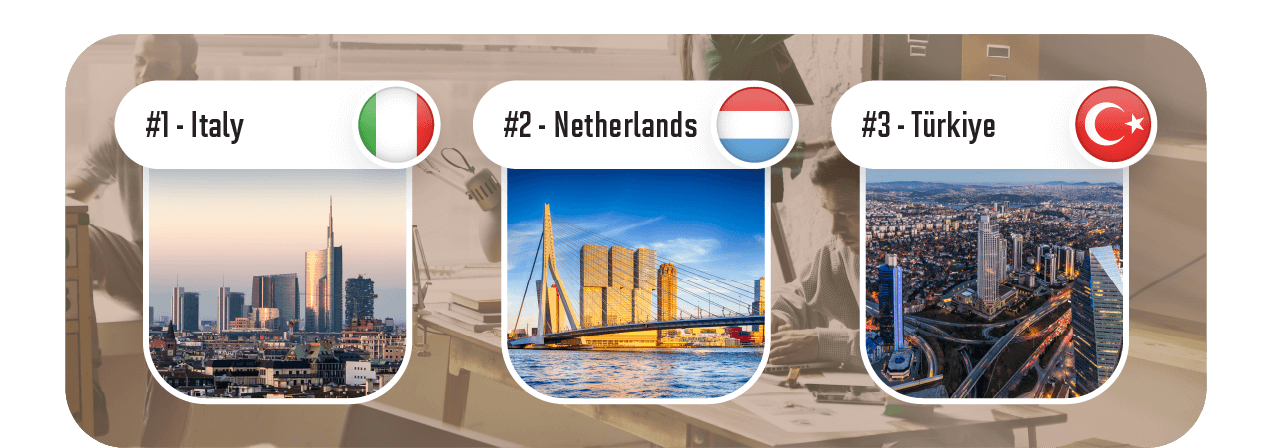
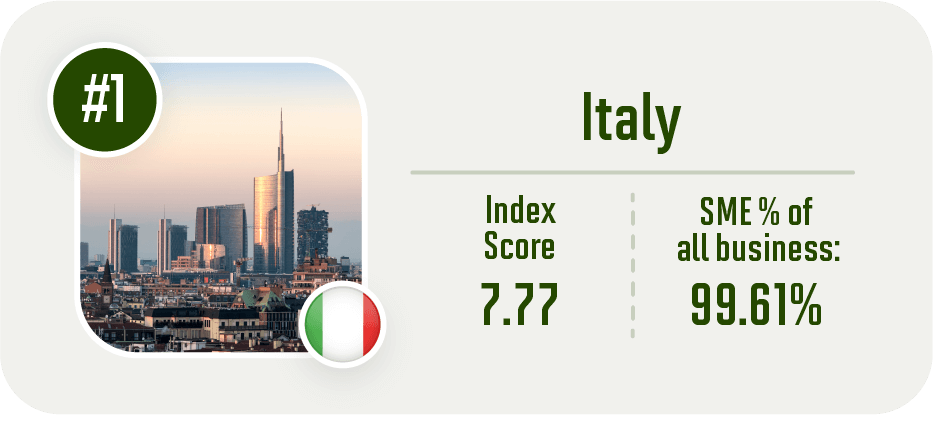
When all 34 countries that we looked at are indexed together, Italy comes out on top. The birthplace of the Roman empire scored well in our index across several different areas. Italy has the third-highest percentage of businesses that are SMEs (99.61%), the second-highest number of active enterprises (365,968), fifth-highest number of medium and high growth enterprises (16,083) and fourth-highest rate of workers who are self-employed (21.83%). These figures suggest Italy is a country booming with small businesses and could be fertile soil for a new entrepreneur to make their mark.
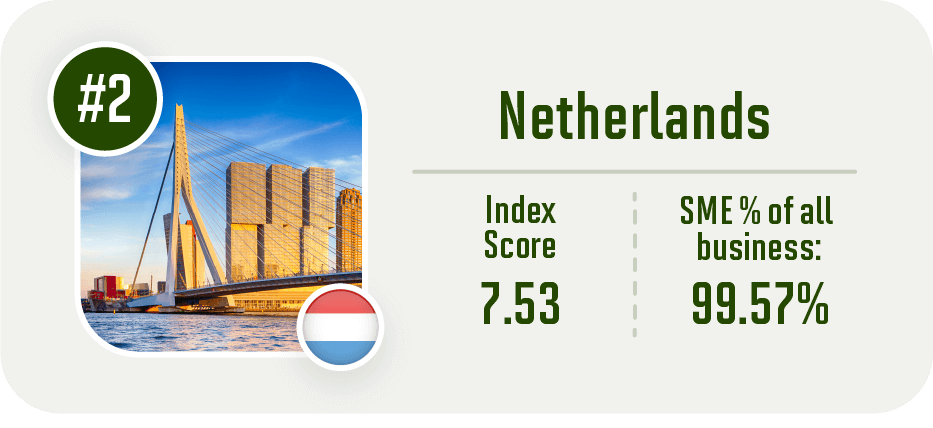
The Netherlands was the second-highest ranking nation on our list. While the Dutch state did not stand out in any particular data point, it performed well across all metrics, leading it to be ranked number two. They had the sixth-highest percentage of businesses being SMEs (99.53%), the seventh-highest number of medium and high-growth enterprises (7,859), the sixth-lowest number of enterprise bankruptcies (1,016) and the seventh-highest GDP per capita (US$63,445).

Close behind the Netherlands on our top three podium is another Mediterranean country: Türkiye. Türkiye had the highest number of active enterprises at 409,495, the third-highest number of medium and high-growth enterprises (20,956) and the second-highest self-employment rate at 30.17%. This nation has long been well placed for commerce as it is a geographical gateway between Europe and the Middle East, so it’s not surprising to see it ranked number three on our list.
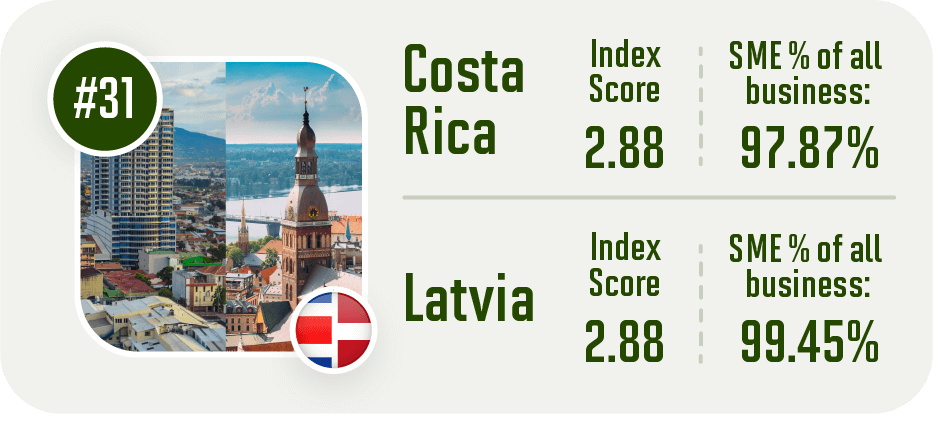
The little European state of Latvia and the Caribbean nation of Costa Rica tied for bottom place on our index. While Latvia didn’t have the worst scores for any particular metric, they had low scores across a few of them. For example, Latvia had the fifth-lowest number of active enterprises and medium and high growth enterprises (10,968 and 943 respectively), as well as the sixth-smallest GDP per hour and GDP per capita (US$41.44 and US$41,300).
Costa Rica on the other hand had the third-smallest number of active enterprises (5,309), plus the lowest GDP per hour (US$24) and GDP per capita (US$23,339). While they had some of the lowest scores for the GDP metrics, they scored better than Latvia in other areas which saw them avoid taking the bottom position by themselves. For example, Costa Rica has the third-highest rate of self-employed workers out of all countries analysed in the index (26.64%).
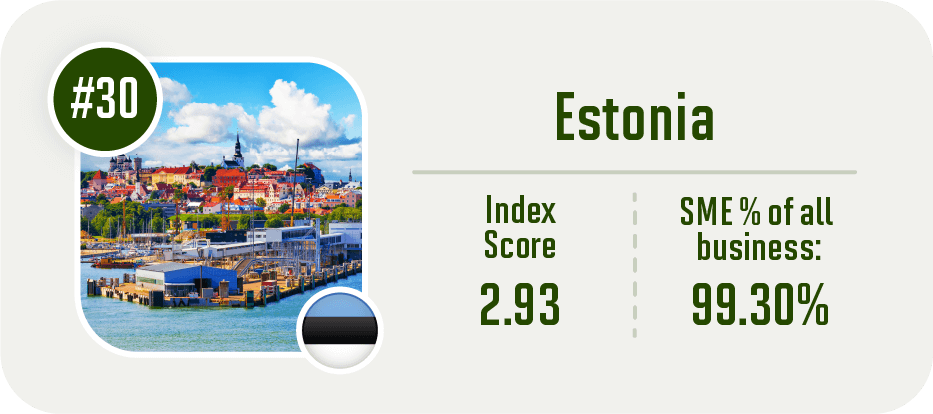
Following behind Latvia and Costa Rica for second-last place on our index is Estonia. The former Soviet Bloc had the fourth-smallest number of active enterprises (7,977) and the second-smallest count of medium and high growth enterprises (233 – just behind Iceland who had the lowest number at 122). Estonia also had the eighth-lowest GDP per hour worked at US$42.91. In other metrics they had average scores, and their subsequent low ranking suggests that an entrepreneur’s business may have slower growth here compared to other nations.
The full index of countries is provided below.
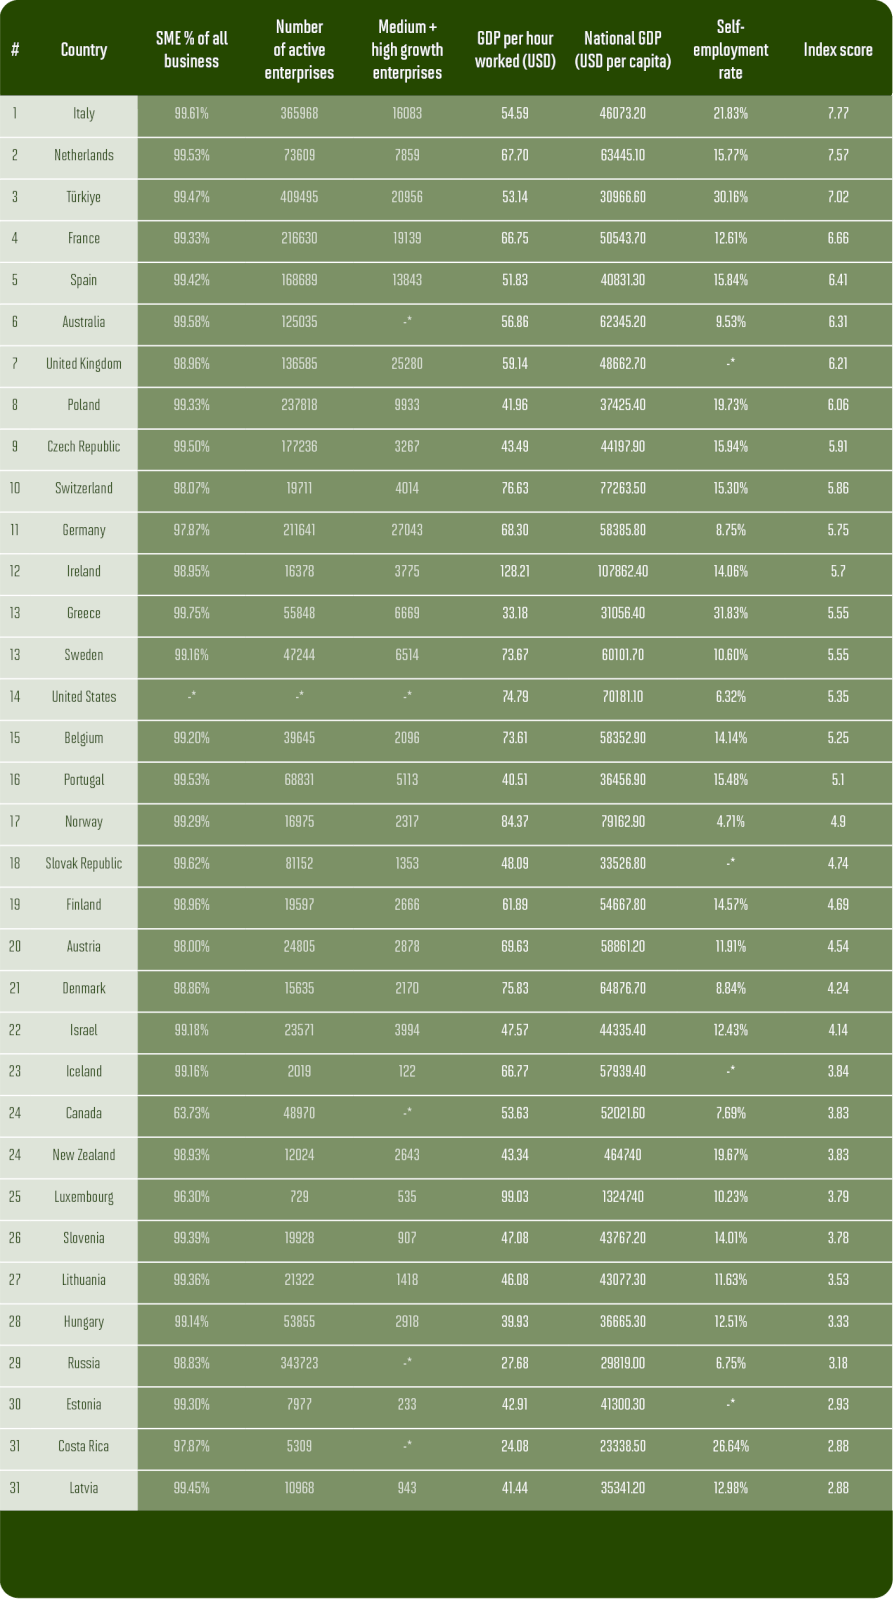
Compare the Market gathered data from the OECD for six different data points. We indexed these countries to assign each nation a score between 1 and 10 for each data point, with 10 representing the best score and 1 representing the lowest score. These numbers were then averaged together to create an overall index ranking out of 10 for each of the 34 countries we looked at, with the highest-ranking countries at the top and the lowest ranking countries at the bottom.
The factors we looked at were:
Each data point used the latest data available for that country.
The data points were ranked in the following order:
* A blank space means there was no data for this country for this data point. Countries missing one or two metrics were included in the index. To calculate their indexed ranking without negatively weighting them for having missing data points, an average figure for all countries where data was available for this metric was calculated. This average figure was then substituted for each country where no data was available for the purpose of indexing all countries for the overall ranking.