

The Burrow
No doubt many of us have or will present to a hospital emergency department at some point in our lives. Some of us gazed around the room while waiting, wondering, “What brought all these people into the emergency department?”
Fortunately, the Australian Institute of Health and Welfare (AIHW) can help. Each year, they release a report detailing Australian emergency department statistics.
We’ve studied the AIHW’s Emergency department care 2017-18: Australian hospital statistics report – so you don’t have to – for emergency department visits statistics to help us find the answer to our question.
Worth remembering, too, that while Medicare may cover your treatment in a public emergency department, it doesn’t cover everything around it – the ambulance ride (state dependent), being treated as a private patient if you’re admitted, or the follow-up care afterwards. That’s where health insurance comes in.
Picture this: you’re at home, and the stomach ache that began around lunchtime keeps getting worse and worse. Perhaps it was that three-day-old burrito you ate, but it could be something more insidious. So you decide to visit your local hospital.
Chances are, someone else is already there for the same reason.
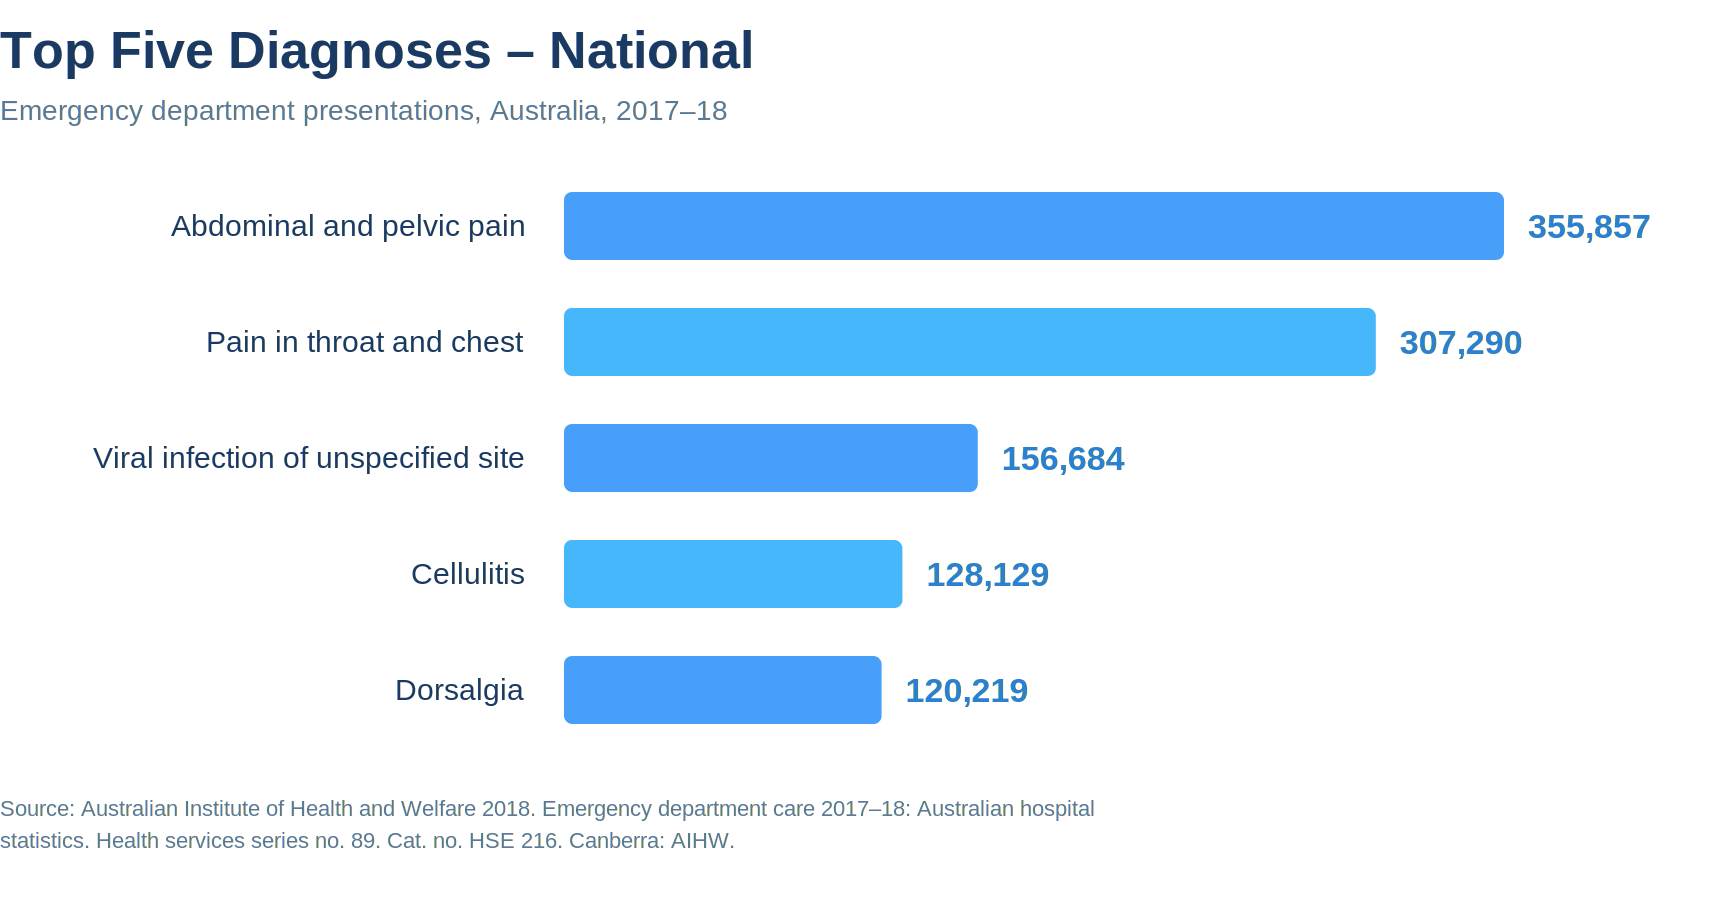
That’s because the most common reason for emergency department presentations in 2017-18, according to the AIHW, was abdominal and pelvic pain (355,857), causing a staggering 355,857 presentations across the country.
Throat and chest pain (307,290) sent nearly as many people to an emergency department and was strangely more common in Australia’s less populous states.
Interestingly, these top two diagnoses were more common than viral infections (156,684), cellulitis (128,129) and dorsalgia (120,219) by several hundred thousand presentations.
If you’re not a trained medical professional, here is a brief explanation of each diagnosis.
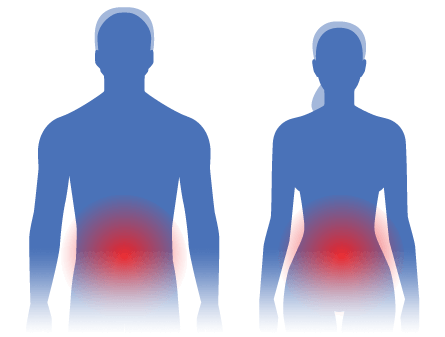
According to Victoria’s Better Health Channel, abdominal pain (officially pain that occurs from below your ribs to your pelvis) can be caused by things like stomach muscle strains, shingles, or infections, as well as more serious conditions like appendicitis, ulcers, or gallstones. Abdominal pain could even be caused by seemingly unrelated conditions like pneumonia or heart attacks.
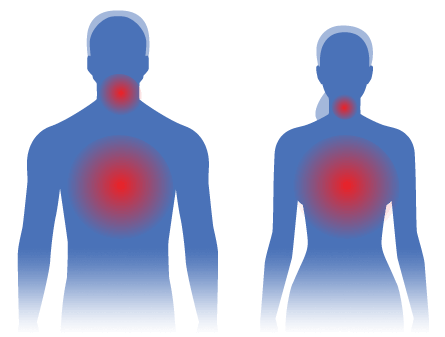
Like abdominal and pelvic pain, chest and throat pain can have several causes and origins. Causes of chest pain include heart attacks and angina (temporary chest pain caused by reduced blood flow into the heart), indigestion (reflux), inflamed rib joints, chest muscle strains, or even shingles.
According to the World Health Organization (WHO), a patient diagnosed with ‘viral infection of unspecified site’ may be suffering from:
An adenovirus infection – an infection of the upper respiratory tract, eyes, and regional lymph nodes causing sore throats and fevers.
An enterovirus infection – causing symptoms like fevers, rashes, runny noses, coughs, muscle aches, and mouth blisters. Some enteroviruses can cause viral conjunctivitis and hand, foot and mouth disease while others can (very rarely) cause more severe illnesses like viral meningitis or even polio.
A coronavirus infection – causing a contagious respiratory disease, the symptoms of which include fever, muscle ache, cough, and progressive breathing difficulty.
A parvovirus infection – parvovirus B19, in particular, can cause mild fever, cold-like symptoms, and a rash. Children with a parvovirus B19 infection can develop a red rash on their cheeks (which lead to the infection’s alternate name of ‘slapped cheek’ syndrome), as well as on their body, legs, and arms.
A papovavirus infection – a group of viruses that can cause growths, including warts, and even some cancers.

Cellulitis occurs when a particular area of the skin and tissue become inflamed, with symptoms including red, swollen, and painful skin that’s feels warm when touched. Severe cellulitis can also cause fever, nausea, chills, sweating, and generally-unwell feeling.
This condition is usually caused by bacteria entering the skin via a cut, scratch, ulcer, or insect bite to cause an infection. Cellulitis does spread and, if left untreated, can spread into the bloodstream causing sepsis (blood infection or poisoning) which requires emergency treatment.
Dorsalgia, or back pain, could have any number of causes, as the back is a complex structure with many bones, muscles, joints, and nerves. However, specific causes of back pain can include:
We’ve all heard that young people can be reckless, dangerous and irresponsible. Do Australian emergency department statistics tell the same story?
It would appear so – in some cases. Out of the whole of Australia, the largest age group in emergency department presentations were 25-34-year-olds.
However, this may be less to do with youth behaviour, and more do with the makeup of Australia’s population. According to the Australian Bureau of Statistics (ABS), as of June 2017, this age group represented the most significant proportion of our society.
This narrative of the reckless youth goes out of the window when you look closer at the male statistics for emergency department presentations. As you can no doubt see, the largest-presenting male age group was zero-four years old, not teenagers or young adults as you might expect considering the ‘reckless youth’ stereotype.









But if you ever do find yourself in that emergency department waiting room, wondering what brought everyone else in, you’ll want to know what’s covered and what isn’t. Medicare may take care of your public ED treatment — health insurance can help with an ambulance depending on your policy and the state you live in, the private admission and everything that comes after.