

The Burrow

May 29, 2026
You’ve just poured yourself a nice glass of wine, and as you go to reach for the tasty bowl of roasted potatoes, you knock it and spill that nice red across your new carpet. Accidental damage, such as spills, broken tech/screens, impacts, and furniture damage, are common occurrences in our homes. However, the accumulation of these everyday ‘small accidents’ can quietly add up to real money, stress and disruption.
But which of these accidents is the most common, and how much do they cost to repair? To find out, home and contents insurance comparison experts Compare the Market surveyed Australian, Canadian and American adults, asking what types of accidental damage they had experienced, how much it cost to repair, and whether they had made an insurance claim for any of the damage.
So safely put down your wine (so you don’t spill it) and let’s go through the results.
Australia’s household “oopsies” are mostly quiet, everyday damage rather than dramatic disasters.
The most common accidental damage was spills/stains on carpets/rugs and peeling/chipped paint (38%). Meaning more than 1 in 3 people have damaged the paintwork with accidents like sudden impacts or ruined their flooring with accidents like dropping chilli on the floor, like The Office’s Kevin Malone, for example.1 More than a quarter of respondents also said they had had water damage (28%), broken a tablet/phone/laptop (25%), and 1 in 5 (23%) had holes in walls or broken décor occur in their homes. These types of damage can be high-frequency, low-spectacle problems that households often live with for a while rather than immediately resolving.
| Damage type | Total | 18-24 years | 25-34 years | 35-44 years | 45-54 years | 55-64 years | 65+ years | NSW | VIC | QLD | SA | WA |
| Peeling/chipped paint | 38% | 33% | 39% | 47% | 41% | 37% | 31% | 39% | 36% | 34% | 36% | 47% |
| Spills/stains on carpets/rugs | 38% | 29% | 32% | 36% | 39% | 40% | 48% | 38% | 41% | 36% | 33% | 44% |
| Water damage | 28% | 27% | 23% | 29% | 30% | 25% | 32% | 29% | 28% | 29% | 19% | 30% |
| Broken tablet/phone/laptop | 25% | 41% | 31% | 32% | 30% | 10% | 13% | 29% | 24% | 20% | 18% | 27% |
| Hole in wall | 23% | 30% | 28% | 30% | 24% | 18% | 14% | 23% | 24% | 21% | 27% | 19% |
| Broken décor/glassware/chinaware | 23% | 20% | 18% | 24% | 21% | 25% | 27% | 25% | 21% | 20% | 16% | 24% |
| Broken furniture | 22% | 30% | 32% | 30% | 23% | 12% | 10% | 28% | 23% | 13% | 21% | 18% |
| Appliance damage | 22% | 19% | 32% | 27% | 20% | 21% | 11% | 28% | 21% | 17% | 16% | 18% |
| Shattered glass/window/mirror | 19% | 12% | 23% | 22% | 22% | 16% | 19% | 21% | 18% | 19% | 16% | 17% |
| None of the above | 18% | 12% | 17% | 13% | 21% | 22% | 22% | 18% | 15% | 21% | 29% | 15% |
| Pet-related damage | 17% | 22% | 17% | 22% | 20% | 16% | 11% | 18% | 18% | 15% | 22% | 19% |
| Roof damage | 14% | 12% | 11% | 7% | 15% | 19% | 18% | 15% | 15% | 14% | 10% | 14% |
| Cracked/smashed TV | 11% | 15% | 18% | 18% | 10% | 5% | 3% | 14% | 10% | 9% | 8% | 8% |
| Shelf falling off the wall | 6% | 4% | 8% | 11% | 8% | 1% | 5% | 7% | 6% | 6% | 4% | 7% |
Note: Respondents could choose multiple options to answer this question, so totals do not add up to 100%. Information from respondents in ACT, Northern Territory and Tasmania have been included in both the Total and each age group response.
Across generations, Broken devices peaked among 18–24s (40.7%), remained elevated through 25–34 (31%), 35–44 (32%), and 45–54 (30%), then dropped to 10% in 55–64s and 13% in 65+. This isn’t simply “young people break more stuff”; it signalled that younger cohorts are more likely to have an everyday dependence on these fragile and expensive items in the flow of home life. Peeling/chipped paint was prominent in the 25-54 age groups, with 39-47% of these cohorts needing to paint to address this damage. Spills/stains on carpets/rugs were the most common for the 55-64 and 65+ age groups, with nearly half of the 65+ age bracket reporting floor spills.
At the state level, it was common for residents in New South Wales (39%), South Australia (36%), and Western Australia (47%) to have damaged paint, while Victoria (41%) and Queensland (36%) had the highest reports of spills/stains.
The United States’ damage profile was similar to Australia’s, but some lovable, furry members of American households caused unwanted damage.
The top types of damage were spills/stains (39%), peeling/chipped paint (34%), holes in walls (30%) and broken devices (28%), but pet-related damage was the highest in America. Almost a quarter of American households (24%) have “my pet did this” stories they can share about occasions when their furry friends caused some damage to their homes. This type of damage was higher in the United States than in Australia (17%) and Canada (20%).
| Damage type | Total | 18-24 years | 25-34 years | 35-44 years | 45-54 years | 55-64 years | 65+ years | Northeast | Midwest | South | West |
| Spills/stains on carpets/rugs | 39% | 25% | 32% | 38% | 45% | 41% | 44% | 40% | 47% | 35% | 35% |
| Peeling/chipped paint | 34% | 29% | 42% | 37% | 40% | 23% | 25% | 38% | 35% | 33% | 30% |
| Hole in wall | 30% | 30% | 35% | 39% | 35% | 24% | 17% | 34% | 31% | 29% | 28% |
| Broken tablet/phone/laptop | 28% | 30% | 37% | 39% | 26% | 24% | 10% | 28% | 28% | 31% | 20% |
| Pet-related damage | 24% | 14% | 22% | 28% | 31% | 22% | 18% | 23% | 22% | 25% | 23% |
| Water damage | 23% | 12% | 20% | 28% | 28% | 22% | 19% | 23% | 23% | 23% | 21% |
| None of the above | 22% | 27% | 15% | 15% | 20% | 29% | 32% | 23% | 22% | 22% | 24% |
| Broken furniture | 21% | 20% | 28% | 24% | 23% | 16% | 13% | 26% | 21% | 20% | 17% |
| Appliance damage | 21% | 18% | 23% | 22% | 27% | 19% | 13% | 20% | 23% | 23% | 15% |
| Roof damage | 16% | 4% | 12% | 16% | 20% | 19% | 20% | 12% | 21% | 17% | 14% |
| Broken décor/glassware/chinaware | 15% | 7% | 12% | 14% | 19% | 17% | 15% | 15% | 13% | 15% | 16% |
| Cracked/smashed TV | 15% | 24% | 22% | 20% | 15% | 8% | 3% | 14% | 15% | 17% | 10% |
| Shattered glass/window/mirror | 14% | 9% | 17% | 18% | 17% | 12% | 6% | 12% | 12% | 16% | 12% |
| Shelf falling off the wall | 8% | 3% | 12% | 10% | 9% | 7% | 4% | 8% | 7% | 10% | 5% |
Note:Respondents could choose multiple options to answer this question, so totals do not add up to 100%.
Americans aged 45-65+ were more likely to experience spills/stains, with 45% of 45-54s, 41% of 55-64s, and 44% of 65+ reporting such accidents at home. In younger cohorts, 18-24s and 35-44s were more likely to damage their technology or cause holes in their walls, with 30% of 18-24s and 39% of 35-44s experiencing these issues. New paint jobs were common among Americans aged 25-34, with 42% reporting damage to their home paint.
At a regional level, the most common damage across the Northeast, Midwest, South, and West regions was spills/stains, at 40%, 47%, 35%, and 35%, respectively. Peeling paint was not far behind, with 38% of Northeast residents, 35% of Midwest residents, 33% of South residents, and 30% of West residents saying they needed a fresh coat to cover peeling/chipped paint. Broken technology and holes in walls were also common forms of damage nationwide.
Canada’s profile blends mess accidents, such as stains/spills, with impact-damage accidents, such as holes in walls and chipped paint.
The top four most common forms of damage in Canada were spills/stains (38%), peeling/chipped paint (34%), holes in walls (32%), and broken devices (30%). These types of damage often reflect busy households, cramped spaces, moving furniture, kids, DIY, or high indoor activity. They are also types that, again, Canadians would be willing to live with rather than have repaired.
| Damage type | Total | 18-24 years | 25-34 years | 35-44 years | 45-54 years | 55-64 years | 65+ years | Alberta | British Columbia | Manitoba | New Brunswick | Nova Scotia | Ontario | Quebec | Saskatchewan |
| Spills/stains on carpets/rugs | 38% | 31% | 37% | 41% | 35% | 44% | 35% | 49% | 42% | 47% | 29% | 32% | 41% | 17% | 41% |
| Peeling/chipped paint | 34% | 24% | 38% | 40% | 36% | 39% | 21% | 40% | 35% | 42% | 21% | 27% | 37% | 26% | 41% |
| Hole in wall | 32% | 25% | 40% | 45% | 28% | 26% | 17% | 39% | 28% | 46% | 34% | 30% | 32% | 26% | 39% |
| Broken tablet/phone/laptop | 30% | 48% | 41% | 35% | 27% | 22% | 13% | 36% | 29% | 33% | 24% | 23% | 32% | 23% | 34% |
| Water damage | 27% | 28% | 25% | 28% | 31% | 25% | 25% | 31% | 29% | 35% | 26% | 25% | 24% | 26% | 27% |
| Broken furniture | 26% | 32% | 35% | 32% | 27% | 16% | 13% | 29% | 28% | 32% | 24% | 18% | 27% | 23% | 27% |
| Appliance damage | 23% | 23% | 26% | 31% | 23% | 23% | 12% | 29% | 25% | 23% | 21% | 20% | 23% | 18% | 29% |
| None of the above | 21% | 13% | 14% | 14% | 23% | 21% | 37% | 14% | 21% | 11% | 29% | 32% | 20% | 25% | 15% |
| Pet-related damage | 20% | 13% | 21% | 24% | 23% | 21% | 13% | 27% | 21% | 30% | 24% | 20% | 19% | 12% | 20% |
| Broken décor/glassware/chinaware | 18% | 14% | 18% | 16% | 19% | 23% | 16% | 20% | 19% | 12% | 16% | 27% | 19% | 13% | 20% |
| Shattered glass/window/mirror | 15% | 21% | 18% | 15% | 14% | 11% | 13% | 19% | 11% | 18% | 13% | 16% | 13% | 16% | 15% |
| Roof damage | 14% | 14% | 12% | 12% | 15% | 13% | 17% | 18% | 11% | 25% | 11% | 14% | 15% | 10% | 10% |
| Cracked/smashed TV | 10% | 10% | 16% | 14% | 10% | 5% | 2% | 12% | 7% | 12% | 13% | 2% | 12% | 8% | 15% |
| Shelf falling off the wall | 9% | 17% | 10% | 13% | 7% | 7% | 2% | 9% | 9% | 9% | 11% | 2% | 11% | 4% | 17% |
Note:Respondents could choose multiple options to answer this question, so totals do not add up to 100%. Information from respondents in Prince Edward Island and Newfoundland have been included in both the Total and each age group response.
Devices such as phones, tablets and laptops are quite vulnerable in the hands of Canadians aged 18-24, with nearly half of this age group saying they had broken one of these devices in an accident at home. Canadians aged 25-34 aren’t much better, with 41% breaking a phone, tablet or laptop. This suggests that for younger Canadians, these vulnerable devices are not occasional possessions, as they are for older generations, but rather a part of their daily infrastructure.
For older Canadians, the most common accidents were a mix of impact and mess damage. For the 35-44 age group, it was a hole in the wall (45%) and peeling and chipped paint (36%) for 45-54s, and spills/stains (44%) for 55-64s. Surprisingly, more than a third of 65+ said they had experienced no accidental damage at home, while another third reported spills or stains on their flooring.
At the provincial level, Alberta, British Columbia, Manitoba, Nova Scotia, Ontario, and Saskatchewan all had spills and stains as the most common accident at home, at 49%, 42%, 47%, 32%, 41%, and 41%, respectively. In New Brunswick, a hole in the wall (34%) was the most common type of damage, with a third of residents experiencing it. In Quebec, a quarter said they had had a hole in the wall, peeling paint and water damage (all 26%).
Across Australia, Canada and the United States, the dominant story was not a single dramatic disaster, but everyday ‘small accidents’ that can quietly add up to real money, stress and disruption. The most reported mishap was consistent across all three countries, with spills and stains on carpets/rugs at 38-39% each.
However, when it came to impact damage, it was much higher in North America, with holes in walls at 23% in Australia compared to 31% in Canada and 30% in the USA. The US stood out for pet-related damage (24% vs Canada’s 20% and Australia’s 17%), while Australia had a higher percentage of residents experiencing shattered glass/windows (19% vs Canada’s 15% and the US’s 14%). When it came to broken furniture, Canadians were more likely to experience this type of accidental damage (26%) than Australians (22%) and Americans (21%).
However, across all three countries, injuries were uncommon, with a large majority of Australians (92%), Canadians (93%), and Americans (89%) reporting no injury at the time of the incident. When injuries were reported, the US had higher rates, with 1 in 10 residents reporting an injury occurring at the same time they experienced accidental damage to their households. Australia and Canada experienced much lower rates, with 6% and 5%, respectively.
| Damage type | Australia | USA | Canada |
| Spills/stains on carpets/rugs | 38% | 39% | 38% |
| Peeling/chipped paint | 38% | 34% | 34% |
| Water damage | 28% | 23% | 27% |
| Broken tablet/phone/laptop | 25% | 28% | 30% |
| Hole in wall | 23% | 30% | 32% |
| Broken décor/glassware/chinaware | 23% | 15% | 18% |
| Broken furniture | 22% | 21% | 26% |
| Appliance damage | 22% | 21% | 23% |
| Shattered glass/window/mirror | 19% | 14% | 15% |
| None of the above | 18% | 22% | 21% |
| Pet-related damage | 17% | 24% | 20% |
| Roof damage | 14% | 16% | 14% |
| Cracked/smashed TV | 11% | 15% | 10% |
| Shelf falling off the wall | 6% | 8% | 9% |
Note:Respondents could choose multiple options to answer this question, so totals do not add up to 100%.
The accumulation of these everyday ‘small accidents’ can quietly add up to real money, and the amount Australian, Canadian and American households are paying is quite hefty.
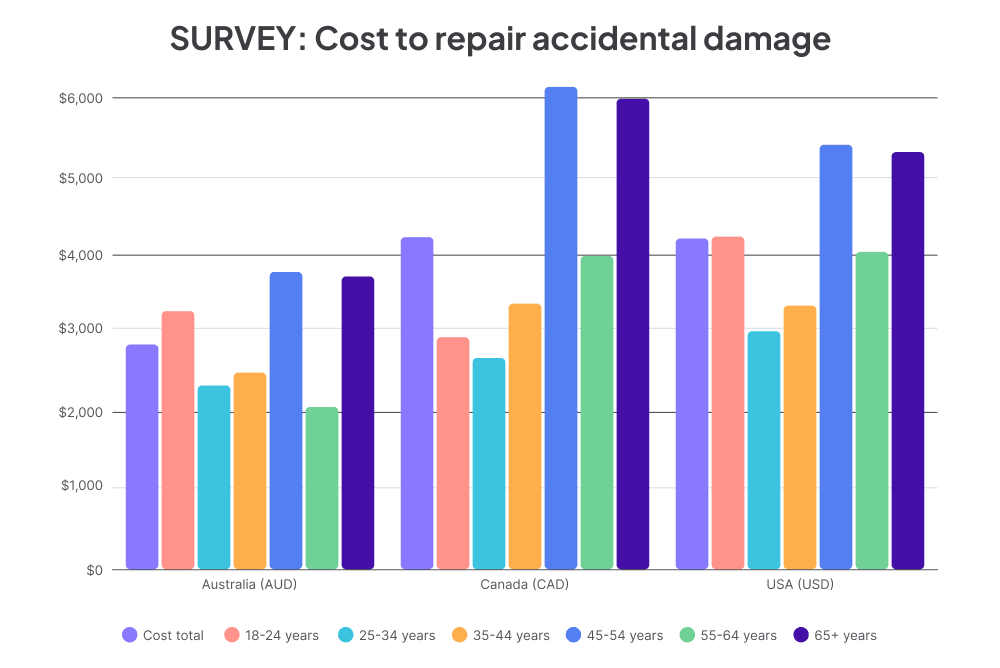
The average repair cost Australians pay for accidental damage is AUD$2,957. At an age level, 45-54-year-olds had the highest average repair costs at AUD$3,779, followed by 65+ (AUD$3,722) and 18-24 (AUD$3,282). Queensland’s residents were paying more for repairs than those in the rest of the country, forking out AUD$3,405 on average. New South Wales residents paid AUS$3,265, Western Australians AUD$2,961, Victorians AUD$2,321 and South Australians AUD$2,237 on average.
In the States, Americans fork out an average of US$4,205 to repair accidental damage in their homes. As in Australia, 45-54-year-olds pay the most on average, at US$5,397, followed closely by 65+, at US$5,304. At the regional level, repair bills for residents in the West were the most expensive, averaging US$4,536. Midwest residents also paid a hefty price, at an average of US$4,177, while the South (US$3,758) and the Northeast (US$3,312) paid less on average. Pennsylvania was the most expensive state on average, with residents copping US$5,475 repair bills for their damage. Following the Keystone State were California (US$5,040), Florida (US$4,770) and Ohio (US$4,737).
The average price for Canadians to repair accidental damage was CAD$4,223, with 45-54-year-olds and 65+ experiencing hefty average repair bills of CAD$6,133 and CAD$5,982, respectively. Canadians between the ages of 18 and 34 were paying the least on average, with 25-34s forking out just CAD$2,686 and 18-24s CAD$2,950. At the province level, residents in New Brunswick were paying the most at CAD$7,697 per repair, followed by Quebec CAD$5,195, and Alberta (CAD$5,188).
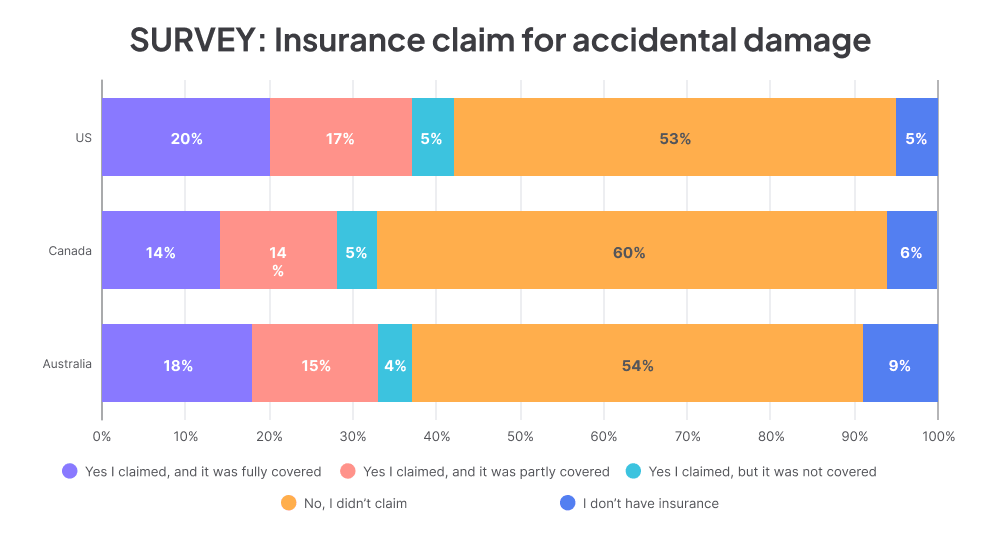
Despite the high repair costs, more than half of residents in all three countries (60% in Canada, 54% in Australia, 53% in the US) didn’t file an insurance claim, showing that they were more willing to patch it up themselves or fork out for a professional to fix the problem for them.
Across the countries, 41% of Americans, 34% of Canadians and 37% of Australians made a claim (fully, partly or not covered). Among those who did claim, 1 in 10 Australians (10%), Canadians (16%) and Americans (13%) said they weren’t covered, showing how often households discover coverage limits only after something goes wrong and they need to make a claim.
Adrian Taylor, Chief Executive – General Insurance, says these everyday ‘small accidents’ can lead to costly surprises for households.“Most household ‘oops’ moments aren’t dramatic disasters, they’re the everyday spills, smashed screens and bumps that can quietly stack up to thousands in repair bills.
“What can catch many people off guard is that accidental damage isn’t always covered the way they assume in their insurance policy, and some only discover limits or exclusions once they try to claim after a minor accident like spilling some wine or chipping some paint.
“Accidental damage is generally offered as an optional extra and typically covers mishaps like dropping your TV, red wine spills, and glass door breakage. Things like general wear and tear, malicious damage and faulty workmanship are typical exclusions from accidental damage cover.
“That’s why it’s worth checking your home and contents policy details and comparing a range of cover options before something does go wrong.”
Before purchasing any policy, be sure to check the Product Disclosure Statement (PDS) and Target Market Determination (TMD) so that you are aware of any limits, exclusions or restrictions.
Compare the Market commissioned PureProfile to survey 1,020 Australian, 1,013 Canadian and 1,104 American adults in April 2026. Information from respondents in Tasmania, ACT, Northern Territory (Australia), New Brunswick, Newfoundland and Prince Edward Island (Canada) have only been included in both the Total and each age group response.