The Burrow
Apr 18, 2023
Cars have revolutionised transport, though there is always an element of risk every time we get behind the wheel. Whether major or minor, car accidents can be traumatic experiences that can have a big impact on us and our driving habits.
To get a better understanding of people’s experiences with car accidents, a Compare the Market survey asked over 3,000 Australians, Canadians and Americans a series of questions, including:
Here’s what we found.
According to the survey results, more Australians experienced a car crash than Canadians and Americans (78.9% of respondents compared to 72.3% and 74.9% respectively). However, Canadians and Americans were more likely to experience a major car crash, while Australians had the highest number of people who experienced a minor car crash (59.10% of respondents).
The survey results for that question are listed below.
| Have you been in a car crash? | Australia | Canada | USA |
| Yes, a major one | 9.5% | 15.5% | 15.6% |
| Yes, a minor one | 59.1% | 47.6% | 44.5% |
| Yes, both a major and minor one | 10.3% | 9.2% | 14.8% |
| No | 21.1% | 27.7% | 25.1% |
For those surveyed who said they were in a car accident, 21.30% of Australians said they were at fault, compared to 20% of Americans and 19.80% of Canadians. The difference between these results is small, but noticeable.
Interestingly, Australians were also more likely to say the driver of the other vehicle was at fault than Americans and Canadians (61.50% compared to 59.10% and 58.80% respectively). This is because Canadians and Americans were more likely to say that they were a passenger in a vehicle where the driver was at fault or that nobody was at fault.
| Who was at fault? | Australia | Canada | USA |
| I was at fault | 21.3% | 19.8% | 20.0% |
| I was a passenger, and my driver was at fault | 9.6% | 12.5% | 11.6% |
| The driver of the other vehicle was at fault | 61.5% | 58.8% | 59.1% |
| Nobody was at fault | 4.9% | 7.1% | 5.7% |
| I’m not sure | 2.7% | 1.8% | 3.6% |
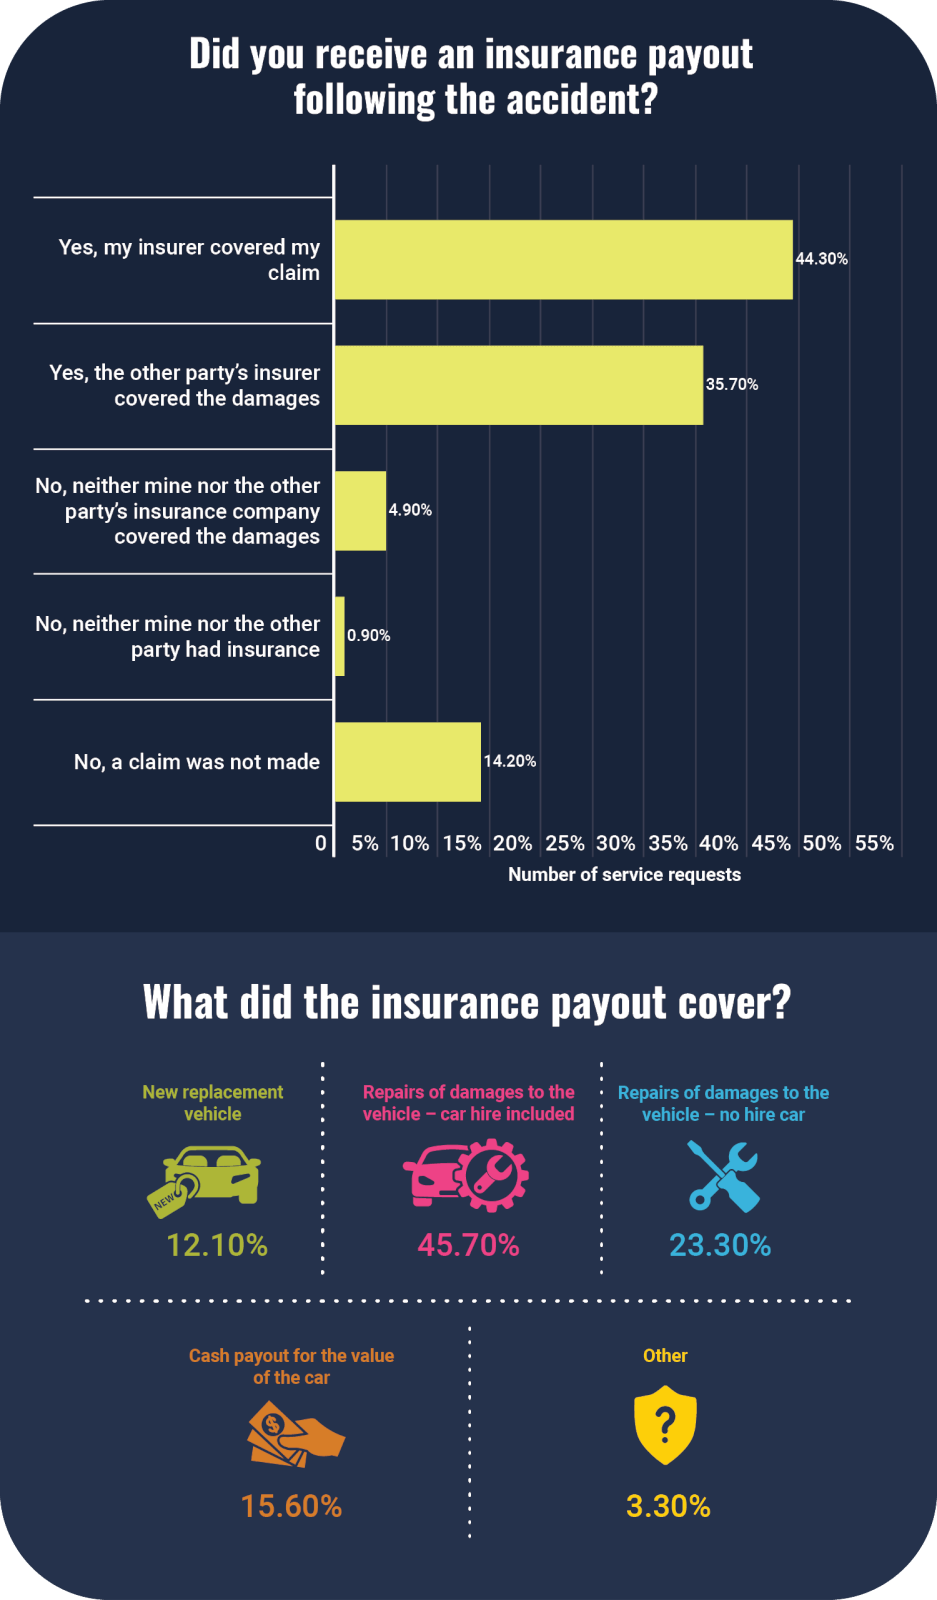
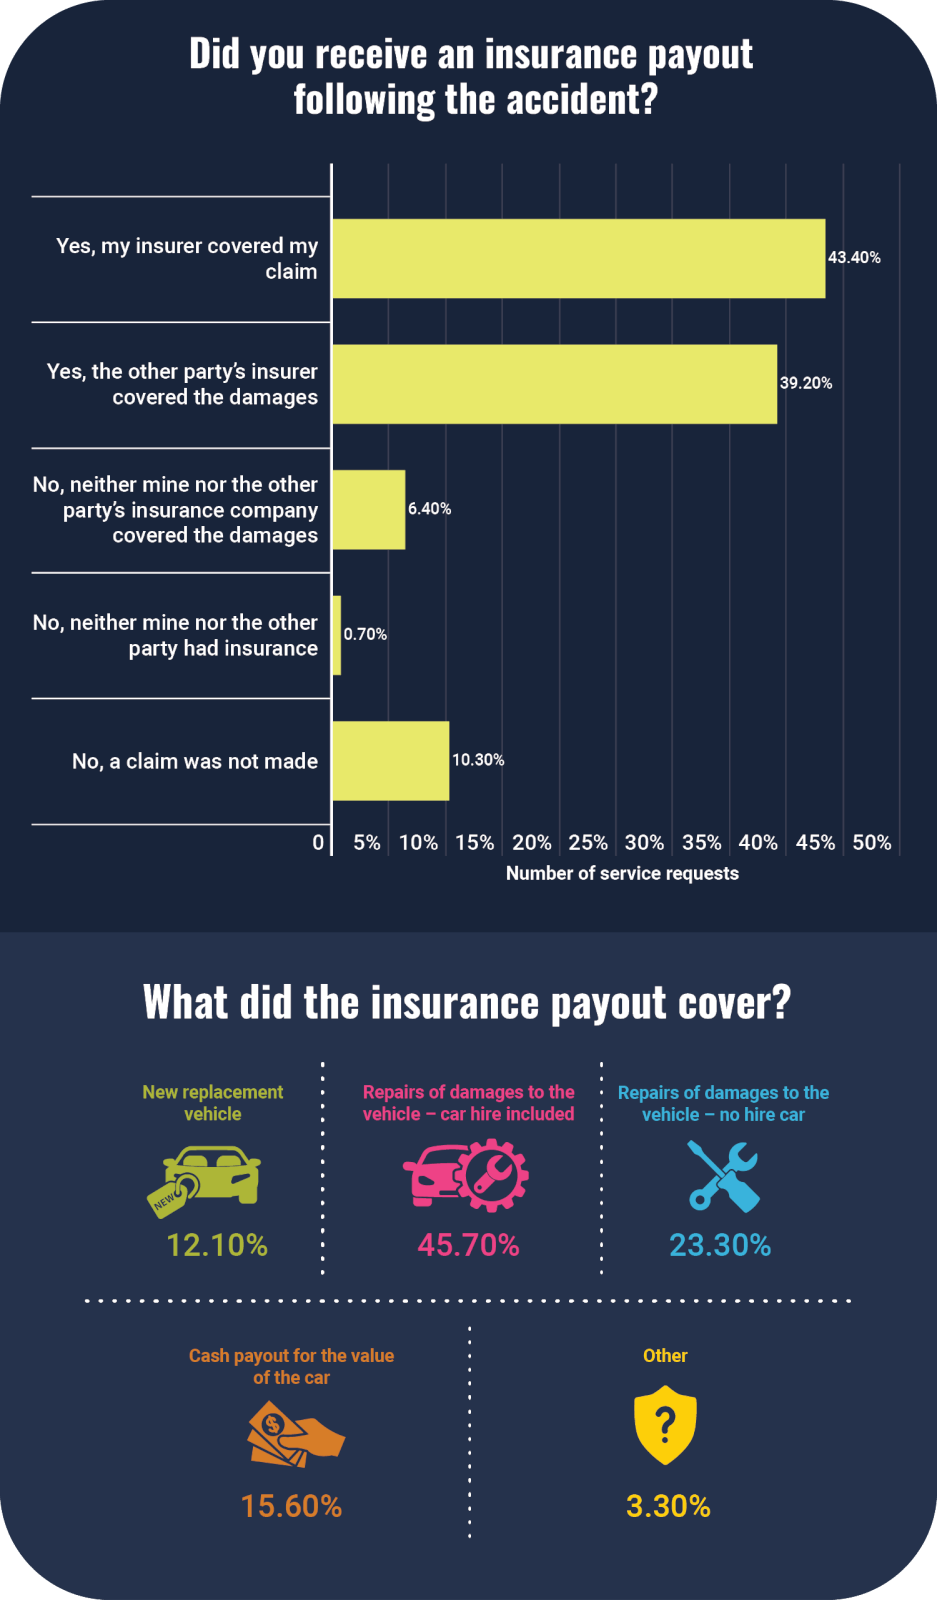
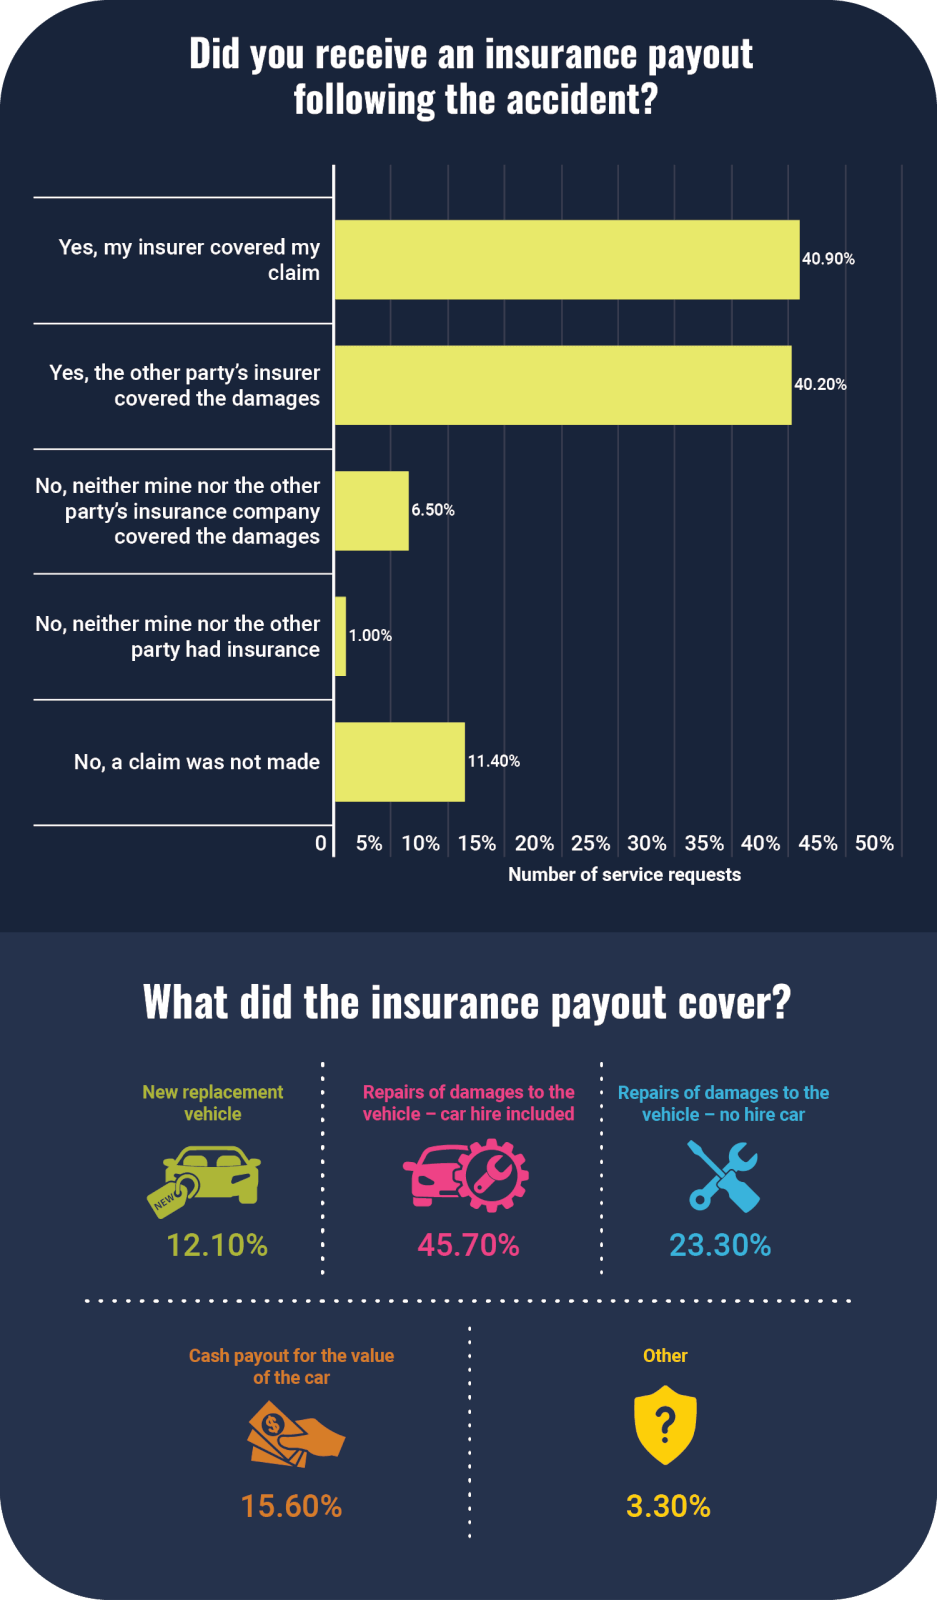
The vast majority of car accidents across all three countries were covered by car insurance – either the insurance of the survey respondent or the insurance of another party involved in the incident. Eighty per cent of Australian respondents had car insurance cover, as did 82.60% of Canadians and 81.10% of Americans.
The exact breakdown of who was covered and what those claims covered, are listed in the tables below.
Australians who received a payout from their insurance or the other party’s insurance were more likely to have repairs covered but did not receive a hire car (47.50% of respondents). In contrast, the most common response from Canadians and Americans was that they got repairs covered and were given a hire car to help them get around while their vehicle was fixed up (50.20% and 45.70% respectively).
Interestingly, Canadians and Americans were twice as likely to say they received a new replacement vehicle than Australians (15.80% and 12.10% vs 6.80%).
Comparing car insurance can be really beneficial for car owners looking to save money or get a better understanding of what their policy includes. Compare the Market’s General Manager of General Insurance, Adrian Taylor, explains how car owners can compare multiple policies in minutes.
“When using a comparison site like Compare the Market, you’ll need to enter some details about yourself and the car. Once you get to the results, your quotes will be shown to you listed in order of cheapest price to most expensive,” says Taylor.
“However, paying attention to all the other data you can compare is vital. For example, you can weigh up excess payments, special offers, and coverage. Our site makes it easy to select up to three available options and compare them side by side, viewing a list of coverage side by side,” he explains.
“This makes it easy to quickly see what a policy does or doesn’t cover, so you can make an informed decision about which of the available options you want to purchase,” says Taylor, “each policy will be subject to exclusions, restrictions and limits, which can differ from policy to policy, so it’s vital to review the details before you buy. For full product details, these will be found in the Product Disclosure Statement (PDS), which can be viewed before you buy.”
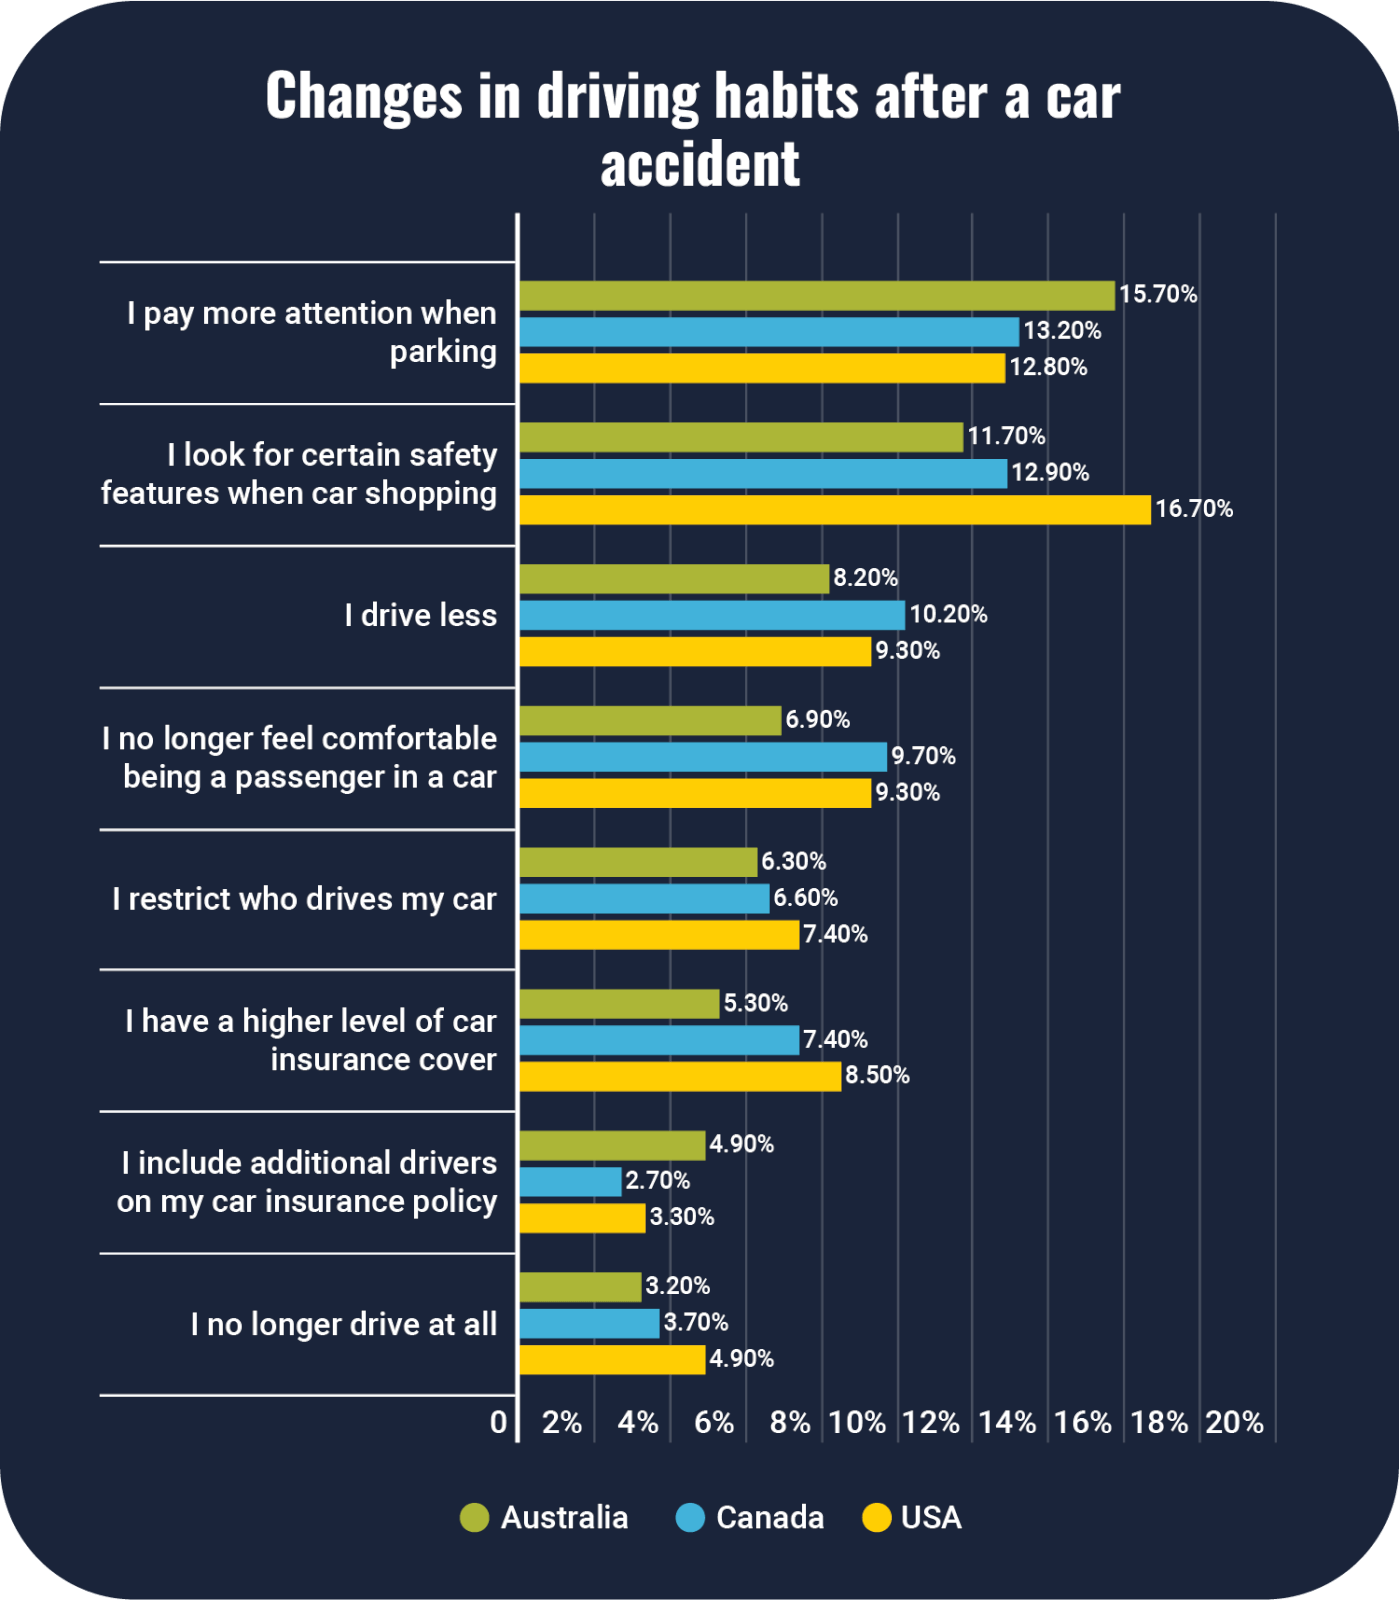
There are many ways drivers can be affected following a car crash, including how they drive the car following the accident. Interestingly, the most common response from Australians was that their driving habits didn’t change (39.80%). In contrast, only 32.50% of Canadians and 34.80% of Americans said there was no change in how they drove, which was the second-most popular option for both these countries.
For those who did make a change after a car accident, the most common change was that they drove more carefully and paid more attention to road rules (44% for Canadians, 41.70% for Americans and 35.70% for Australians). The next most common responses were paying more attention when parking and looking for certain safety features when shopping for a new car.
In October 2022, Australian car repair company mycar Tyre & Auto unveiled the Return Plate, or R Plate, for drivers returning to the road after time away following an accident.7 While not an official type of licence or recognised by traffic authorities, the campaign is designed to support those experiencing mental trauma following an accident and encourage other road users to be more conscientious.
With more people back on the road post COVID, drivers will need to keep more alert as traffic – and car incident rates – increase.
Compare the Market commissioned Pure Profile to survey 1,004 Australians, 1,008 Canadians and 1,009 Americans in November 2022.
1 Road Deaths: 12 month total. Australian Road Deaths Database. 2022.
2 Population. Australian Bureau of Statistics. 2022.
3 Canadian Motor Vehicle Traffic Collision Statistics: 2020. Transport Canada. 2022.
4 Population estimate quarterly. Statistics Canada. 2022.
5 National Highway Traffic Safety Administration. U.S. Department of Transportation. 2022.
6 QuickFacts. United States Census Bureau. 2022.
7 Return Plates. mycar Tyre & Auto. 2022.