The Burrow
Oct 28, 2022
The future may be electric, but the journey to cleaner transport continues to sputter and stall as cost remains a major barrier for the public.
So who’s driving the change and who’s still stuck in second gear?
As experts in comprehensive car insurance, we were keen to share our knowledge on how car insurance works for this new age of clean vehicles.
We understand that every car is different, and the same goes for car insurance policies – they’re not all the same. Car insurance policies can vary based on a number of factors, such as the level of cover provided or the way a payout may be calculated in the event you need to make a claim.
But that doesn’t necessarily mean you need a different policy for every different car that’s out there. As an example, regardless of whether you drive an electric vehicle, your car should be covered like any petrol or diesel car under a regular car insurance policy. In other words, you will not need to find specialist cover just because you drive an electric vehicle.
Something to think about however, is given the cost to replace various parts in an electric vehicle can be especially high, it’s worthwhile considering comprehensive cover in the event you are in an accident that causes significant damage.
Regardless of what you are looking for in a policy, we recommend reading the Product Disclosure Statement (PDS) prior to purchasing so that you know exactly what you are covered for, and what restrictions or exclusions you may be subject to.
Now that you know what to look for when in the market for a new car insurance policy, you may be curious to know how many other Australians are also on the lookout for an electric vehicle.
We surveyed more than 2,500 adults across Australia, America, and Canada to understand their preferences for new vehicles, and what they might spend on both a petrol or electric vehicle.
Across all countries included in the research, some key points remained consistent:
There were also a few stark differences between the three nations:
Continue reading for a more specific breakdown of each country’s results.
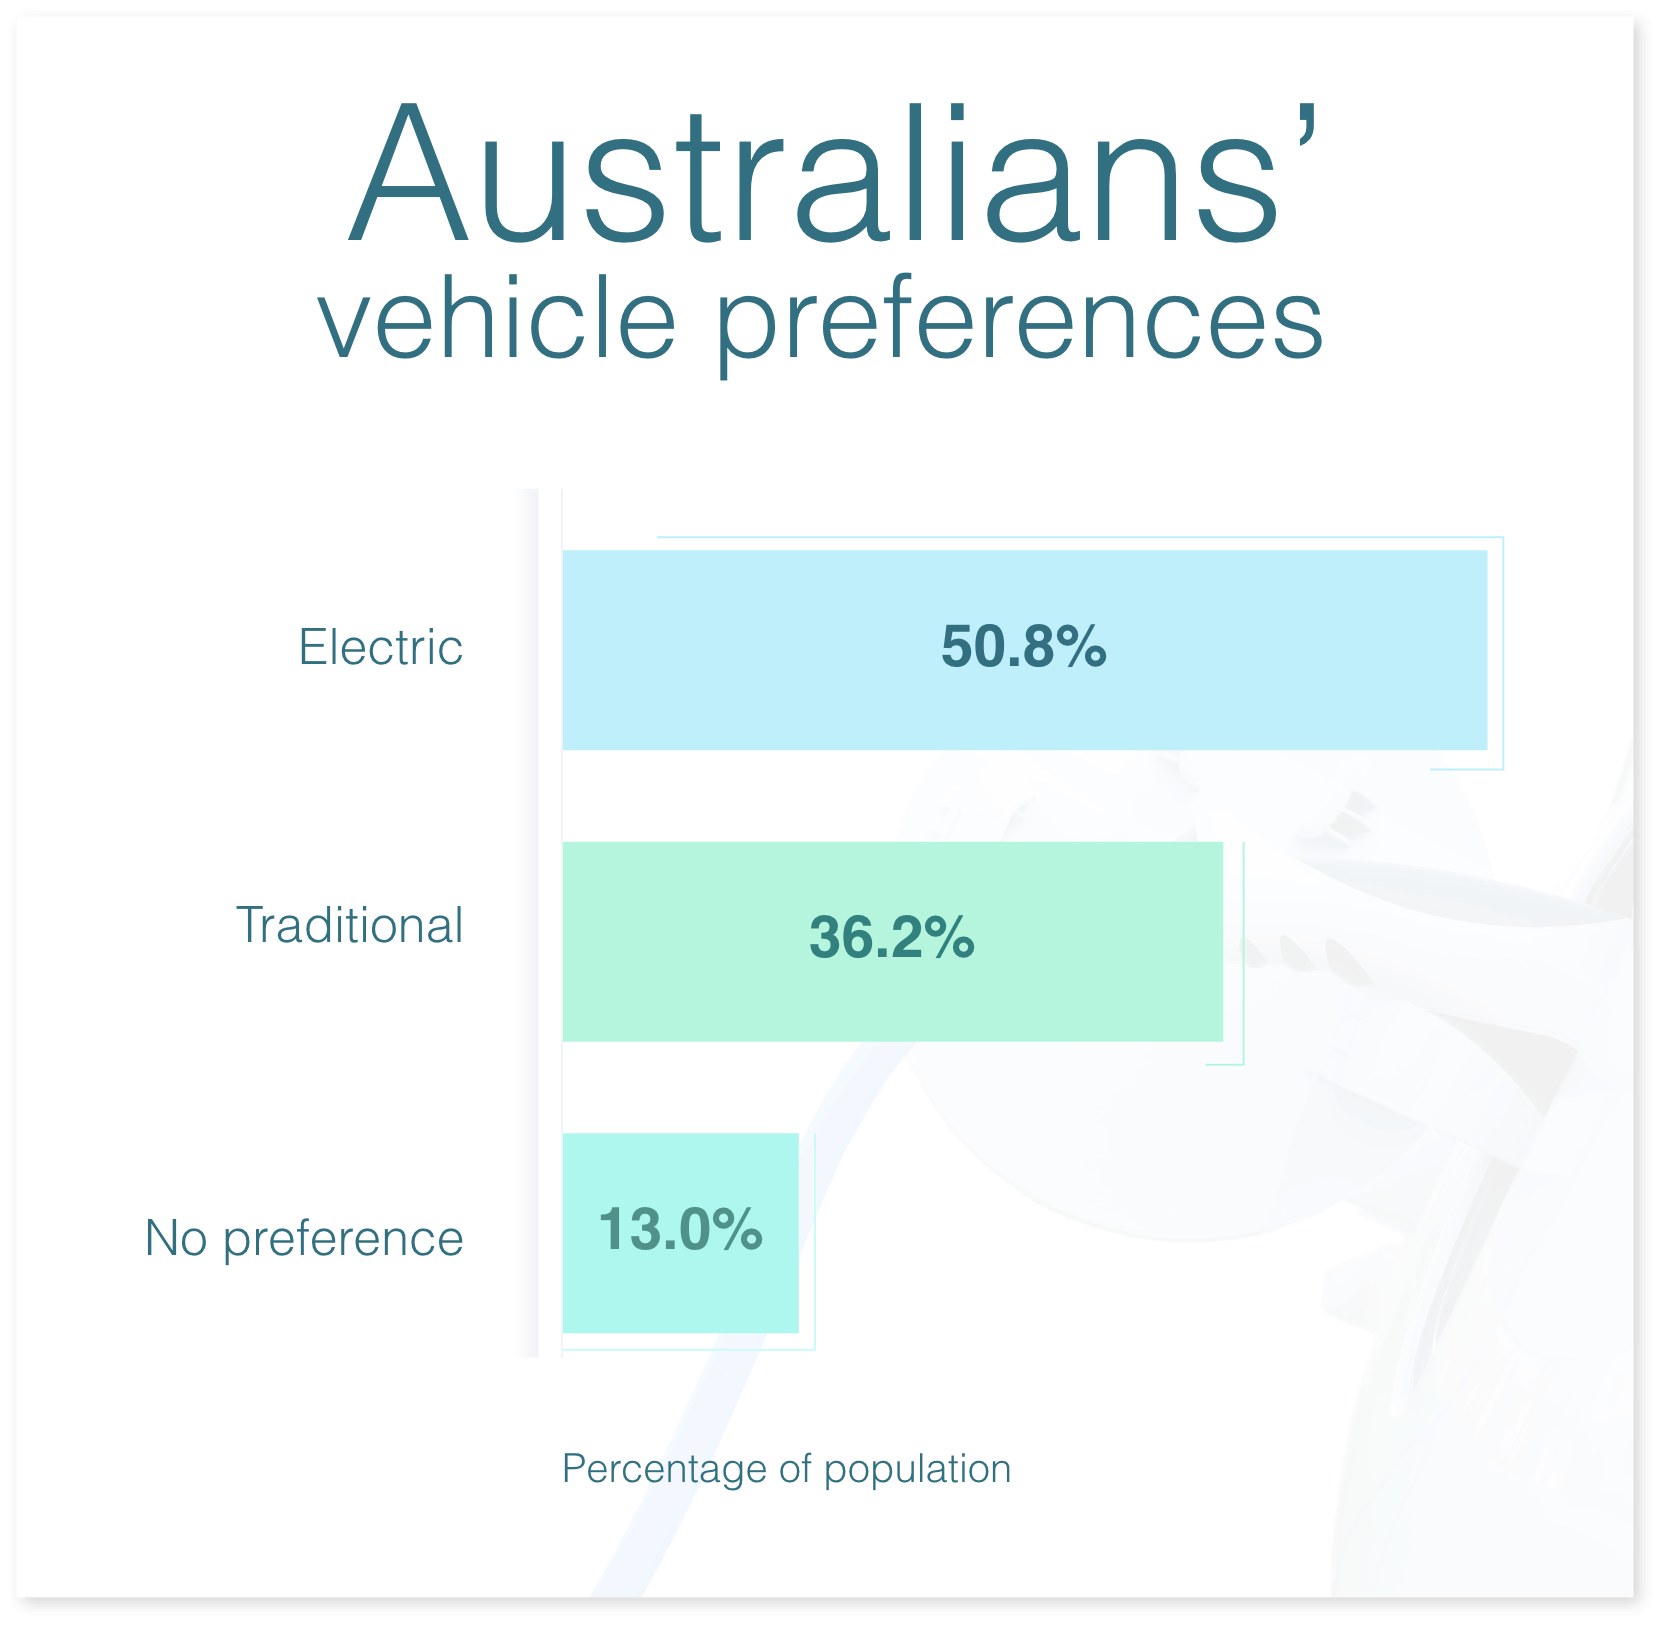
The first thing we wanted to understand was whether Australians had a preference for traditional or electric vehicles (EVs). In order to do this, we asked the question: If two identical vehicles were available in both a traditional or electric model at the same price, which would you prefer?
Half of Australia said they would prefer an electric car (50.8%), compared to just 36.2% that would opt for a traditional vehicle. The remainder indicated no particular preference.
Of those that favoured EVs, 25-34-year-olds were the fondest, as represented by almost 58% of the age group. Those aged 65 and older were the most likely generation to opt for traditional vehicles. We also found that men were slightly more likely than women to prefer an EV, indicated by 55% of males compared to 46% of females.
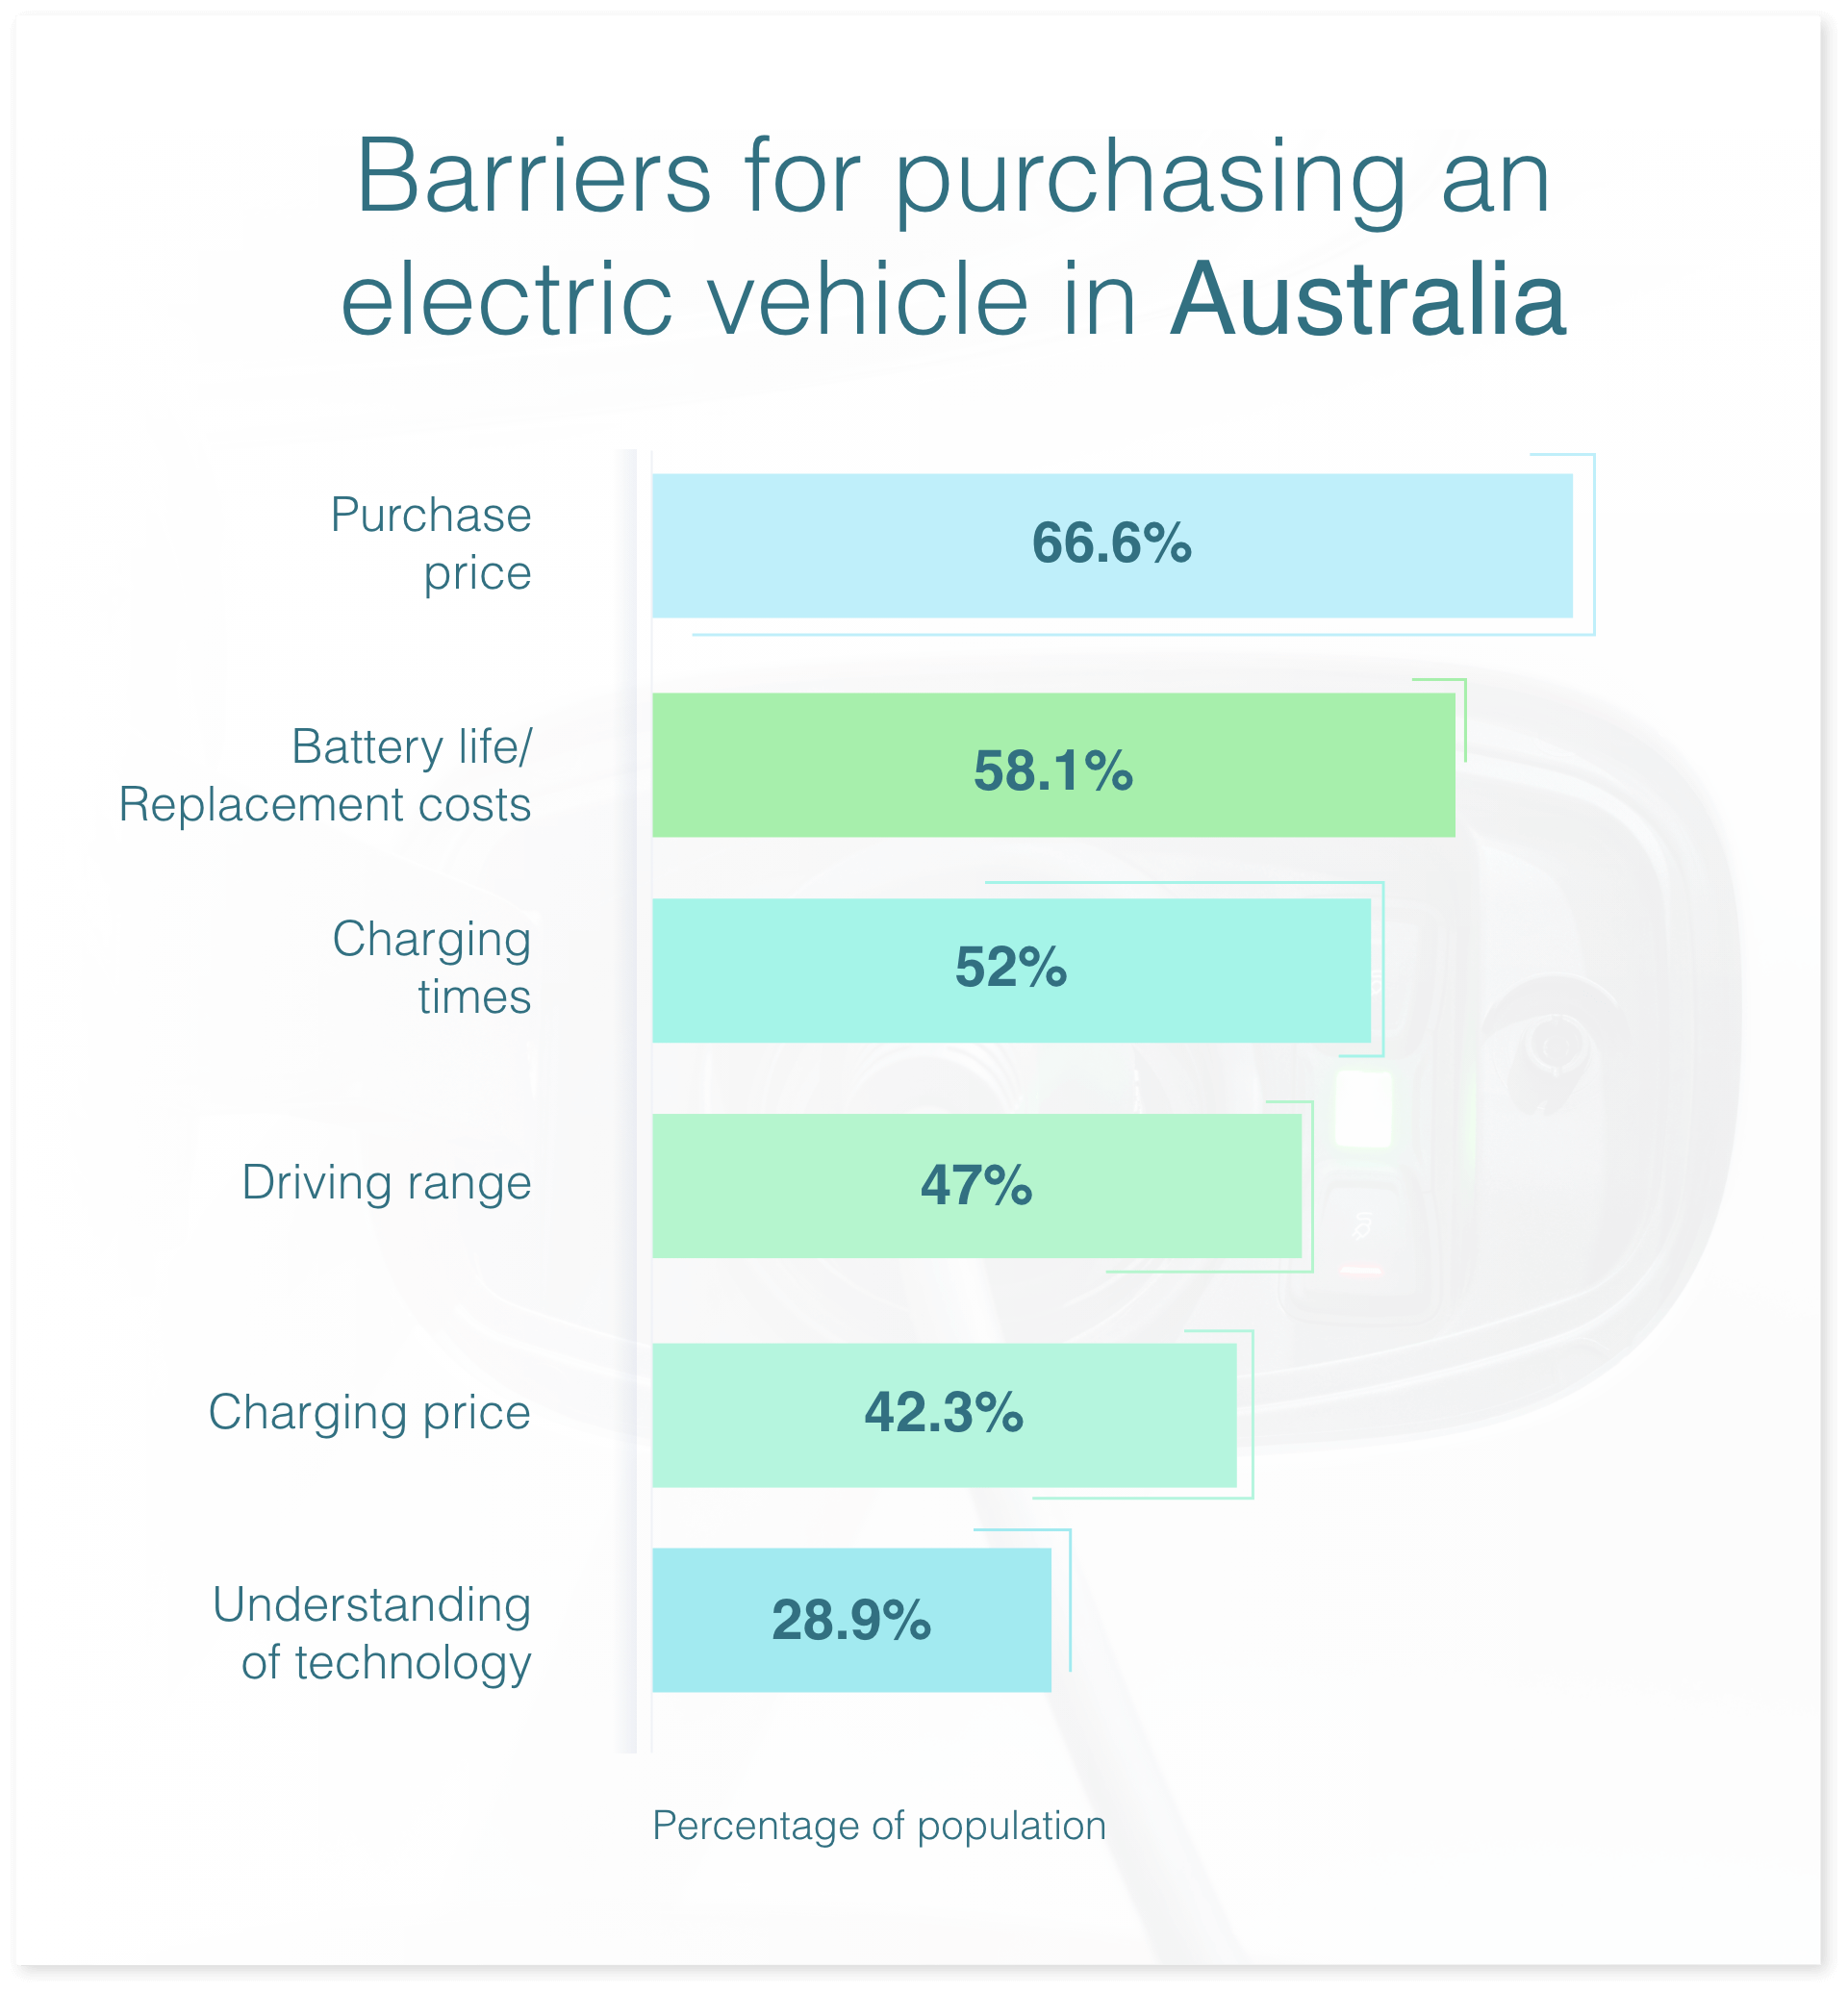
When it comes to understanding what dissuades prospective buyers from going electric, the main barrier is purchase price (66.6% of population). This was especially true in 35-44-year-olds, who showed the highest likelihood of indicating purchase price as the key driver for not purchasing an EV.
Another common roadblock was the availability of charging stations, among honourable mentions such as the driving range of the car and an understanding of the technology.
Just 6% of respondents indicated that they saw no barriers when it came to the purchase of an EV.
Interestingly, while the older generation (65+) was not the most likely to state ‘understanding of technology’ as a barrier, they were the most likely to indicate charging time and price, driving range of the car, and the cost of battery replacement, which may indicate that those in this age group do in fact have a lesser understanding of the technology than other age groups included in the study.
Another striking comparison can be made between genders. Not only were women more likely to prefer traditional vehicles, they were also more likely than men to quote five of the six key barriers to purchasing an EV.
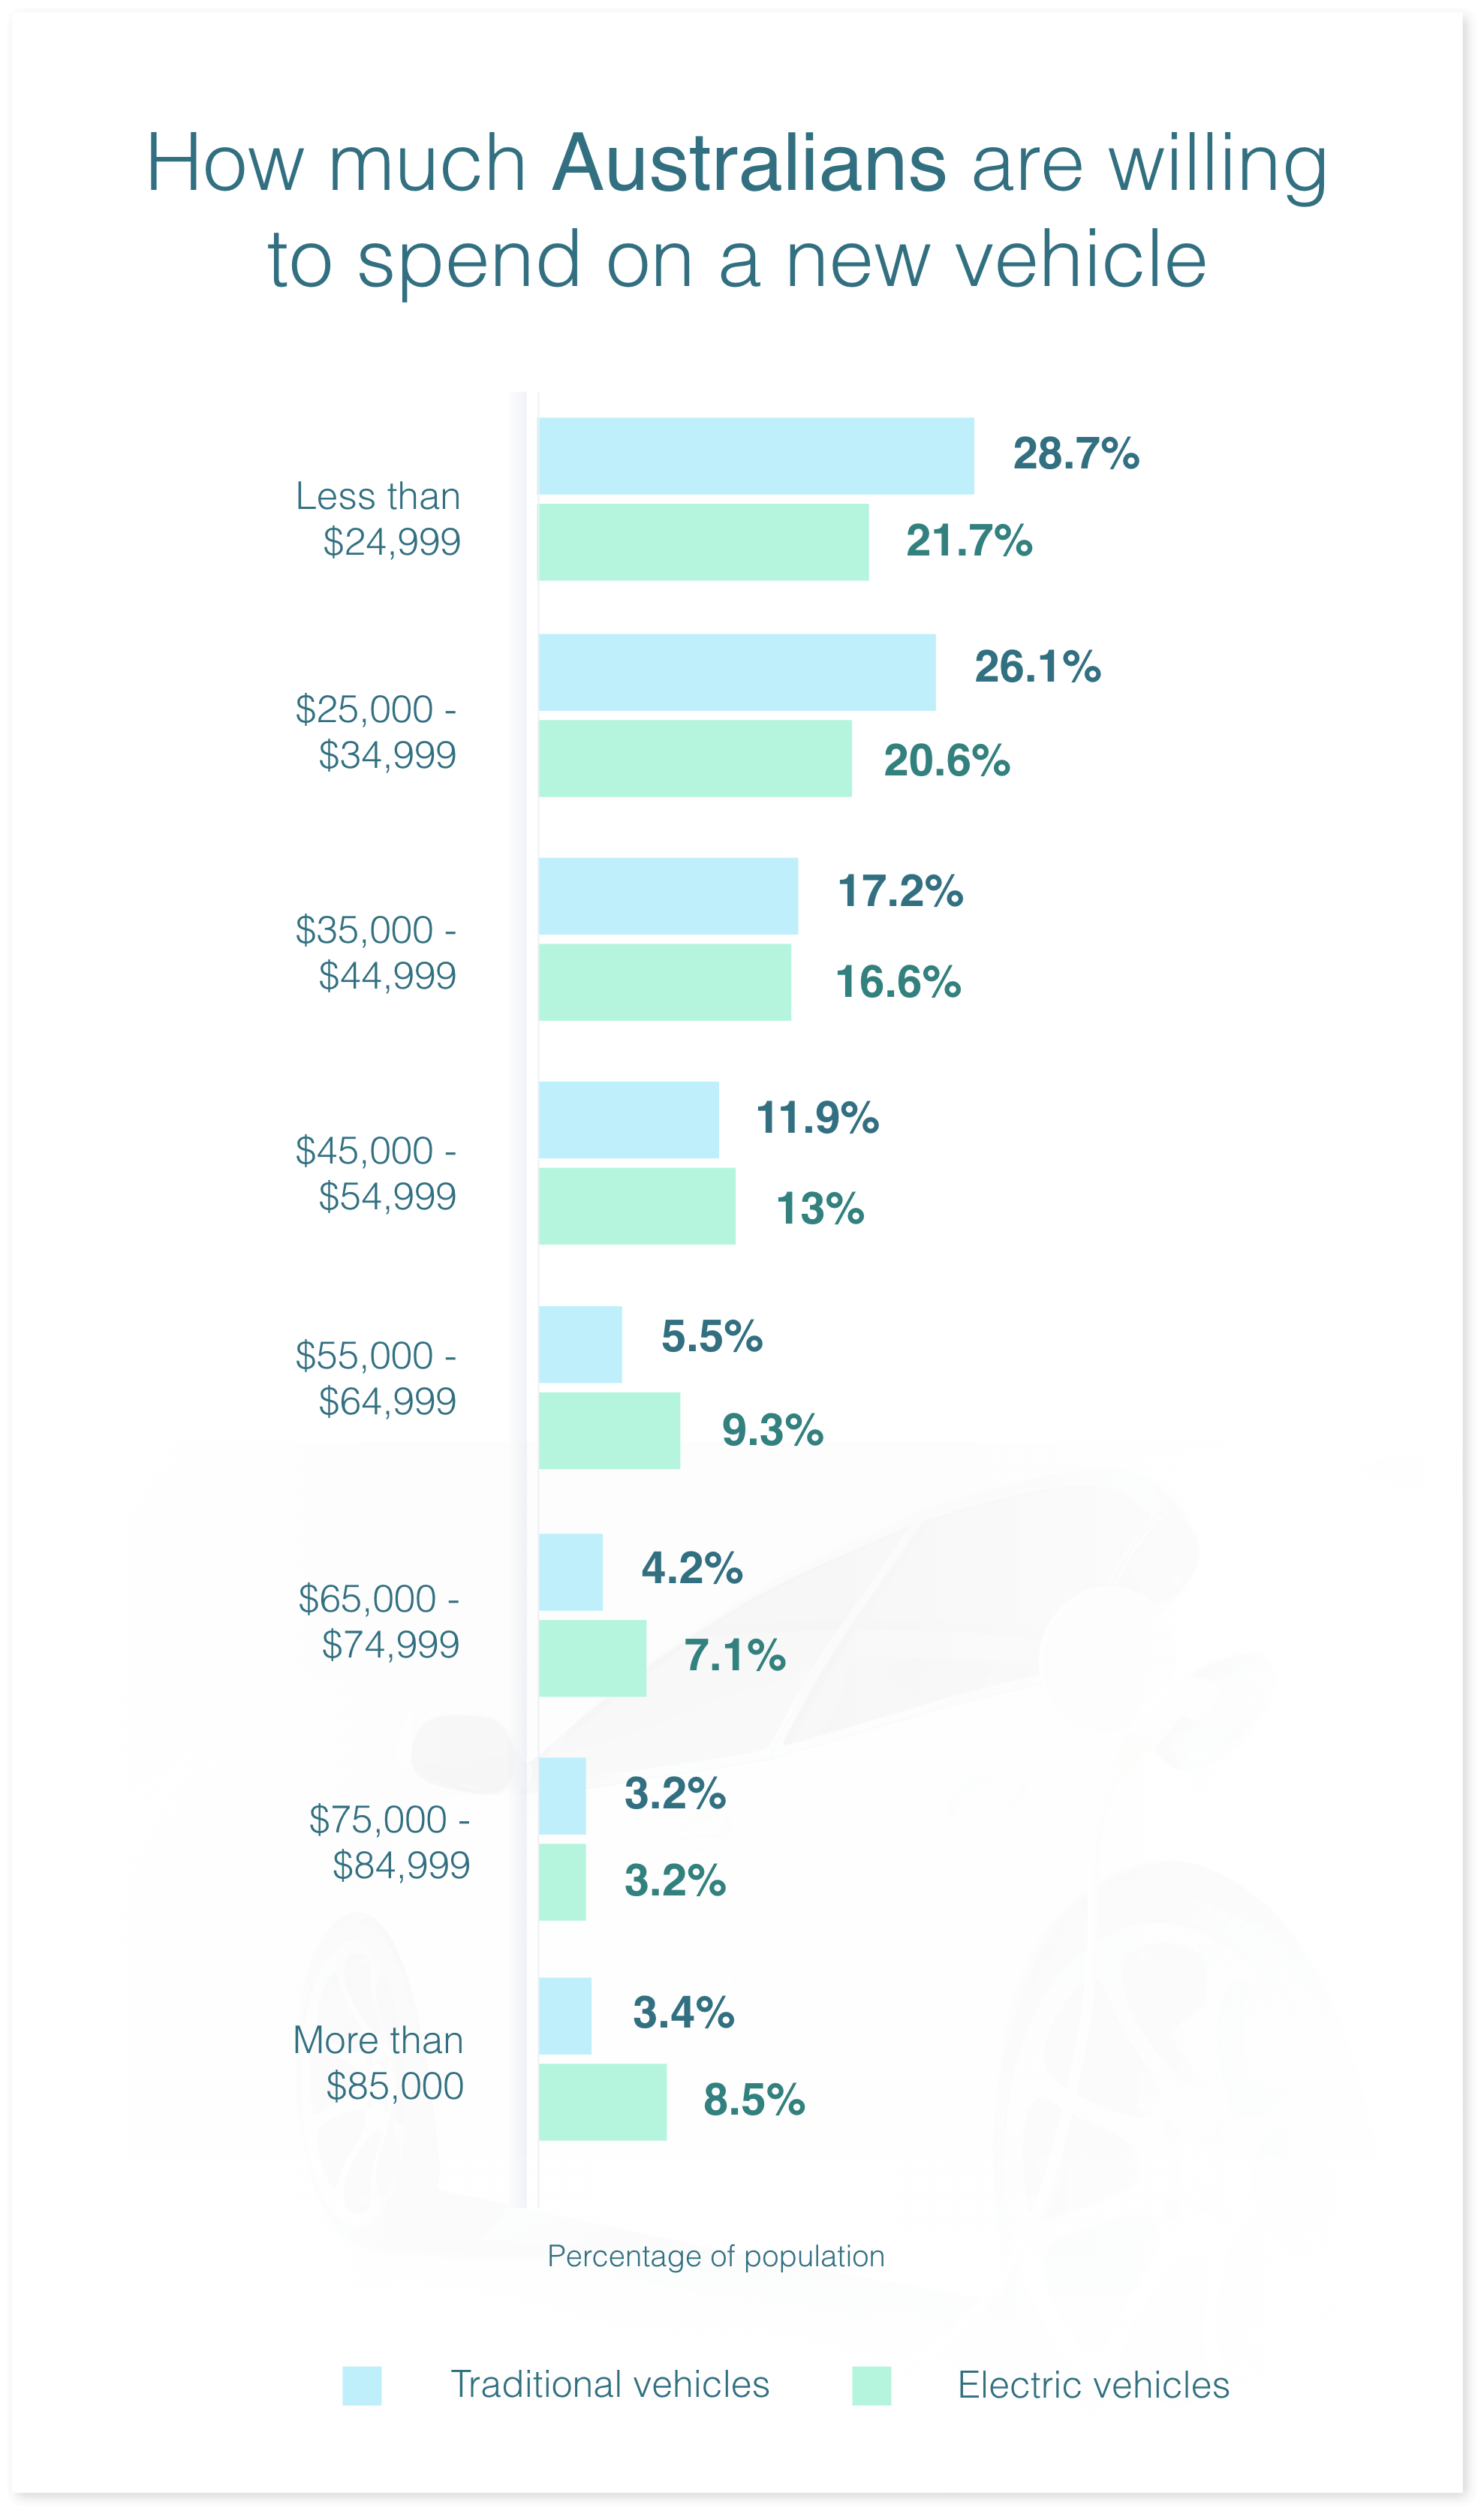
To find out, we asked the question for both EV and traditional cars. As it turns out, more people would be more willing to spend the big dollars on electric vehicles than they would their traditional counterparts. In other words, the majority of shoppers looking to spend less than AU$45,000 on a new car would opt for traditional, whereas those spending more would prefer electric.
If we consider the results from a lower financial threshold, just one in five Australians (21.7%) would spend $25,000 or less on a new EV, compared to more than a quarter (28.7%) that are open to spending the same amount on a petrol or diesel equivalent.
Despite people being open to spending more on an EV, the fact remains that they remain largely unaffordable for many with price the most prominent barrier to entry.
While EVs are typically more expensive than their traditional counterparts, there is some good news on the way for those looking to purchase one down under. Several newer models, such as the BYD Atto 3 and MG ZS EV were introduced in more recent times, which are considerably more budget-friendly for those concerned about purchase price.1
A number of government-supported initiatives, such as subsidies, are also in place across several states in Australia, which are designed to support those in the market for a new electric vehicle.2
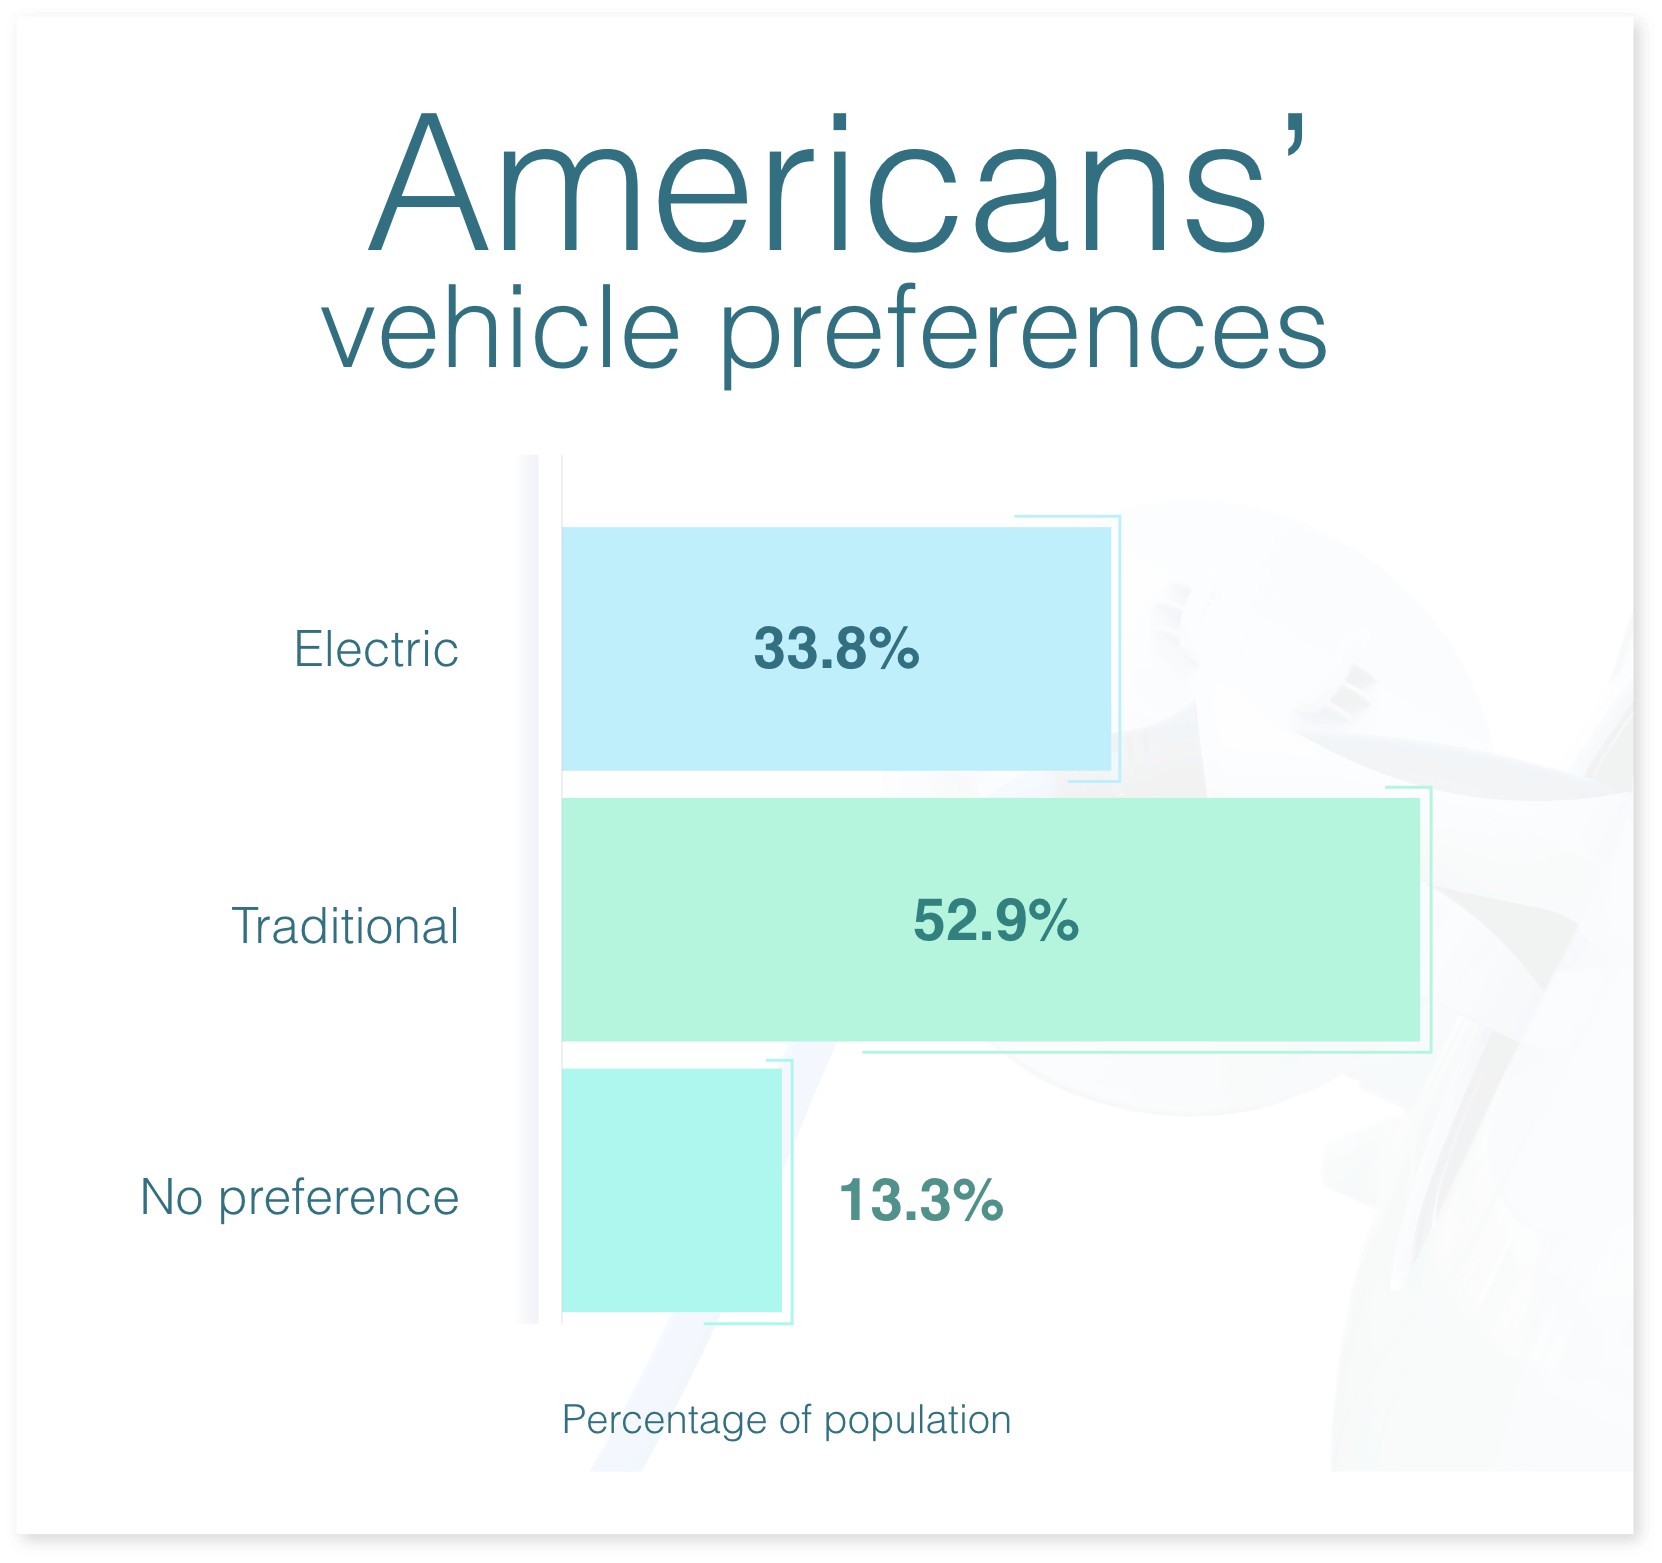
The first thing we asked America was whether they had a preference for traditional or electric vehicles (EVs). More specifically, if two identical vehicles were available in both a traditional or electric model at the same price, which one would they prefer?
More than half of Americans (53%) said they would prefer a traditional car, compared to just 34% that would opt for an electric vehicle. The remainder indicated no particular preference.
America’s results were the exact opposite to those in Australia and Canada. Despite this, there were similarities in the sense that once again, men were more open to driving electric cars than women.
As for those that would opt for an EV over a petrol or diesel vehicle, 18-24-year-olds were the age group most fond of the chargeable cars, as indicated by 43% of the demographic. On the other hand, as many as 70% of those aged 55-64 would prefer traditional.
When it comes to the key barriers to entry for Americans looking to go electric, the main issue is battery life and replacement costs (56.4% of population).
Other common reasons for people’s dissuasion include the availability of charging stations, initial purchase price, understanding of the technology, and the belief that EVs are not environmentally friendly.
Around 10% of respondents said that they saw no barriers to entry.
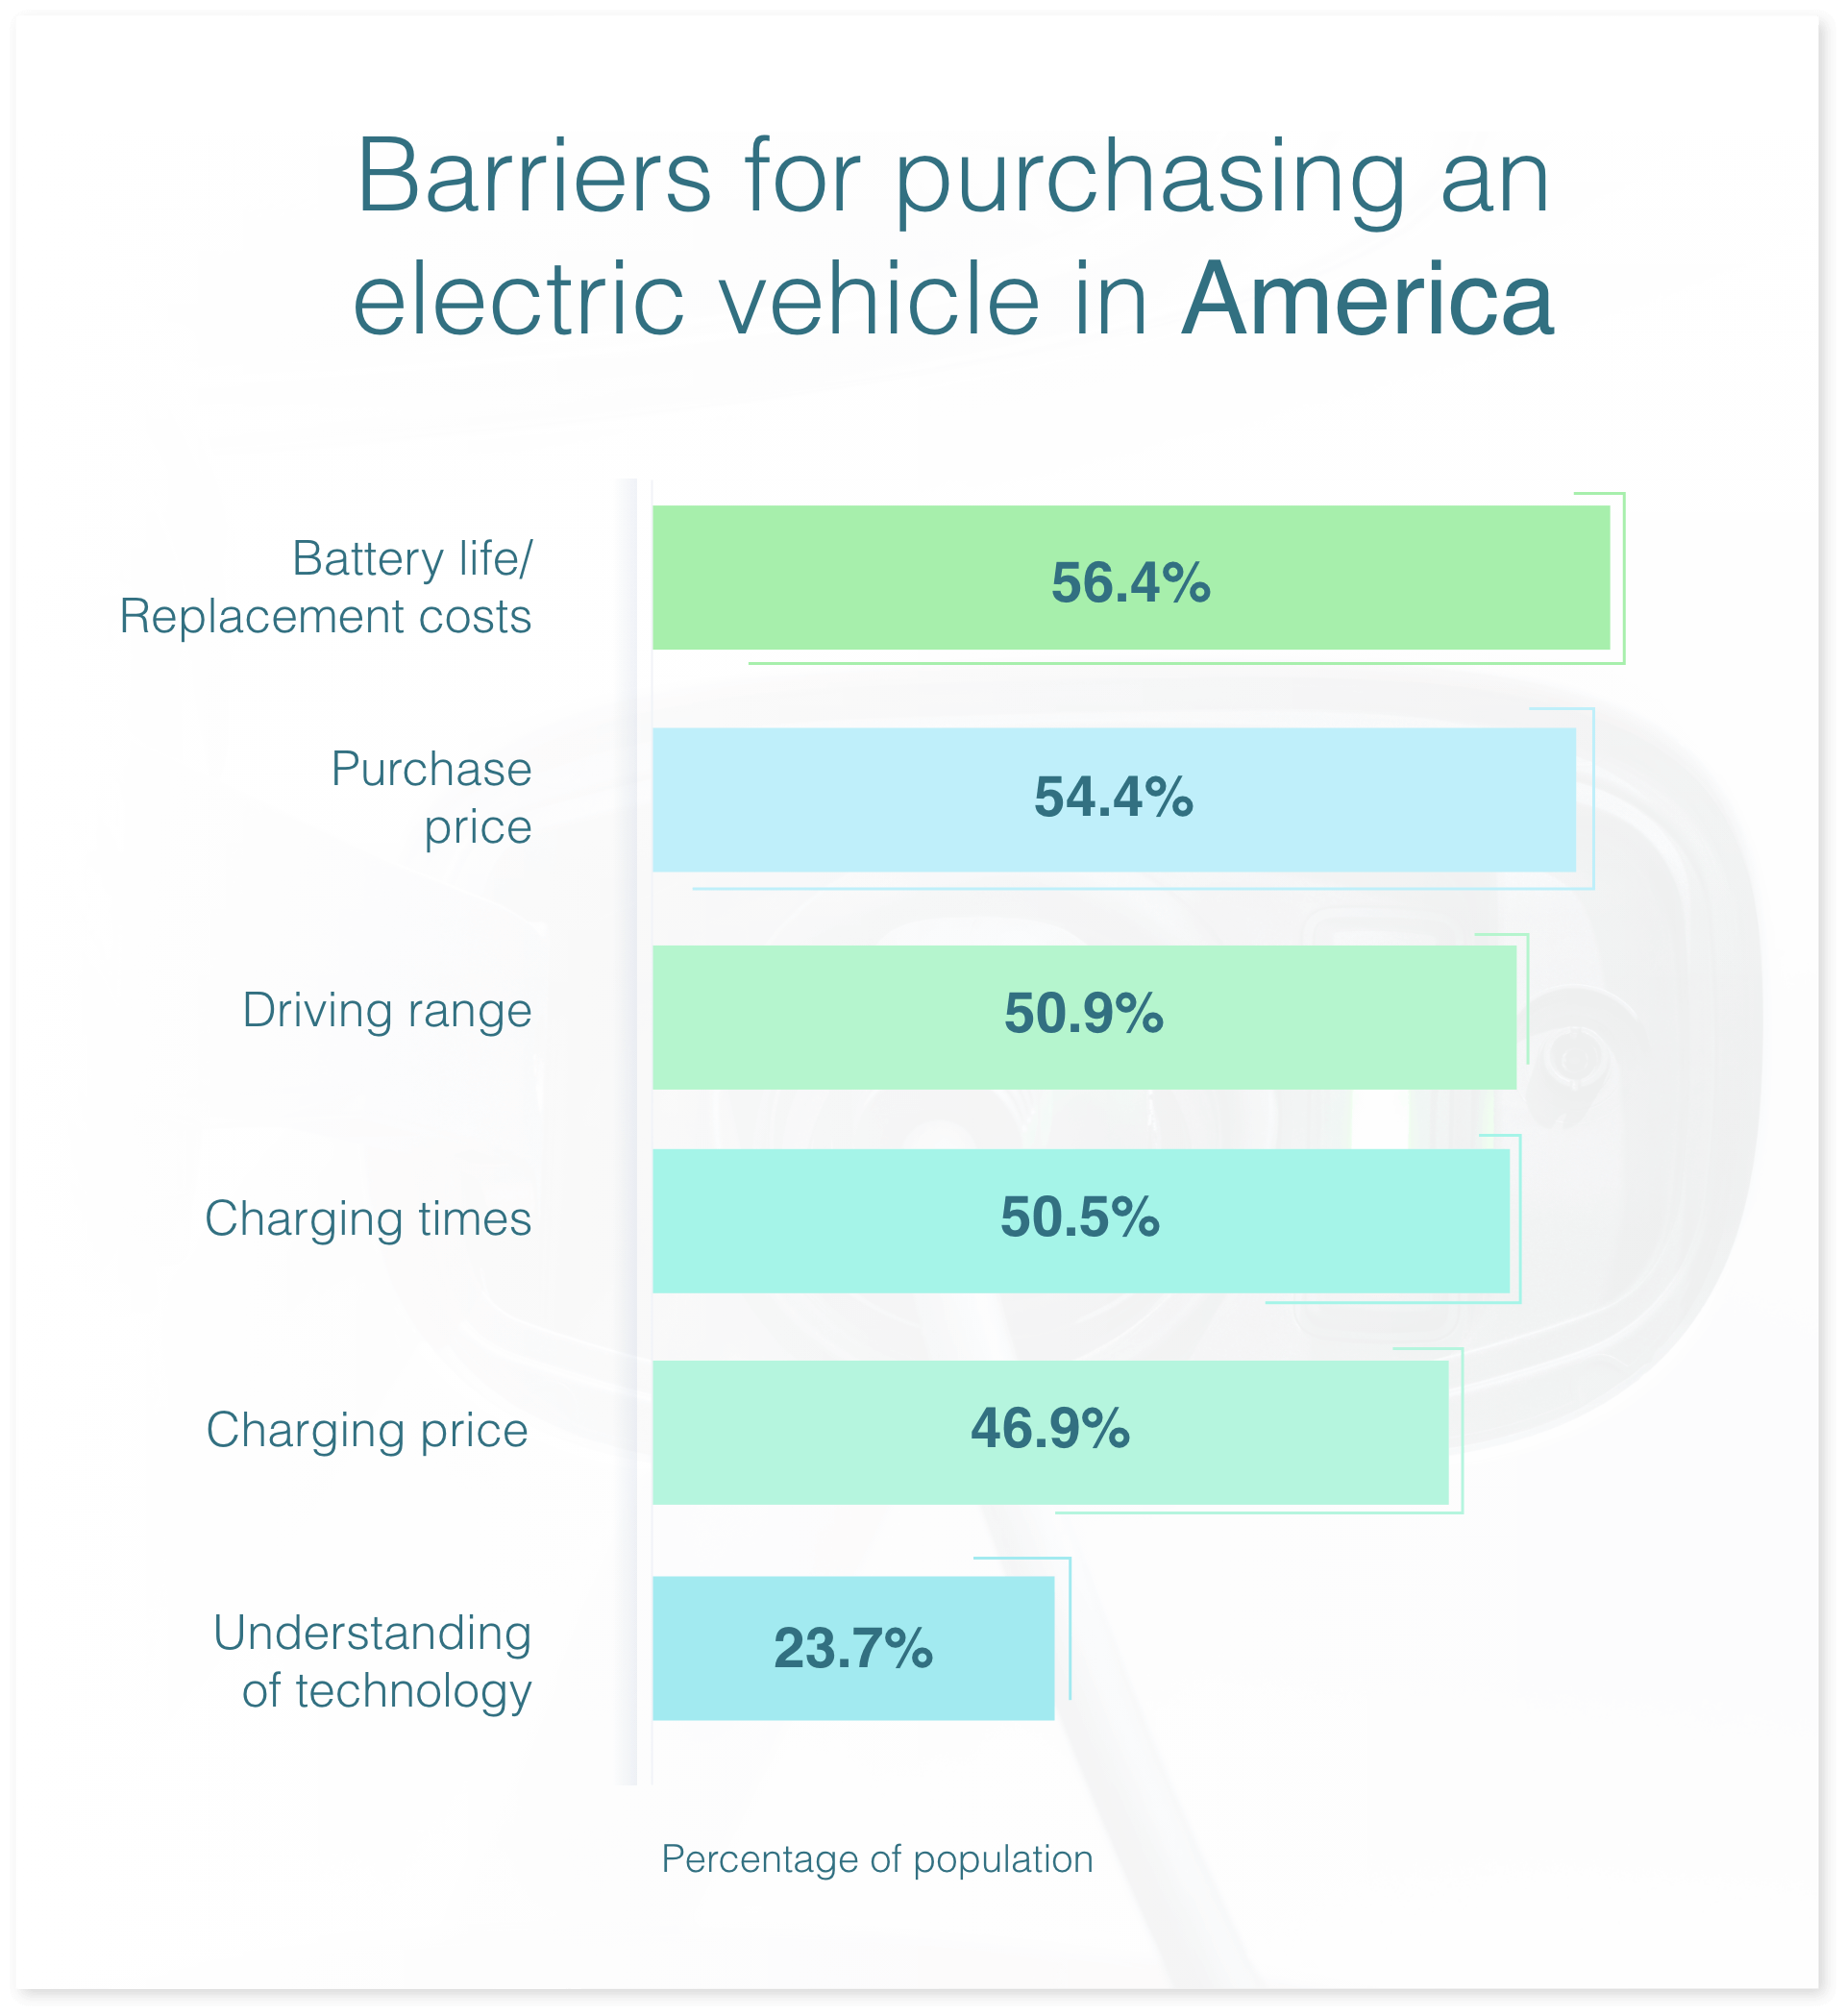
Interestingly, while the older generation (65+) was not the most likely to state ‘understanding of technology’ as a barrier, they were the most likely to state charging time and price, driving range of the car, and the cost to replace the battery, which may indicate that those in this age group do in fact have a lesser understanding of the technology than other age groups included in the study.
The data also revealed that not only were women more likely to preference traditional vehicles than men, but they were also more likely to face multiple barriers to purchase.
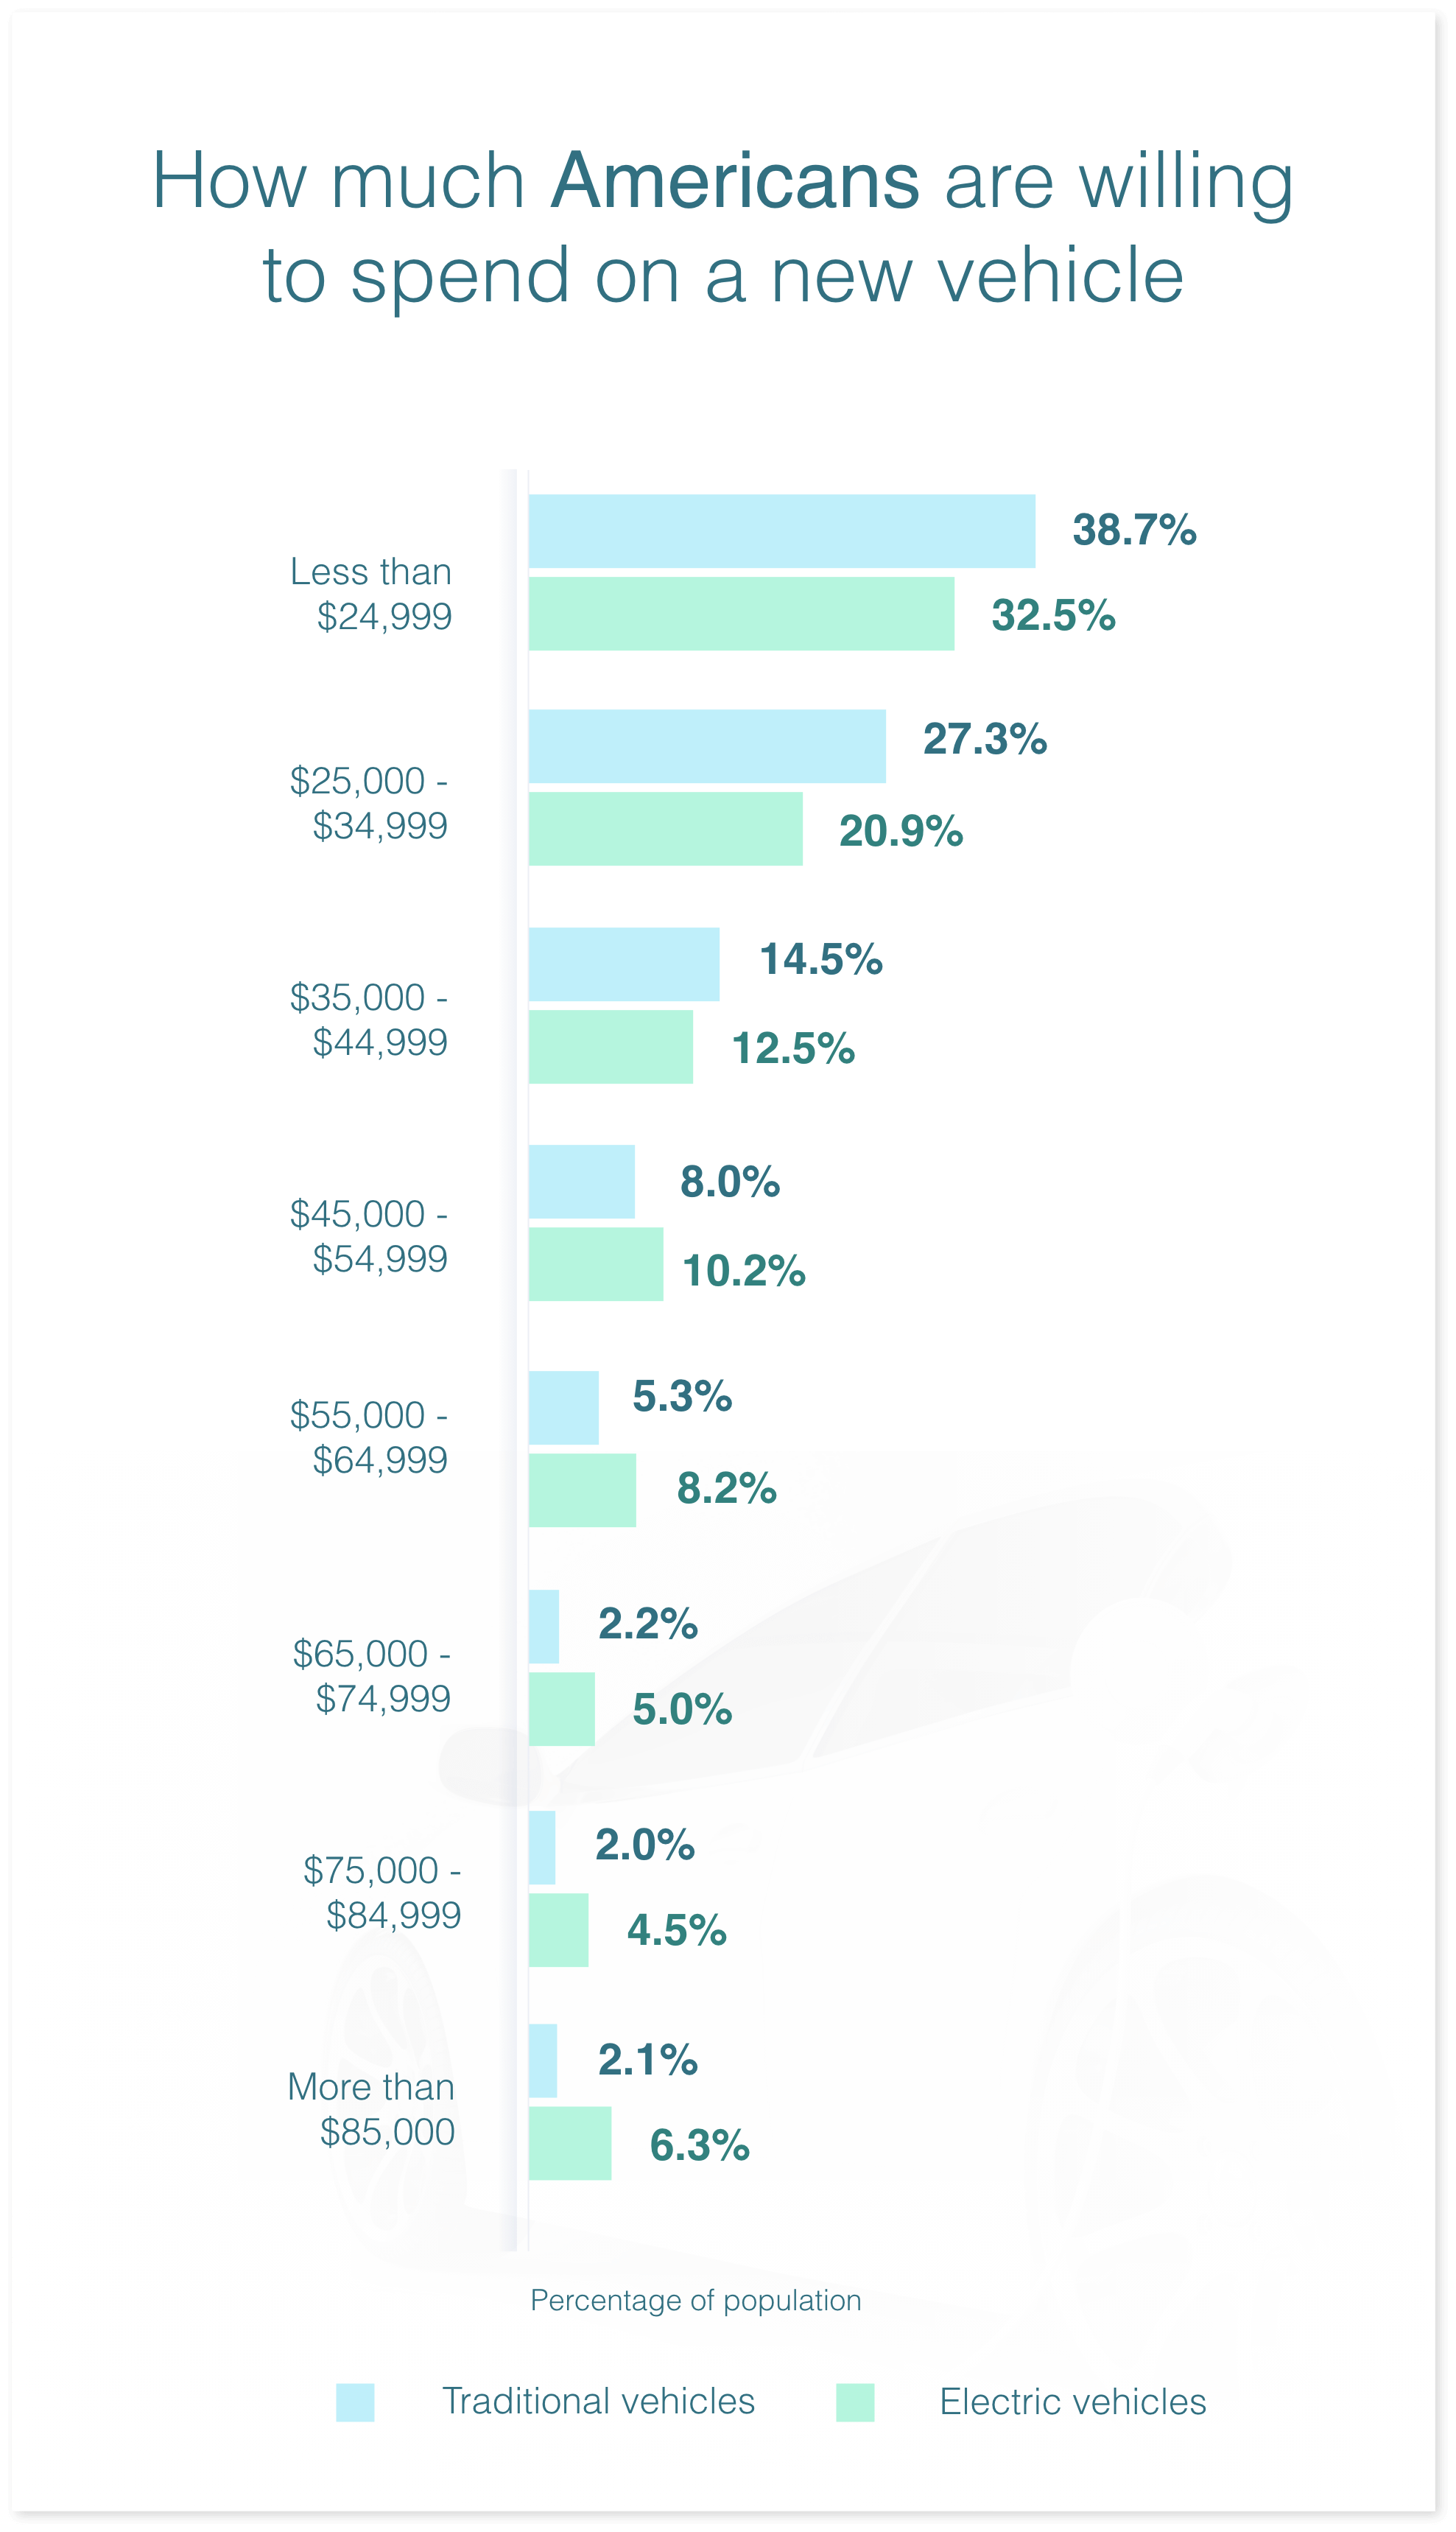
Actual figures aside, Americans would be more prepared to spend large on electric vehicles than traditional ones. In other words, the majority of shoppers looking to spend less than US$45,000 on a new car would opt for traditional, whereas those spending more would prefer electric.
At the very upper end of the scale, there are more than twice as many people that would spend more than $65,000 on an EV than those that would spend the same amount on a traditional vehicle.
Comparing the data from a lower financial threshold, just less than one third (32.5%) of Americans would spend a maximum of $25,000 on an EV, but nearly two in five (39%) would spend the same amount on a petrol/diesel car.
Despite people being open to spending more on an EV, the fact remains that they remain largely unaffordable for many with price one of the most prominent barriers to entry.
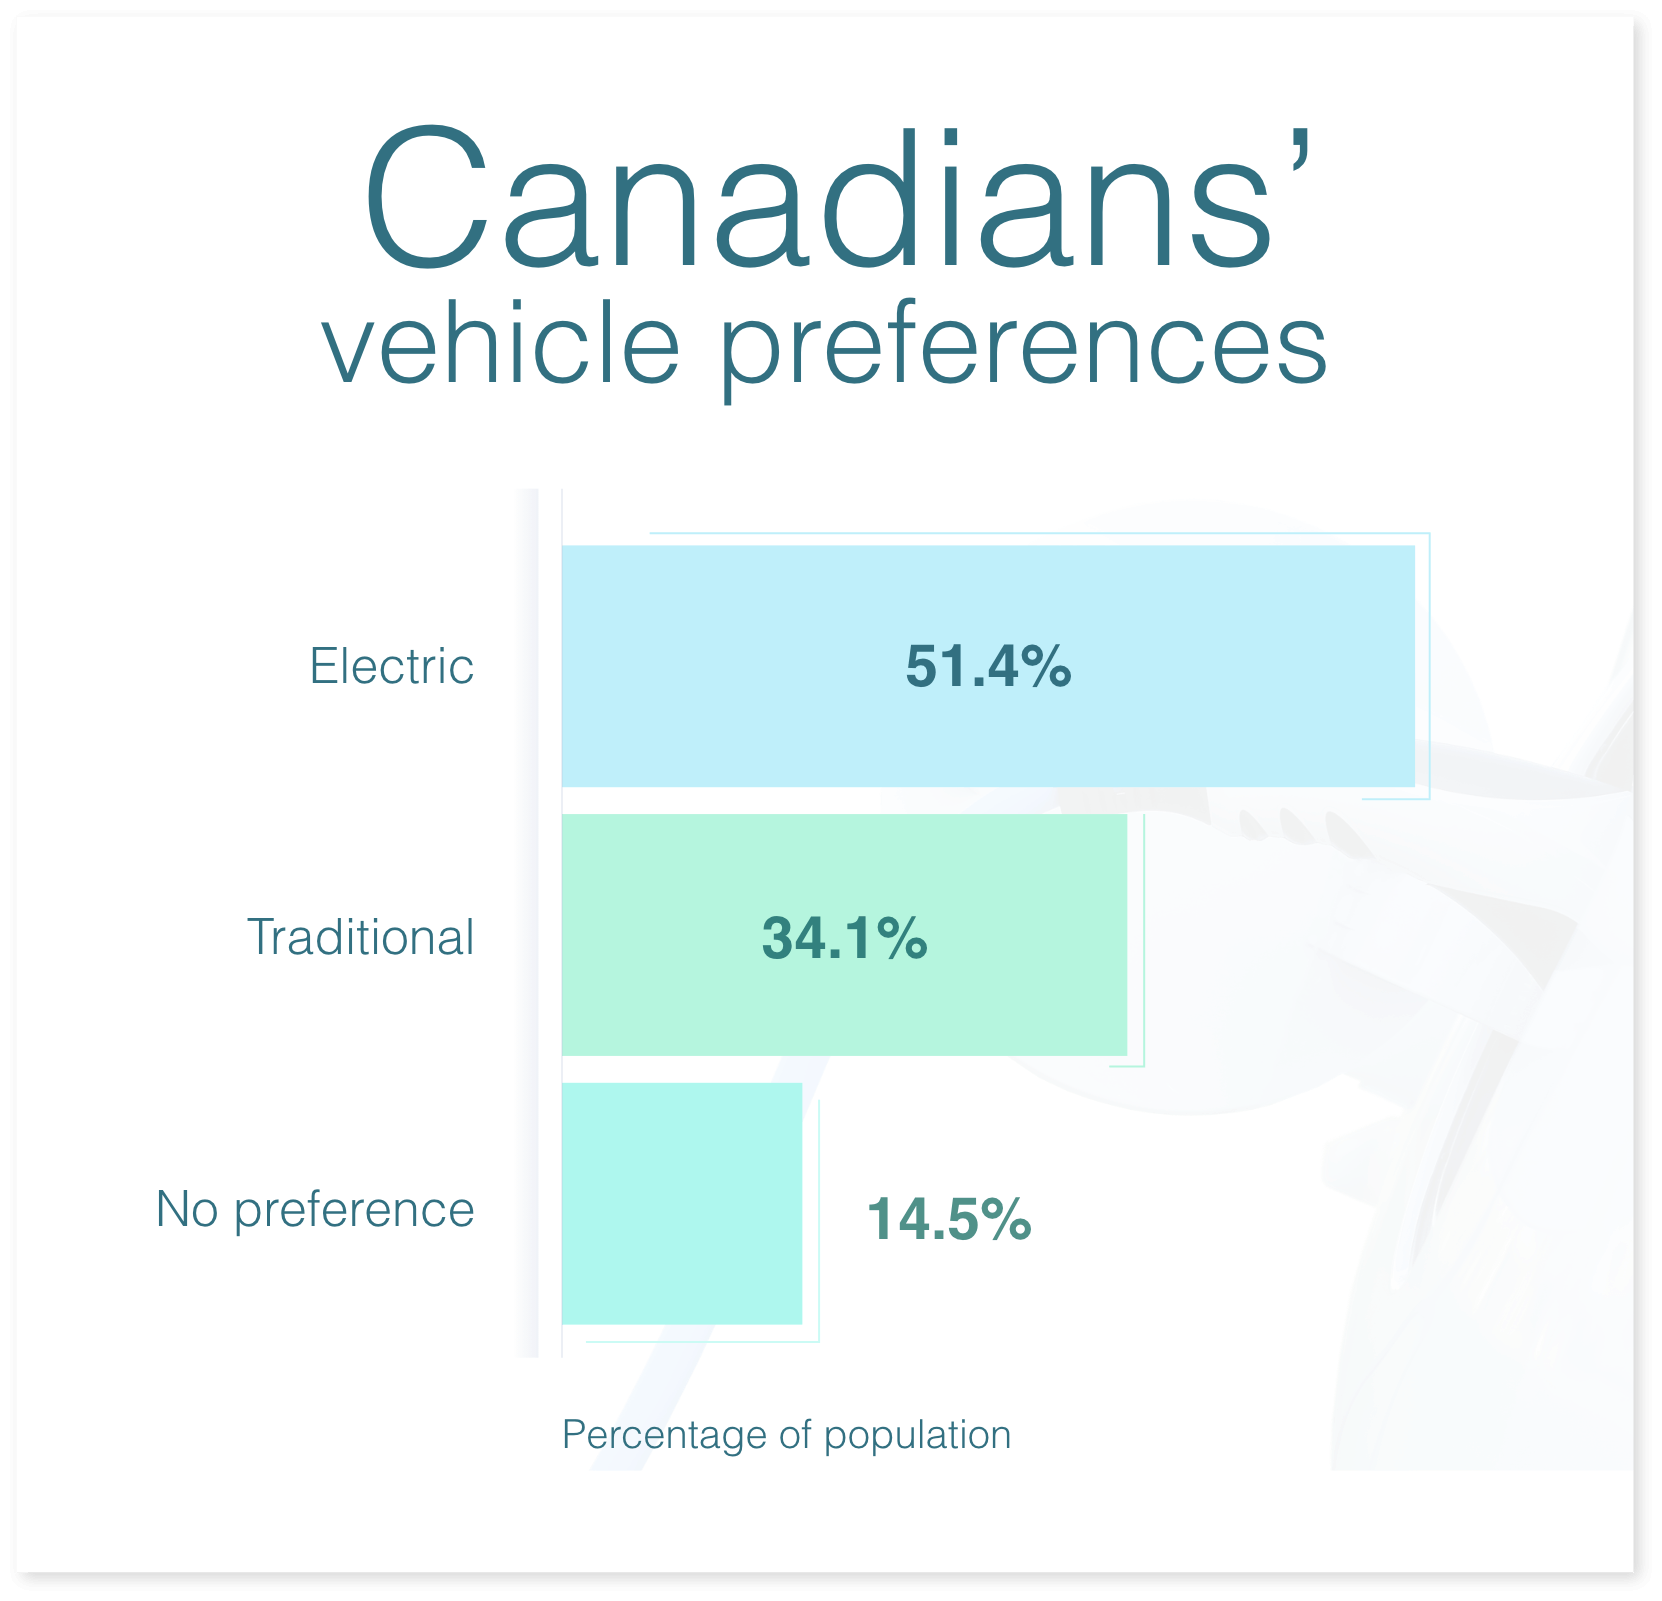
If two identical vehicles were presented at the same price, but one was electric and one was a traditional (petrol/diesel) vehicle, which one would Canadians prefer?
Half of Canada said they would prefer an electric car (51.4%), compared to just 34.1% that would opt for a traditional vehicle. The remainder indicated no particular preference.
Of those that favoured EVs, 25-34-year-olds were the fondest, as represented by 57% of the age group. Those aged 55-64 were the most likely generation to opt for traditional vehicles (40%). We also found that men were slightly more likely than women to prefer an EV, indicated by 55% of males compared to 48% of females.
There are a few factors that dissuade Canadians from wanting to go electric, the main reason being purchase price (60.5% of population). This was especially true for those aged 65 and older, where as many as 69% of the age group listed unaffordability as the biggest deterrent.
Another common roadblock was an understanding of the technology, driving range of the vehicles, their performance in cold or extreme weather, and the belief that they are not environmentally friendly.
Just 6.6% of respondents indicated that they saw no barriers when it came to the purchase of an EV.
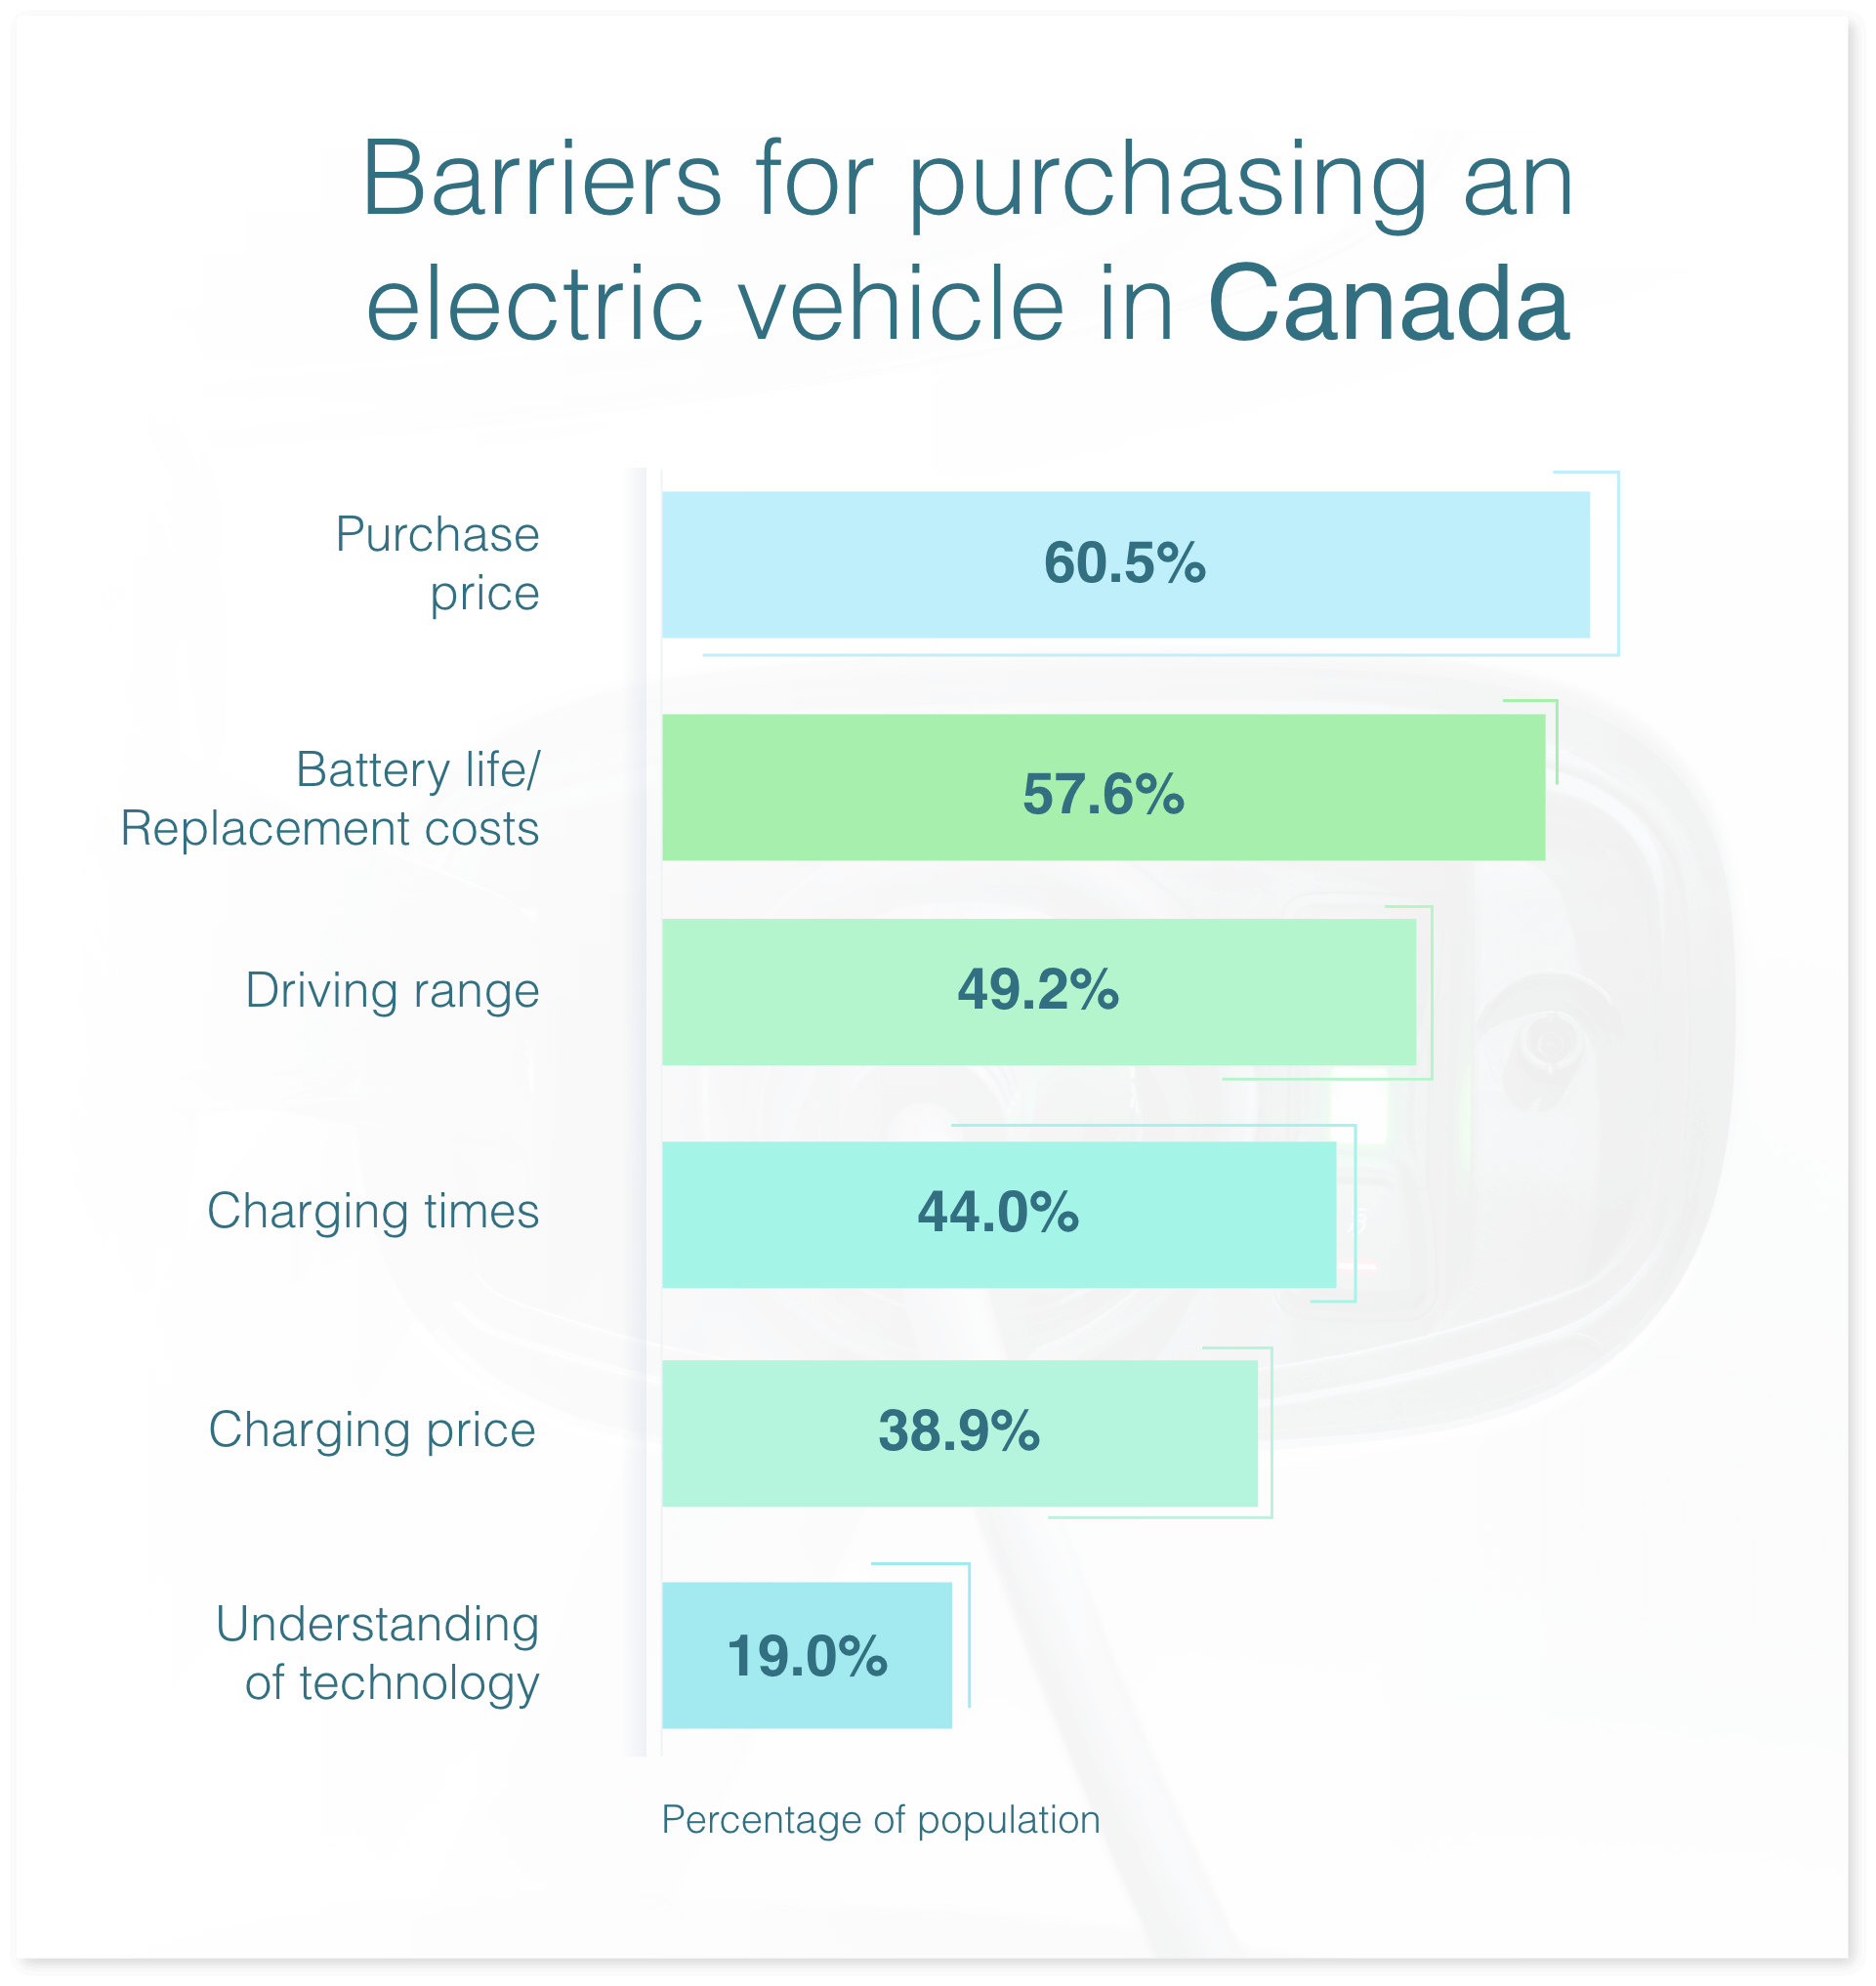
Interestingly, while the older generation (65+) was not the most likely to state ‘understanding of technology’ as a barrier, they were the most likely to indicate charging time, driving range of the car, and the cost of battery replacement, which may indicate that those in this age group do in fact have a lesser understanding of the technology than other age groups included in the study.
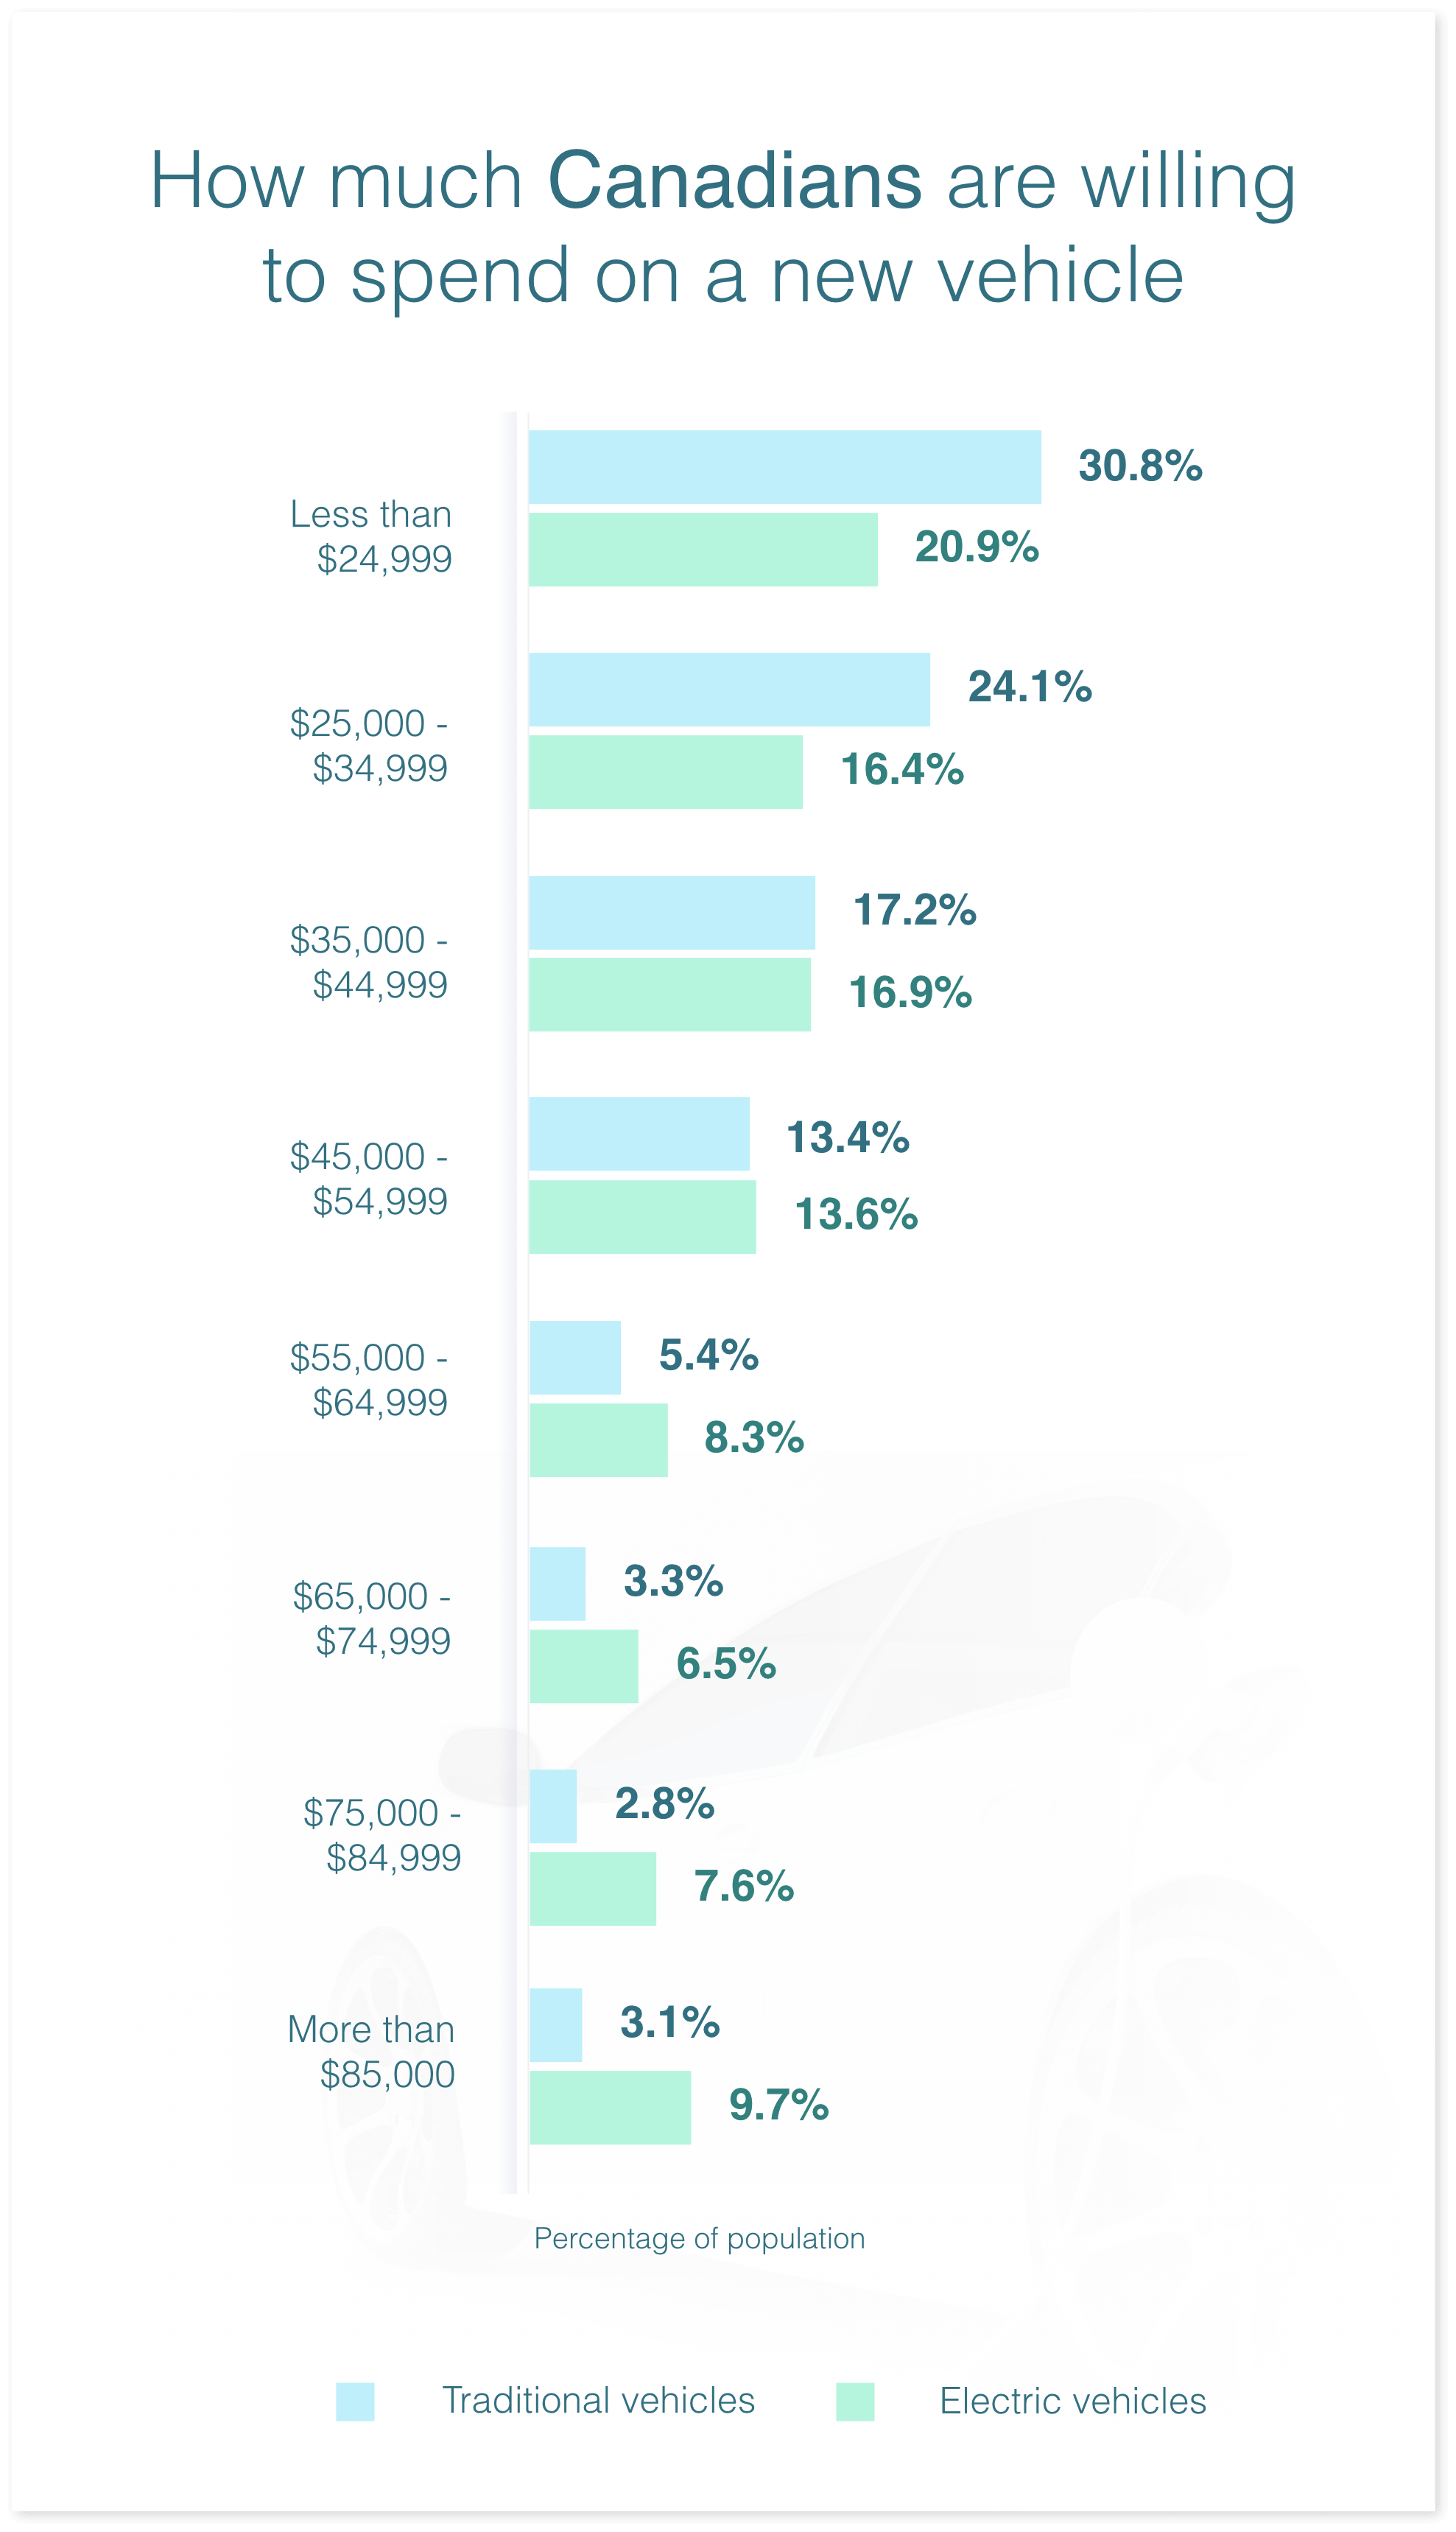
To understand the price people are willing to pay, we asked about their preferred price points for both types of vehicles. Much like Australians and Americans, Canadians would spend more money on an electric vehicle than a petrol or diesel equivalent. The majority of shoppers said they would spend less than CA$45,000 on a traditional car but would pay a higher price to go electric.
Canadians were most comfortable spending up to $25,000 on traditional vehicles. Where nearly one third (31%) of the nation would spend this amount on a petrol or diesel car, just one in five (21%) would spend the same amount on an EV.
Despite people being open to spending more on an EV, the fact remains that they remain largely unaffordable for many with price the most prominent barrier to entry.
Compare the Market’s General Manager of Car Insurance, Stephen Zeller, emphasised the importance of understanding your vehicle of choice before purchasing.
“If you are in the market for a new car, it’s imperative that you really understand what capabilities you need as a driver, and then compliment that with market research to ensure you find a car that best suits your needs,” Mr Zeller said.
“Things such as running costs, driving range and performance in different types of weather can vary quite dramatically between different vehicles.
“Among other factors, drivers should consider their average length of vehicle ownership to see if spending a higher amount on a car will be financially viable for them in the long run.”
If you’re in the market for a brand-new car or simply looking to upgrade your existing set of wheels, it’s a good idea to consider car insurance. Having a comprehensive policy in place means you could be better protected in the case of an accident or other unfortunate event. Compare your options with our free car comparison tool.
Compare the Market commissioned Pure Profile to survey 506 Australian, 1,006 American and 1,009 Canadian adults in March 2022.