The most popular car models across the world
Nov 20, 2022
Automobiles come in all different shapes and sizes, from the humble five-seat sedan to off-road beasts, soccer parent people movers, high-performance luxury supercars as well as the smart and zippy microcar.
Many people may have a dream car that they always wanted – perhaps an Italian sportscar that maybe once adorned posters on their childhood bedroom wall, or a tooled up four-wheel drive monster to take you and your friends/family on epic camping trips to the unknown – but are those the types of cars that people actually drive?
Compare the Market surveyed over 3,000 Australians, Canadians and Americans to find out what cars they’re really driving, how they bought them and other stats like annual mileage, vehicle age and insurance costs.
Here is what we found.

Toyotas and Hondas consistently common across Australia, Canada and the USA
Across all three nations surveyed, the Japanese motoring powerhouse that is Toyota was one of the most popular car brands. This is far from surprising as the brand is known for dependable, reliable cars that are fairly affordable, easy to service and have plenty of spare parts easily accessible.
Toyota was the most popular brand in Australia and America, as their cars models accounted for 19.2% of Australian motorists and 15.8% of Americans. Honda was the most popular brand in Canada, barely dislodging Toyota for the number one spot with 12.3% of respondents compared to 11.6% of Canadian car owners surveyed.
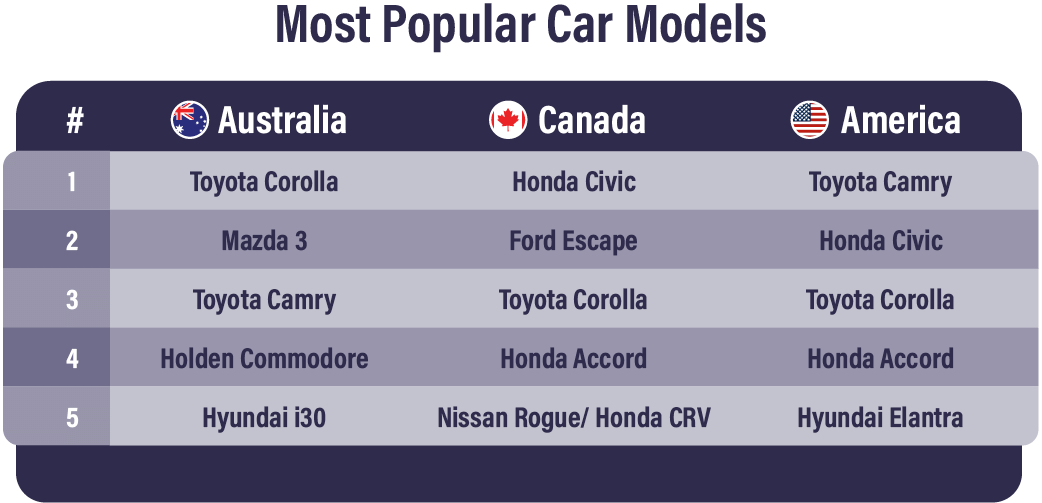
When it comes to the most common car models, the Toyota Corolla was in the top five most popular car models across all three nations. The Toyota Camry was also in the top five listed by survey respondents in Australia and the USA, but not in Canada.
Other popular models included the Honda Civic and Honda Accord. . Honda Civics and Accords joined the humble Camry and Corolla amongst the top five most popular car models in Canada and the USA, but this trend did not continue in Australia.
The top five most common car models for each country are listed in the table below.
How your choice of car model affects your car insurance premiums
There are a wide variety of factors that influence how much a car insurance policy could cost, and the specific make and model is one of them. General Manager of General Insurance, Adrian Taylor, explains.
“Insurance companies look at whether a particular make and model is showing up a little too frequently in crash statistics when determining what to charge for any given policy. They also consider the car’s safety rating, cost to service and whether it’s easy to source spare parts,” says Taylor.
“The age of the car has a massive impact as this influences its market value, which is typically what you’ll get paid up to in an insured event. How far you drive can also be a factor as the more time you spend on the road, the higher the risk something will go wrong.”
Both American and Australian car owners reported that their cars were nine years old on average (rounding up). Canadians, on the other hand, are driving cars that are around seven years old.
However, a big factor behind car insurance prices is who is driving the car, as Taylor states.
“Insurance companies also take the risks associated with the particular driver into account. They do this by taking the driver’s age, gender, driving history and other information and compare the data with crash and claim statistics.”
When surveying car owners, Compare the Market discovered that Americans had the most expensive car insurance bills, paying an average of US$1,601 per year (AU$2,545). Canadians paid the second highest, with insurance bills costing an average of US$1,207 (AU$1,902) per year. In contrast, Australian survey respondents pay much less, only spending US$604 (AU$958) on average to insure their cars.
Americans drive further per year than Australians and Canadians
American car owners drive an average of 13,691 miles per year (22,033 kilometres) whereas Australian drivers clock up an average of 11,871 miles (19,105 kilometres). Canadians drive a little less, managing 10,507 miles per year (16,909 kilometres).
Interestingly, the younger generations drive much further than older car owners across all three countries. In Australia, 25-34-year-olds were running their odometers up the most, clocking 22,164 miles per year (35,670 kilometres) on average. In Canada it was 18-24-year-olds who ate up the miles, driving 14,534 miles per year (23,390 kilometres).
While the younger age groups among American survey respondents also drove higher distances than older survey respondents, it was actually car owners aged 35-44 who drive the most, cruising an average of 18,921 miles per year (30,450 kilometres).
Australians less likely to purchase their car with a loan than Americans and Canadians
When asked how they acquired their vehicle, it became clear that Australians were not in favour of using a car loan, especially when compared to Americans and Canadians.
Over 70% of Australians used cash or savings to purchase a car, while that number was much lower in the other nations surveyed. Just 50.6% of Canadians and 46.8% of Americans used their own money, with a higher proportion of survey respondents from both countries using loans to purchase their vehicles.
| Nation | % Who used cash/savings | % Who took out a loan | % Who received the car as a gift |
| Australia | 71.4% | 24.3% | 4.3% |
| Canada | 50.6% | 45.1% | 4.3% |
| USA | 46.8% | 46.1% | 7.1% |
There was almost a 50-50 split between car owners who bought new and those who bought second-hand. Americans were the most likely to purchase second-hand, and Canadians were the least likely to buy second-hand automobiles.
Furthermore, both American and Australian car owners reported that their cars were nine years old on average (rounding up). Canadians, on the other hand, are driving cars that are around seven years old.
| Nation | % Who bought brand new | % Who bought second-hand |
| Australia | 55.6% | 44.4% |
| Canada | 56.6% | 43.4% |
| USA | 52.3% | 47.7% |
Compare the Market commissioned Pure Profile to survey 1,007 Australian, 1,000 Canadian and 1,003 American Adults in September 2022.
When determining the average spend for various categories, we removed any major outliers from the results and rounded to the nearest dollar.
Currencies were converted using Google’s currency exchange tool on 11/10/2022.
Brought to you by Compare the Market: Making it easier for Australians to compare car insurance.