The Burrow
Sep 1, 2025
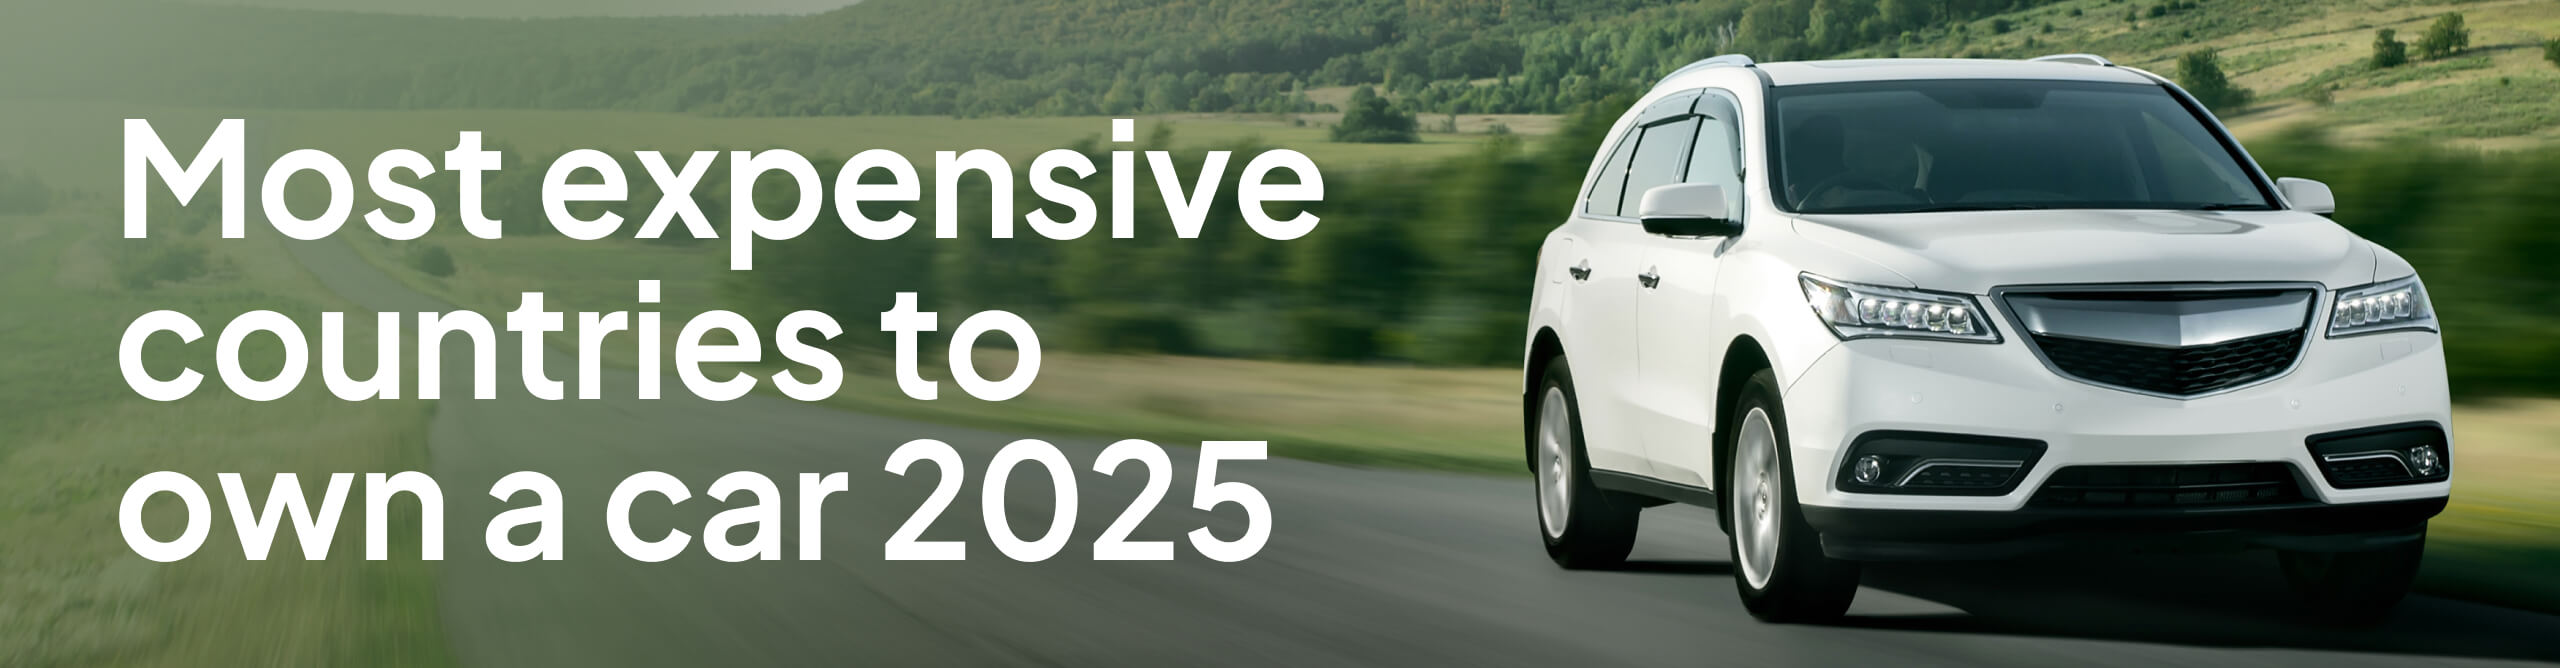
Cars are an essential mode of transport for many people across the world, but as the cost of living increases worldwide, so too does the cost of owning and running a car.
Cars don’t just cost money to buy and fuel up, but to repair, service and insure – not to mention the cost of taxes and licences, or the cost of depreciation of the vehicle.
As car insurance comparison experts, we’ve analysed the cost of car ownership data in 26 countries to find the most expensive to own a car, and which are the cheapest. Overall, European countries were the most expensive, while South American nations were generally more affordable.
Buckle up and see how your country performs in the results below.

The country ranked as the most expensive for car ownership this year is Denmark – no wonder so many of them ride bicycles to get around!1 The Danes who drive have an average annual cost of AUD$12,476 to run a car, and an average fuel cost of $3.59 per litre, both of which were the most expensive of all 26 countries analysed.
In the past year, every cost that made up the analysis increased to some degree, with the average amount spent on fuel increasing by $356 to a total of $5,218 per year.
Ranked second-most expensive on the index was the Netherlands. The average annual running cost was AUD$8,474, which wasn’t the most expensive running cost overall, but still fairly high in comparison to other countries. Our index also ranked countries based on the cost of fuel and licensing, and the Netherlands had the second-most expensive fuel price and the most expensive cost of licensing, contributing to its rank as the second-most expensive nation in the index.
The biggest increases in costs since 2024 were for annual average fuel spending, which rose $253, followed by depreciation with a $184 increase, and a $137 increase to car insurance costs.
Taking third in the unenviable podium for most expensive countries for car ownership is Norway – the second Scandinavian country after Denmark. Norway had the third-highest annual running cost of AUD$9,856, the fourth-highest average fuel price at $3.16 per litre, and one of the highest licensing cost at $246.
As with the Netherlands and Denmark, fuel was the cost that had the biggest increase since 2024, with the average amount Norwegians spent on fuel in 2025 rising $133.

The cheapest country for owning and running a car is Argentina, and when you take a look at the stats, it’s easy to see why. Argentina had the lowest annual average spend of AUD$1,545, thanks to having the lowest costs in seven different metrics, and very low expenses in the other categories. For example, Argentina had the lowest average car insurance cost at $238 a year, the cheapest annual spend on fuel at just $526 a year, plus the cheapest average parking spend per year at $73.
However, even an affordable country with low car ownership costs can’t escape the rising cost of living, with every single metric increasing to some extent compared to the year before.
The second cheapest nation for motorist is Russia, where Russians spend an average of AUD$4,636 per year overall. Like Argentina, Russia had very low expenses in most categories, including the second-cheapest average spend on tolls at $48 a year per motorist. Russian licensing fees were also very low, and the nation had the second-cheapest price for fuel at an average $1.20 per litre, largely thanks to the nation’s deep oil reserves.2
Despite such a low price at the bowser, the price has increased over the past year, which has led to a notable rise of $273 in annual fuel spending.
Several South American countries vied for the third-lowest ranking in the index, but Colombia outperformed Chile and Guatemala, with an average annual spend on motoring costs of AUD$5,307. Colombia had the fourth-cheapest fuel price at $1.58 per litre, and the second-cheapest licensing cost of $31, which helped the country rank third-cheapest – despite having the highest average annual spend on parking this year at $437.
Prices increased in almost all areas, with average yearly fuel spending rising $149 and average maintenance costs increasing by $117, although other costs such as insurance, inspection fees and taxes had some of the lowest increases among the 26 nations.
The table below contains the figures and results for 2025.
| Rank | Country | Depreciation | Insurance | Inspection costs | Car tax | Maintenance cost | Fuel spend | Parking | Tolls | Washing spend | Fuel $ per litre | Licensing costs | Index score |
| 1 | Denmark | $3,249 | $1,217 | $224 | $646 | $5,218 | $1,430 | $222 | $122 | $149 | $3.59 | $288 | 9.62 |
| 2 | Netherlands | $1,876 | $1,242 | $329 | $1,008 | $2,621 | $925 | $263 | $106 | $104 | $3.40 | $334 | 8.54 |
| 3 | Norway | $2,916 | $1,443 | $421 | $372 | $2,531 | $990 | $340 | $662 | $181 | $3.16 | $246 | 7.80 |
| 4 | Finland | $2,728 | $1,314 | $138 | $646 | $3,188 | $1,128 | $272 | $38 | $202 | $3.20 | $249 | 7.77 |
| 5 | Ireland | $2,298 | $1,820 | $145 | $598 | $3,820 | $1,301 | $311 | $337 | $159 | $3.01 | $233 | 7.72 |
| 6 | Germany | $2,982 | $1,334 | $435 | $392 | $3,115 | $986 | $260 | $77 | $175 | $3.04 | $250 | 7.61 |
| 7 | Sweden | $2,544 | $1,146 | $93 | $405 | $3,231 | $1,113 | $428 | $131 | $226 | $2.65 | $227 | 6.66 |
| 8 | UK | $2,467 | $1,591 | $227 | $381 | $3,133 | $1,153 | $276 | $54 | $143 | $2.77 | $179 | 6.43 |
| 9 | Greece | $1,675 | $662 | $102 | $449 | $2,843 | $814 | $150 | $281 | $136 | $3.11 | $193 | 6.32 |
| 10 | Portugal | $2,259 | $639 | $64 | $209 | $2,254 | $711 | $193 | $397 | $81 | $3.07 | $175 | 6.00 |
| 11 | Spain | $2,749 | $972 | $90 | $229 | $2,837 | $927 | $394 | $183 | $106 | $2.66 | $168 | 5.91 |
| 12 | Canada | $2,128 | $2,078 | $149 | $165 | $3,038 | $1,287 | $337 | $95 | $136 | $1.86 | $180 | 5.28 |
| 13 | Uruguay | $677 | $993 | $98 | $578 | $2,452 | $832 | $261 | $218 | $136 | $2.99 | $112 | 5.09 |
| 14 | France | $2,497 | $1,219 | $134 | $141 | $2,357 | $954 | $297 | $267 | $91 | $3.03 | $54 | 5.07 |
| 15 | Australia | $1,960 | $1,223 | $236 | $401 | $2,769 | $1,033 | $209 | $229 | $145 | $1.61 | $220 | 4.99 |
| 16 | Ecuador | $1,924 | $795 | $227 | $379 | $2,212 | $888 | $328 | $245 | $208 | $1.02 | $308 | 4.80 |
| 17 | Czechia | $2,221 | $814 | $138 | $64 | $3,523 | $1,147 | $150 | $145 | $131 | $2.45 | $50 | 4.39 |
| 18 | Poland | $1,622 | $752 | $156 | $50 | $2,814 | $775 | $156 | $132 | $140 | $2.40 | $105 | 4.34 |
| 19 | Romania | $1,462 | $562 | $127 | $138 | $2,553 | $909 | $158 | $136 | $190 | $2.55 | $80 | 4.20 |
| 20 | Hungary | $1,278 | $385 | $204 | $141 | $2,488 | $752 | $166 | $163 | $111 | $2.61 | $70 | 3.99 |
| 21 | USA | $2,526 | $1,711 | $166 | $276 | $2,485 | $1,079 | $317 | $233 | $186 | $1.45 | $72 | 3.51 |
| 22 | Guatemala | $1,391 | $827 | $258 | $152 | $2,239 | $1,067 | $403 | $224 | $190 | $1.64 | $75 | 3.10 |
| 23 | Chile | $1,547 | $435 | $91 | $265 | $2,060 | $587 | $329 | $517 | $143 | $2.07 | $4 | 2.71 |
| 24 | Colombia | $1,262 | $507 | $120 | $399 | $1,359 | $729 | $437 | $317 | $179 | $1.58 | $31 | 2.13 |
| 25 | Russia | $1,162 | $378 | $104 | $106 | $1,905 | $671 | $122 | $48 | $141 | $1.20 | $40 | 1.54 |
| 26 | Argentina | $388 | $238 | $29 | $82 | $526 | $125 | $73 | $57 | $25 | $1.77 | $34 | 1.28 |
This is not an exhaustive list of nations as not every country was included due to limits in data. All costs are in AUD. Additionally, with the exception of fuel price per litre and licensing costs, all prices represent an annual average spend in that category.
The table below showcases the difference in cost for average annual expenses from 2024 to 2025 in AUD. This covers nine of the categories above, but excludes the difference in fuel price per litre and licensing costs. It is organised from countries with the biggest increases down to countries with decreases.
| Country | 2024 total cost | 2025 total cost | Difference |
| UK | $8,509 | $9,405 | $896 |
| Denmark | $11,591 | $12,451 | $860 |
| Netherlands | $7,641 | $8,457 | $816 |
| Ireland | $9,981 | $10,768 | $788 |
| Sweden | $8,574 | $9,296 | $723 |
| Finland | $8,955 | $9,634 | $679 |
| France | $7,268 | $7,942 | $674 |
| Germany | $9,084 | $9,736 | $651 |
| Russia | $3,977 | $4,627 | $650 |
| Poland | $5,969 | $6,583 | $614 |
| Argentina | $930 | $1,542 | $612 |
| Spain | $7,860 | $8,469 | $609 |
| Czechia | $7,754 | $8,317 | $564 |
| Colombia | $4,758 | $5,297 | $538 |
| Romania | $5,693 | $6,222 | $529 |
| Greece | $6,576 | $7,099 | $523 |
| Portugal | $6,320 | $6,794 | $474 |
| Norway | $9,365 | $9,836 | $470 |
| Ecuador | $6,751 | $7,192 | $441 |
| Hungary | $5,317 | $5,677 | $360 |
| Guatemala | $6,458 | $6,737 | $278 |
| USA | $8,760 | $8,961 | $201 |
| Chile | $5,763 | $5,963 | $200 |
| Australia | $8,038 | $8,205 | $167 |
| Canada | $9,410 | $9,393 | -$17 |
| Uruguay | $6,600 | $6,235 | -$365 |
Australia ranked 15th place out of 26, positioned below the halfway point – not quite ranking as well as Ecuador, Czechia and Poland, but performing better than France, Uruguay, Canada and Spain. The average annual total for yearly car spending was $8,205. While Australia’s fuel price was cheaper per litre than many European countries, licensing fees were some of the most expensive in the entire index.
Major expenses such as maintenance, repairs and fuel spending made up a significant portion of total spending, with fuel costing an average of $2,769 per year while repairs and maintenance cost an average of $1,033. Car insurance was another expensive cost at an average of $1,223 per year – the ninth most expensive out of all 26 countries.
Almost all car-related expenses increased in 2025, with a few countries seeing a couple metrics decrease slightly in price (such as Guatemalans spending an average of $18 less on parking than they did before). Uruguay was the exception to the rule, with the country seeing drops in every category expect car insurance and licensing. Fuel spending dropped $198 and car maintenance dropped $86 – that doesn’t necessarily mean those expenses got cheaper, but that car owners in Uruguay spent less than the previous year.
The biggest category for increasing costs was average annual fuel spending, with Denmark, France and Ecuador seeing increases higher than $300 a year. Car maintenance rose by more than $160 in France, Sweden and the UK, while the UK saw the biggest increase in car insurance averages, with an additional $253 in spending for 2025.
Car insurance is an important financial safety net for motorists that, depending on the level of cover, can insure you against a variety of mishaps, accidents and damaging events listed in the policy. As costs rise across the world, Executive General Manager Adrian Taylor urges motorists to take action.
“It only takes a few minutes for car owners to review the available car insurance policies. When you get your policy renewal, it pays to compare what’s out there,” Mr Taylor said.
“You can weigh up prices, coverage limits, exclusions and other features to find a similar policy for a cheaper price, or another policy that offers more in a competitive deal. Don’t let potential savings drive on by. In this environment, every dollar saved matters.”
Be sure to read through the Product Disclosure Statement (PDS) and Target Market Determination (TMD) documents of an insurance policy before purchasing.
Nine different metrics were used to create an annual running cost average figure. This formed one of three final metrics that were used for the index final score. To calculate the index score, countries were given a score between 0 and 10 for the three metrics, depending on how they performed in relation to all the other countries. These three scores out of 10 were averaged to create an overall index score out of 10.
The scores were rated using the following data points and methods:
The overall index score in collated in a way that a higher score equates to higher expenses.
All prices were gathered on and accurate as of 25/06/2025 and are subject to change. Prices were converted from local currencies into USD and AUD on 25/06/2025 and rounded up to the nearest dollar.
The nine factors that created the total annual average spending figure were sourced from Autocosts on 25/06/2025 and are subject to change. These factors were:
Fuel prices per litre were sourced from Global Petrol Prices on 25/06/2025 and are subject to change.
Licensing costs were sourced from the sources listed below (countries listed in alphabetical order):
N.B. The costs for renewing a licence in the state of New South Wales were used as a figure for Australia as it is the nation’s most populous state.
References:
1 A nation of cyclists. Ministry of Foreign Affairs of Denmark. 2023
2 Energy Fact Sheet: Why does Russian oil and gas matter? International Energy Agency. 2022.
To see similar, previous research into the topic, visit this page for 2023 and this page for 2024.