The Burrow
Mar 27, 2026
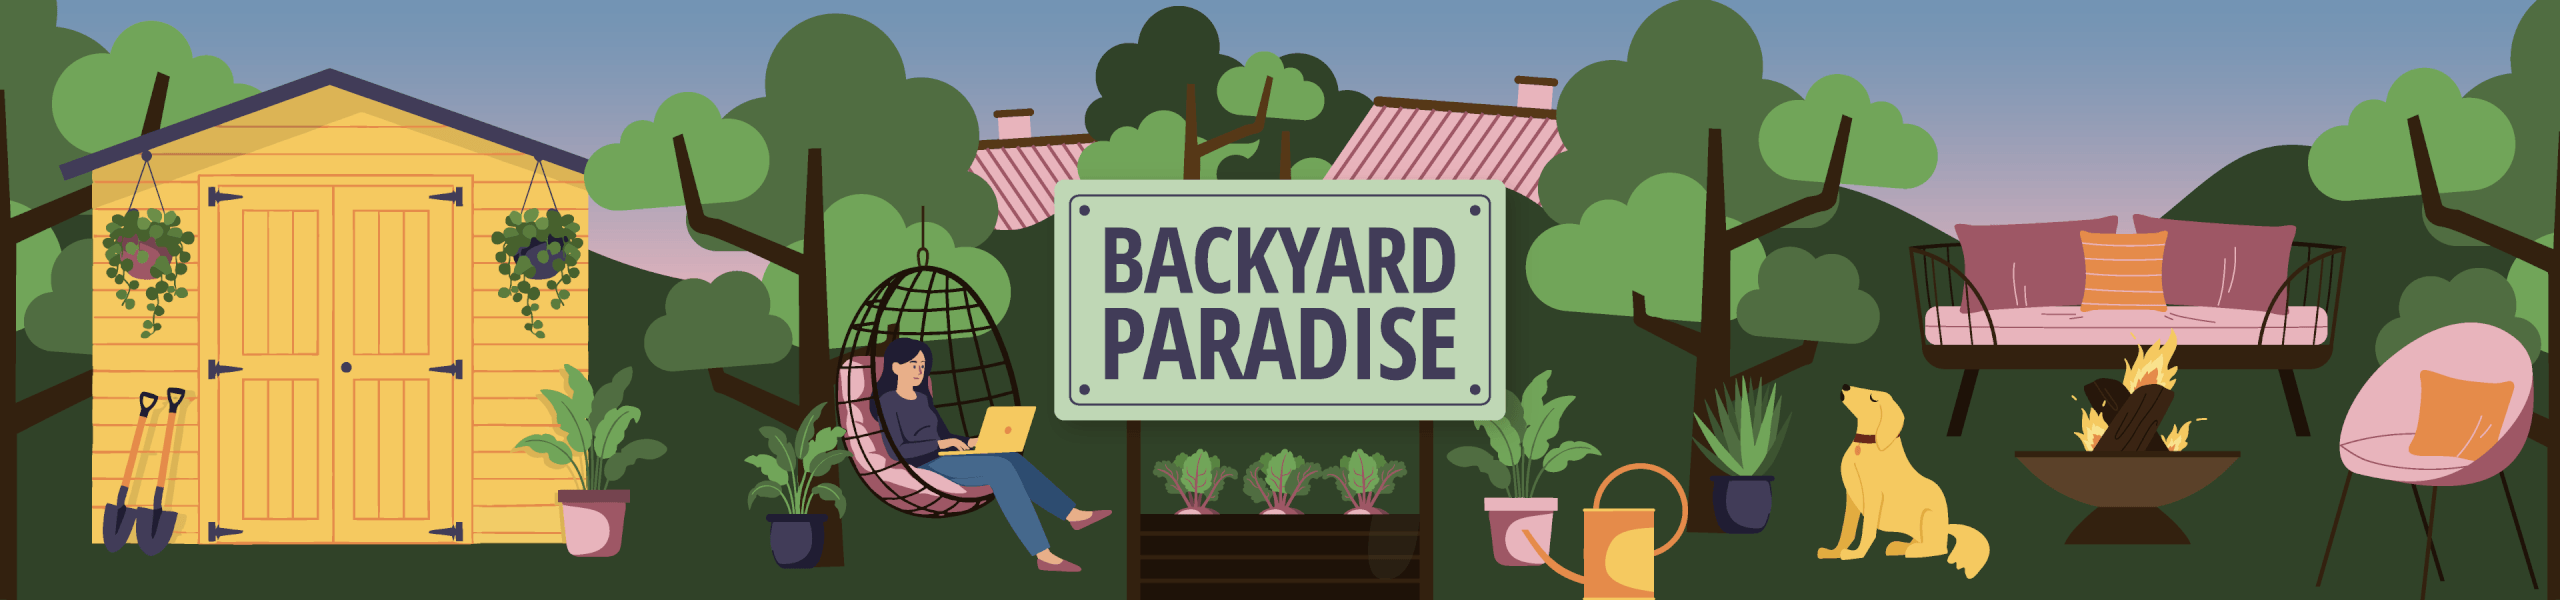
Outdoor living spaces are becoming a bigger part of the modern home, with households investing in features such as pools, patios, decking and premium BBQs. But as more value moves outside the four walls of the home, it means there is more homeowners need to protect. From storm damage to accidental loss, outdoor items and features can be costly to replace, making it important to understand what insurance does and does not cover.
To explore where outdoor living is most prominent across Australia and the US, the home and contents insurance comparison experts at Compare the Market created the Backyard paradise index. This index ranks Australian and US cities using factors such as premium outdoor amenity prevalence, estimated garden investment, outdoor living search trends and weather conditions. Together, these indicators show where households may have the most value tied up in outdoor spaces, and why it is worth understanding what home and contents insurance does and does not cover.
Australia’s climate makes outdoor living a major part of home life, so it is no surprise that many households invest heavily in amenities such as pools, patios, decking and BBQ areas. In our index, we highlight the top five cities in Australia for outdoor living, based on factors including estimated garden investment per household and the prevalence of premium outdoor amenities. Below are the highest-ranking cities and their total index scores:
Brisbane ranked highest in our index, with Households investing an average of AUD$49,180 on their gardens, and 30.3% of real estate listings mentioning at least one premium outdoor amenity. With a population of 2,693,649, that’s a substantial number of high value outdoor items. Combined with high levels of outdoor investment and exposure to extreme weather (9.1 extreme weather events a year), it highlights how much value may be sitting outside the home and why it is worth residents in Brisbane checking what is protected under a home and contents policy.
The Gold Coast showed similar trends. Despite having a higher prevalence of premium amenities (33.8%) and a greater estimated garden investment (AUD$49,843), it ranks second because it experiences 8.2 rainy days per month. Outdoor living search volume was also lower, with 5,076 searches per 100,000 people for terms such as “BBQ grill” and “landscaping near me”. The city also shares Brisbane’s average of extreme weather days per year.
Perth ranked third. While the city has a lower amenity prevalence than Brisbane and the Gold Coast, Perth residents still spend an average of AUD$28,014 on gardens and outdoor items. With 6.7 extreme weather events per year at state level, the index highlights how valuable outdoor spaces can be, and why it is worth checking what is protected under a home and contents policy.
Sydney had one of the highest populations in the index, and its residents spend roughly AUD$42,221 on their gardens. Outdoor living is an important aspect of life in the harbour city, which makes investing in proper coverage even more vital. Sydney also experiences 18.4 days of extreme weather per year, the highest figure in the index, highlighting the need to consider protecting the items in Sydney gardens.
Looking further down the list, 18.5% of Melbourne households own premium outdoor amenities, and Adelaide residents spend an average of AUD$18,021 on their gardens. While their numbers may be lower, these homeowners may still have valuable outdoor items and features exposed to weather, accidental damage and other forms of loss. Proper coverage ensures peace of mind for those who have invested heavily in their outdoor spaces.
Just like Australia, the USA is a country as grand as it is unpredictable. The highest-ranking US cities tend to combine strong sunshine levels with high outdoor investment, search demand and a higher prevalence of premium outdoor amenities. The top five US cities are below:
Las Vegas ranks highest in the US, with 27.5% of homes owning premium outdoor amenities such as pools and BBQs, and households spending an estimated USD$30,254 on their gardens. With so much value tied up in outdoor features, it is worth checking how these items and spaces are covered under a home and contents policy.
Phoenix and Denver also place highly in the index, helped by sunny climates that encourage outdoor investment. Phoenix households spend an estimated USD$20,535 on their gardens, while Denver residents spend USD$16,453. These figures show how quickly value can build up outside the home, from patios and decking to pools and BBQ areas.
California cities such as Los Angeles and San Jose rank highly thanks to a strong mix of sunshine, the prevalence of outdoor amenities, and household investment. In San Jose alone, the estimated garden investment per household is USD$18,874, showing just how much value can be found outside the home.
Even lower-ranking cities still show meaningful levels of outdoor investment. Baltimore households spend an estimated USD$7,062 on their gardens, while Washington reaches USD$11,432, showing that even outside the top-ranked cities, outdoor spaces can still hold valuable features worth protecting.
Whether you live in a top-ranking city or not, the findings show how quickly value can build up outside the home. Features such as pools, spas, patios, decking, BBQs and outdoor furniture can represent a significant investment, particularly in sunnier cities where outdoor living is part of everyday life.
While cover will vary depending on the insurer and policy, homeowners may want to check whether outdoor features, fixtures and belongings are included in their home and contents insurance, and whether any limits or exclusions apply.
Executive General Manager of General Insurance, Adrian Taylor, adds: “Outdoor spaces are becoming a bigger extension of the home, and for many households they now hold real financial value, whether that’s in decking, patios, pools, BBQs or outdoor furniture. As people invest more in these spaces, it’s worth checking what home and contents insurance policies cover, particularly for items kept outside or exposed to the elements.”
“Homeowners often focus on what’s inside the home, but valuable outdoor features can also be expensive to repair or replace if they’re damaged or stolen. Taking the time to understand the details of your cover, including any limits, exclusions or conditions, can help avoid surprises later on.”
This dataset ranks the 30 most populated cities in the US & the 20 most populated in AUS, based on their outdoor living potential using 6 key factors. Each factor’s data was collected and normalised to a score between 0 and 1. If data was missing, a score of 0 was given. These scores were then combined to give each city a total score out of 100, and cities were ranked from highest to lowest.
The factors used are as follows:
The factors were weighted as follows:
The factors were indexed as follows:
Australian Sources:
US Sources:
All data is correct as of 27/02/26. The ranking data shown is a compilation of multiple data sources and may not be representative of real life. All data is accurate with regards to the sources provided.