The Burrow

Oct 28, 2021
As comprehensive car insurance experts, we know that the cost of car insurance can vary significantly from country to country, and when people relocate internationally, they can be surprised by the cost difference.
But whether a country is a great place to drive or not is based on more than just the cost of car insurance.
For example, having good quality roads can help reduce road accidents and damage to vehicles, but the best roads in the world may be of little comfort if the cost of petrol makes your grocery trip a financially stressful journey.
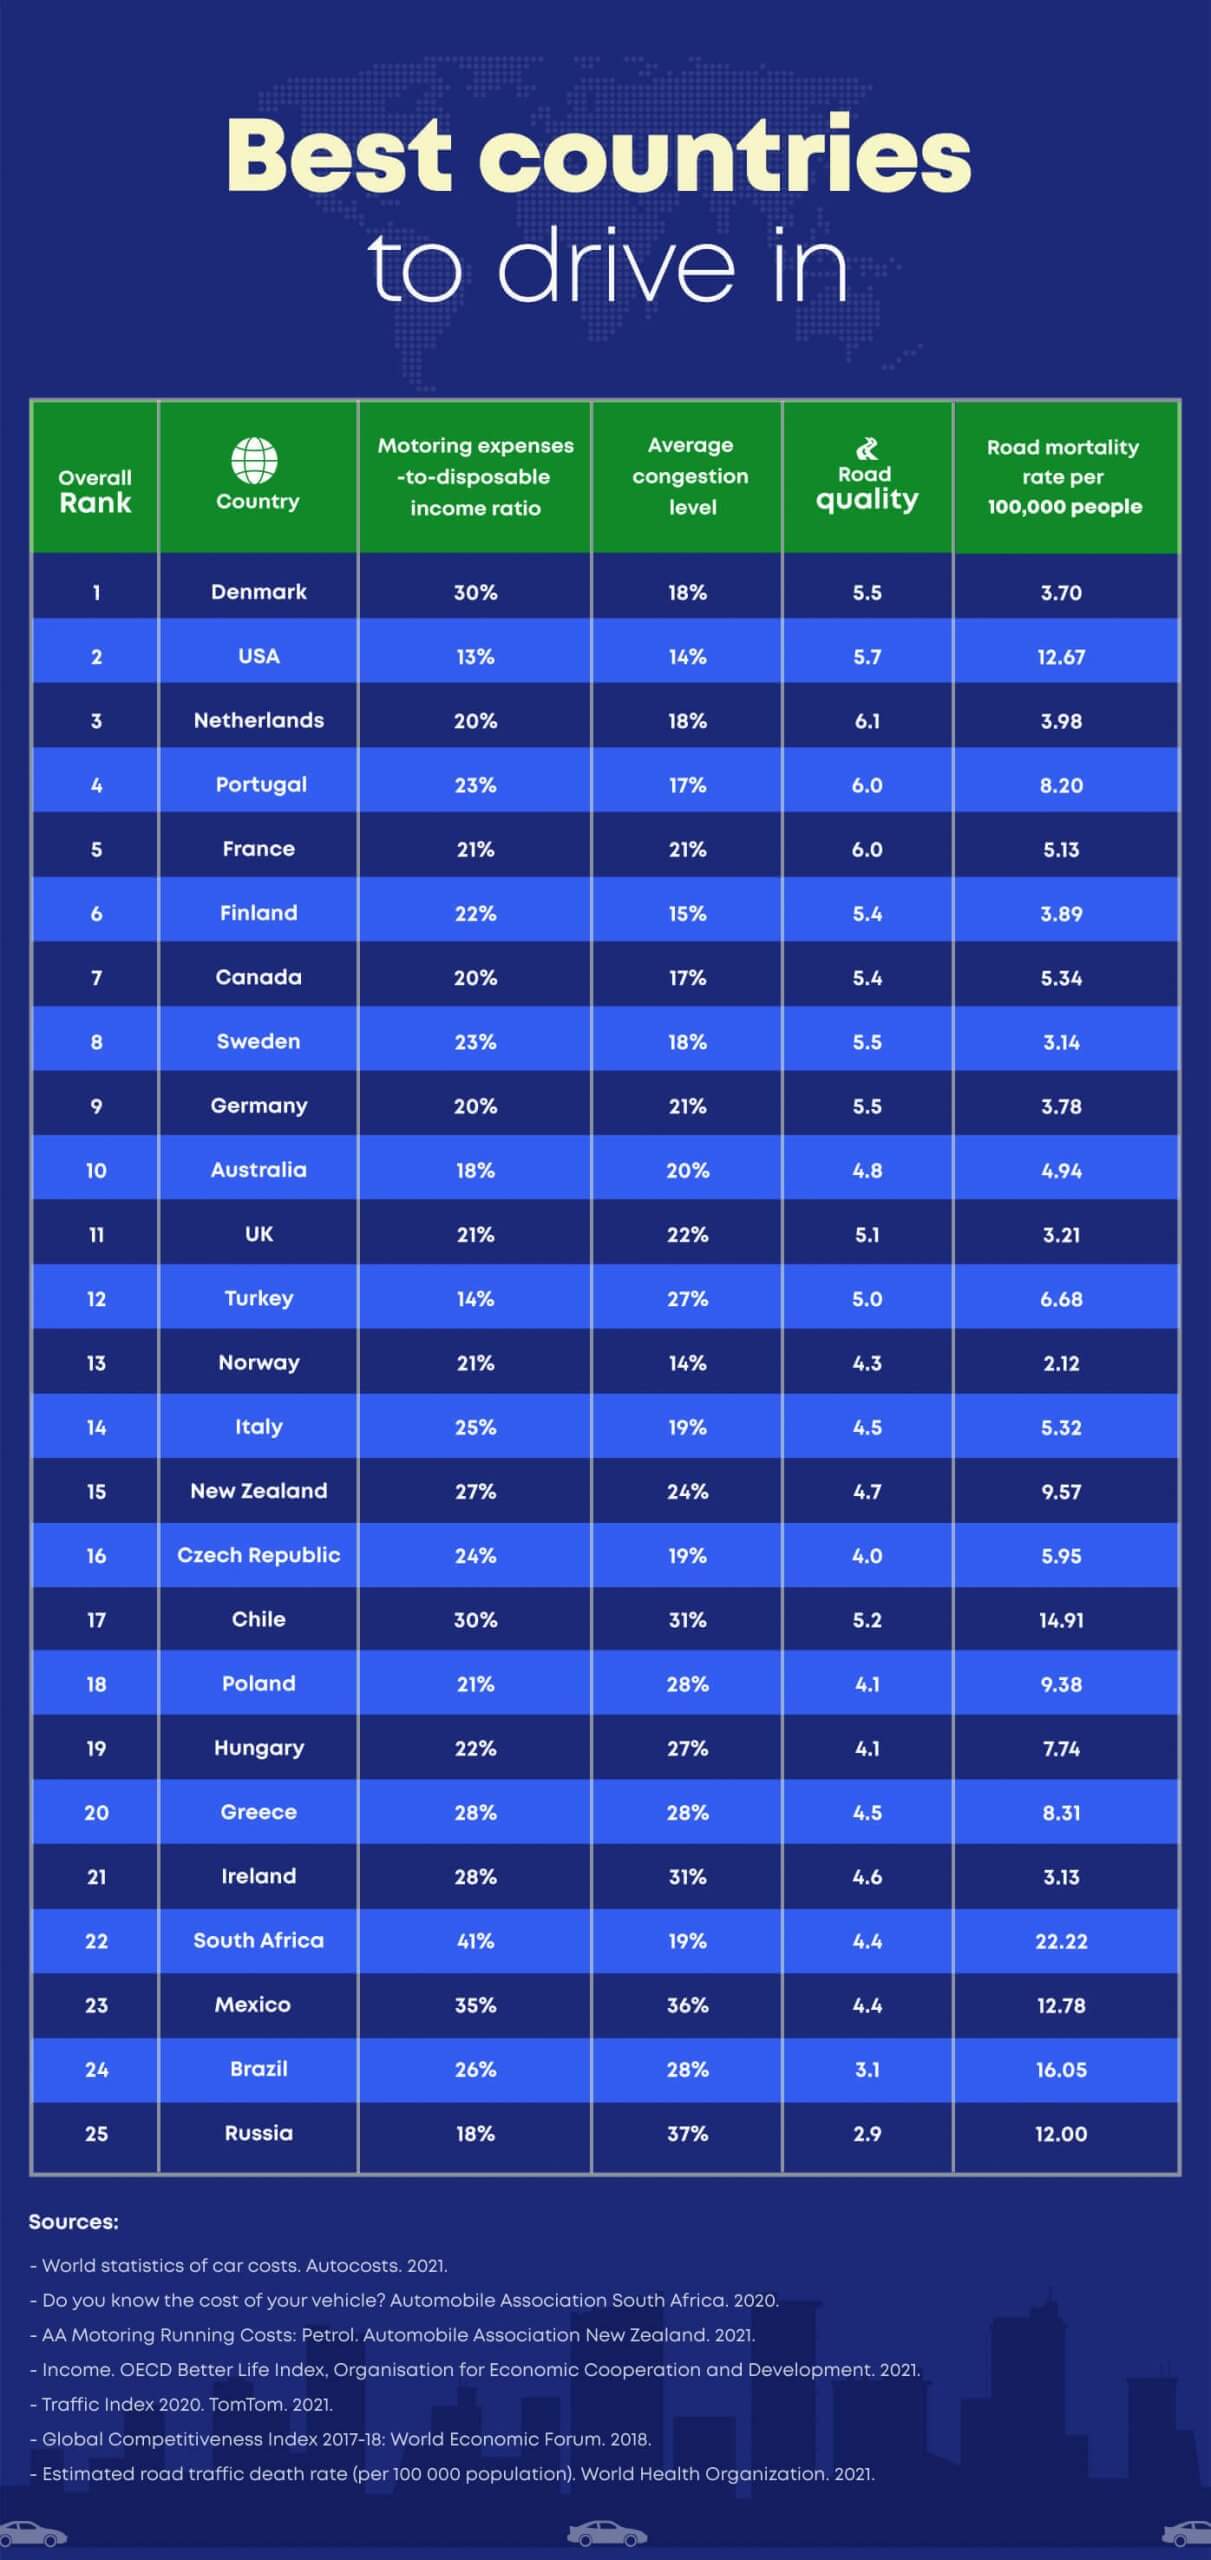
We decided to take a look at a variety of factors that can influence a driver’s experience to figure out which nation is arguably the best one for driving in. We gathered data on annual operating costs in relation to disposable income, congestion levels, road quality and road mortality across 25 different countries, then put them all together to form a ranking. Read more about how we did this in our methodology.
Click between the below tabs to see what we found.
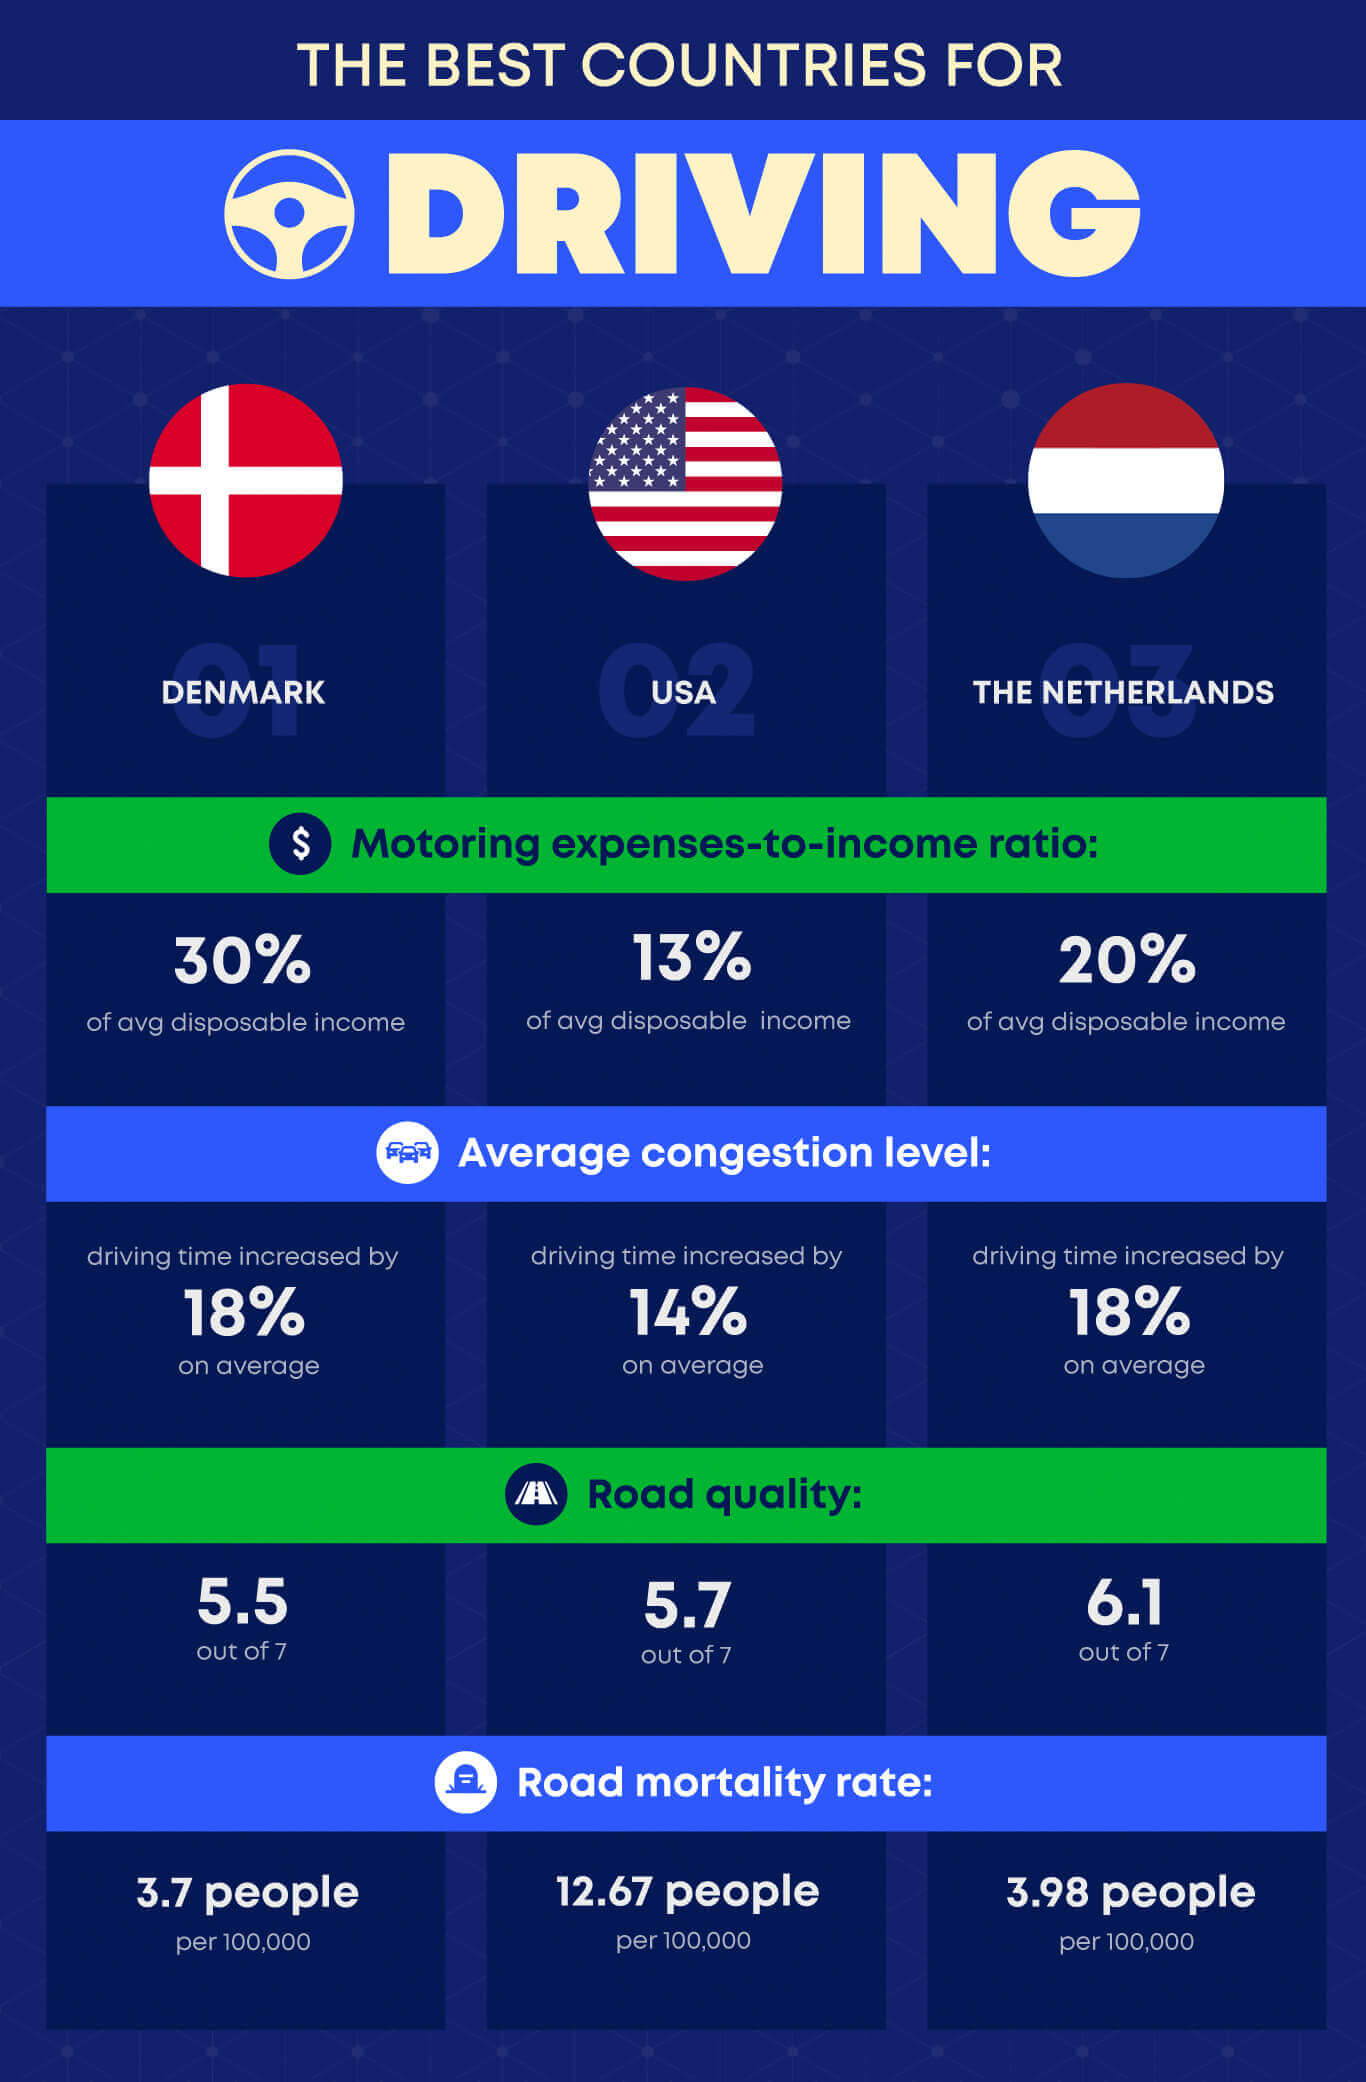
Denmark is the best country for car owners, according to our data. While it doesn’t necessarily have the best motoring expenses-to-income ratio, the country’s congestion and road quality are above average. Denmark also has one of the lower road mortality rates of all 25 nations we examined.
The USA’s affordable motoring expenses, better-than-average congestion (averaged across the country) and road quality help offset it having one of the worst road mortality scores on our list, bringing it into second place.
The Dutch take third place due to excellent quality roads and a low road mortality rate, plus strong scores in expenses-to-income and congestion.
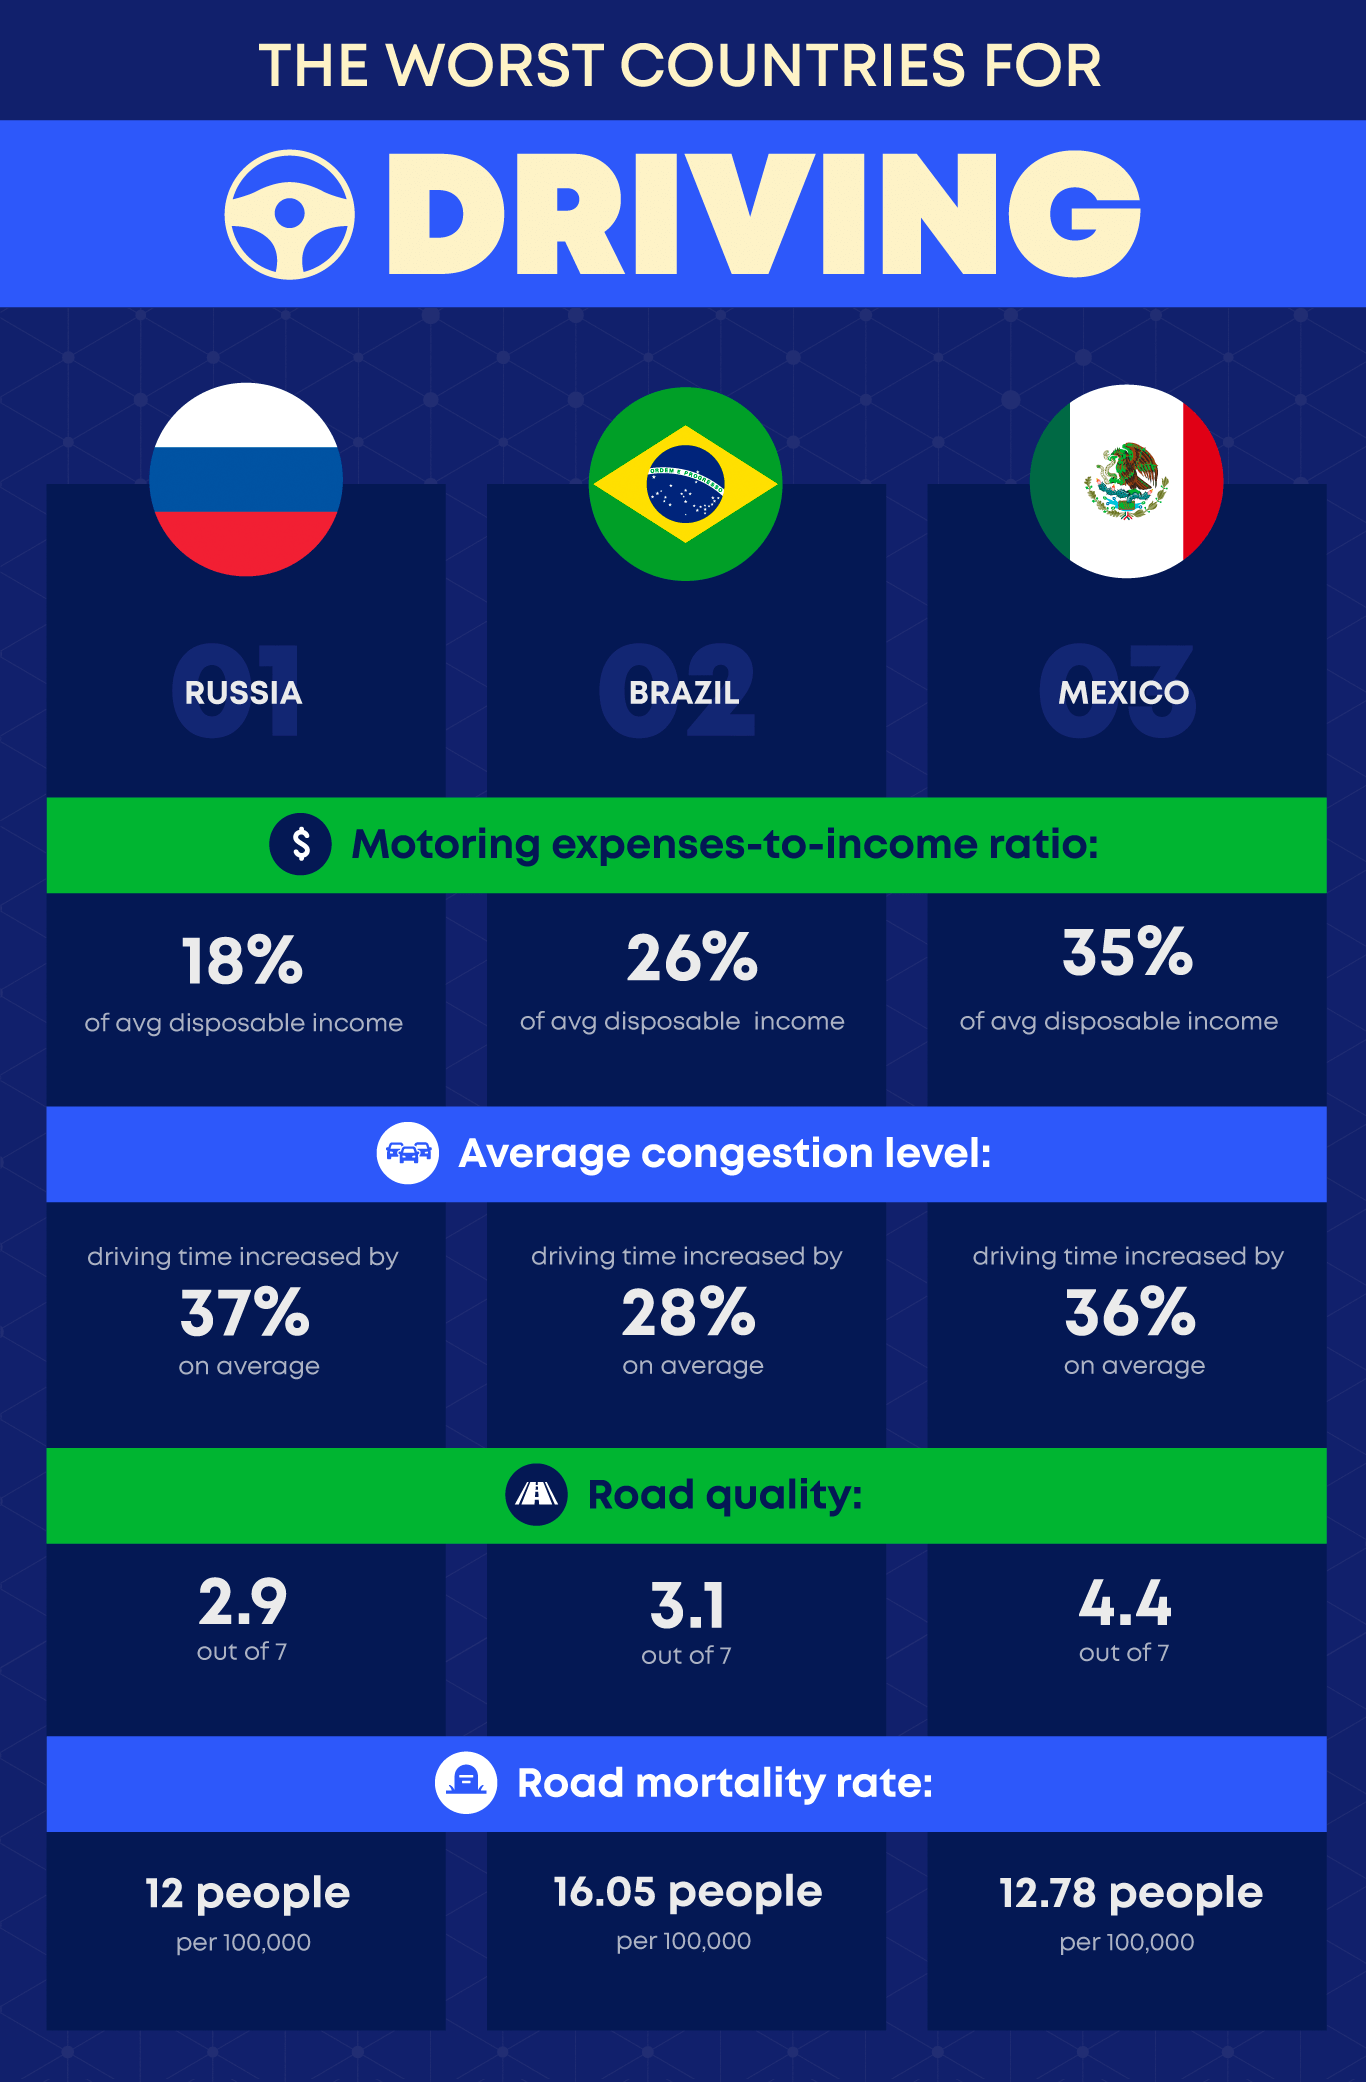
According to our data, Russia is the worst country to drive in. It has the worst road quality score and one of the worst congestion scores of all countries in our ranking. Unfortunately, it also has a high road mortality rate, and all these factors combined make it the worst country on our list.
Brazil had the highest road mortality rate out of the three worst-performing nations, though it wasn’t the worst score across all our metrics. Expensive motoring costs, high congestion and poor roads brought it down to second-last place.
While Mexico has the best road quality of the bottom three nations, it has the second-highest expenses-to-disposable-income ratio of all 25 countries in our ranking.
Australia sits in 10th place on our index, roughly in the middle of the index. Compared to Denmark, Australia’s motoring expenses-to-disposable-income are cheaper, but Australia has slightly higher congestion, worse quality roads and a higher road mortality rate.
In comparison to Russia, Australia’s motoring expenses are the same. Australia’s congestion, road quality and road mortality rate are much better, however, in comparison to Russia.
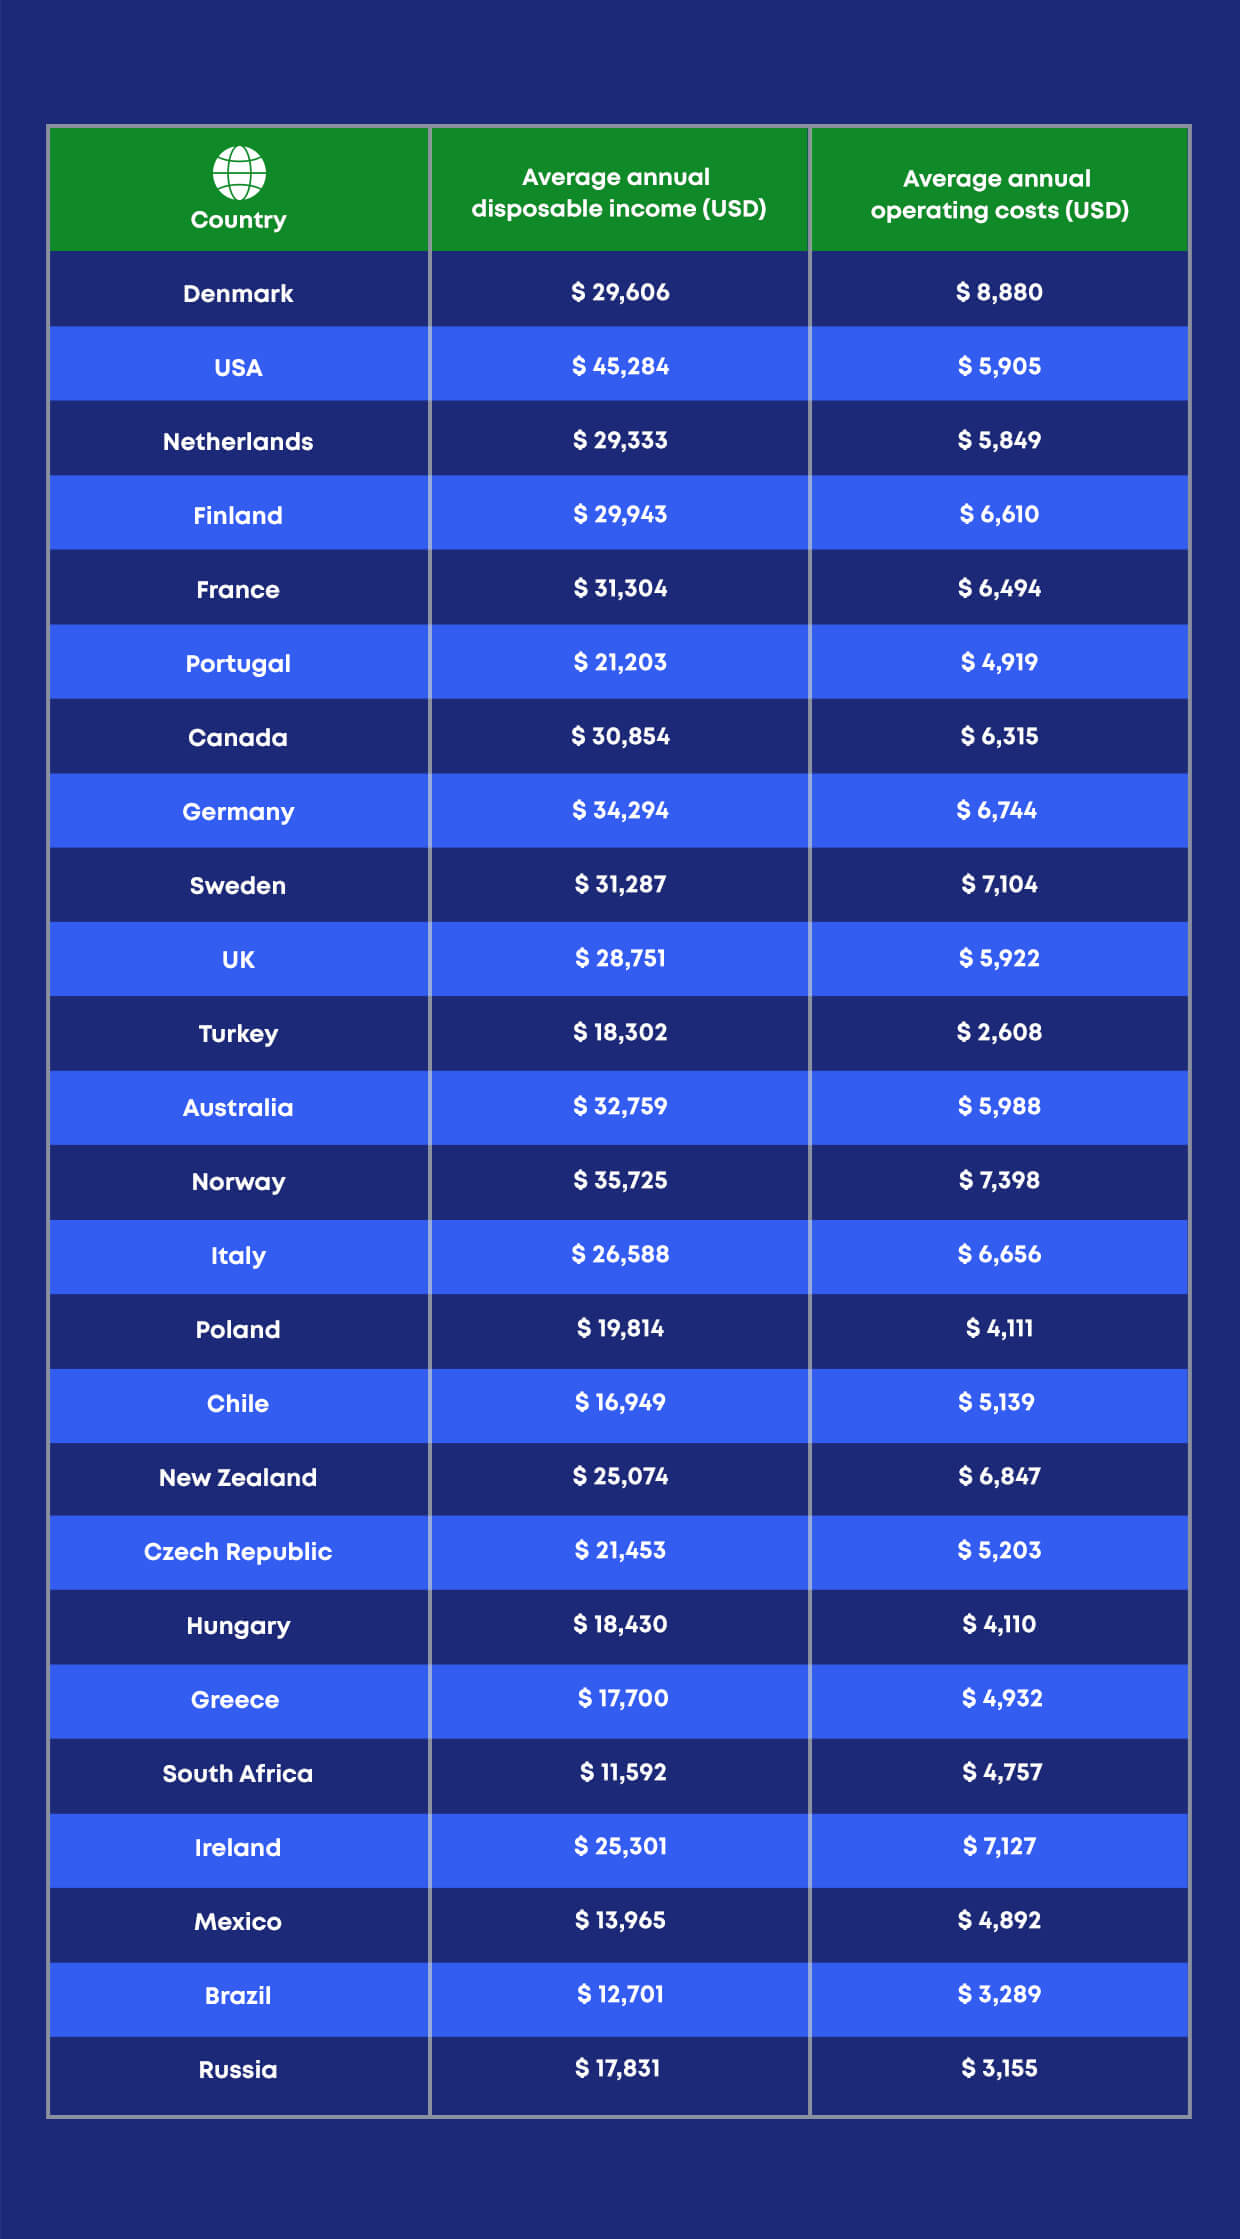
The average annual operating cost figures (which include fuel, maintenance, tolls, inspections, cleaning and car insurance costs) were converted into USD on 18/05/21 and rounded down to the nearest dollar. An expenses-to-disposable-income ratio was calculated using the average annual disposable income from the OECD’s Better Life Index in conjunction with the average annual operating cost figures.
Congestion level figures indicate the average increase in the time it would take to travel compared to non-congested conditions. These are based on an average figure calculated from the data listed in TomTom’s Traffic Index 2020 for available cities in each of the 25 countries.
Road quality is a score out of seven, with seven being the highest, based on a survey question from the World Economic Forum’s Global Competitiveness Index.
The road mortality rate is a figure per 100,000 population.
All these nations were then ranked based on their performance across all metrics.
The annual operating costs and disposable income figures used to create the expenses-to-income ratio are listed in Motoring Expenses below.
World statistics of car costs. Autocosts. 2021.
Do you know the cost of your vehicle? Automobile Association South Africa. 2020.
AA Motoring Running Costs: Petrol. Automobile Association New Zealand. 2021.
Income. OECD Better Life Index, Organisation for Economic Cooperation and Development. 2021.
Traffic Index 2020. TomTom. 2021.
Global Competitiveness Index 2017-18: World Economic Forum. 2018.
Estimated road traffic death rate (per 100 000 population). World Health Organization. 2021.