The Burrow
Jun 29, 2021
From earthquakes and hurricanes to wildfires, tornadoes and everything in between, it’s clear that natural disasters leave a trail of destruction in their path.
As home and contents insurance experts, we want everyone to be prepared, particularly from a financial perspective, given the exorbitant costs that can be associated with repairing or replacing a home and its contents after such devastation.
A great way to stay prepared for an unexpected event is to regularly review your policy to ensure that you are adequately covered for the correct value of your home and belongings. If you are covered for an amount that is less than the actual value to rebuild your home or replace all of your belongings, that is when you are underinsured. This means that in the event you need to make a claim, you may not receive a payout that will sufficiently cover the cost to replace, rebuild or repair the damage.
You may also find that when it comes time to pay your premium, you could be facing higher costs if you are located in an area prone to natural disasters. This is because insurers will typically adjust the cost of their policies to compensate for the higher risk associated with living in a disaster-prone area.
To get a better idea of the specifics of your policy and what you could expect in relation to limits and exclusions, it’s a good idea to check the Product Disclosure Statement (PDS) provided by your insurer.
Knowing the importance of avoiding underinsurance, we wanted to take a further look into what the damage from different types of weather events can cost on a wide scale. How do the expenses for natural disasters in one country compare to events around the world? Can disasters that cost a similar amount of destruction impact a country’s GDP differently?
We looked at several worldwide natural disasters between 2000 and 2019 with a damage bill that exceeded more than USD$1 billion. Not only did we investigate the total cost of these natural disasters, but how much they would be worth in today’s terms due to inflation.
Please note: We have endeavoured to include as many relevant disasters as possible based on reliable available data, however, we acknowledge that this list may not be comprehensive of all natural disasters that occurred between 2000 and 2019.
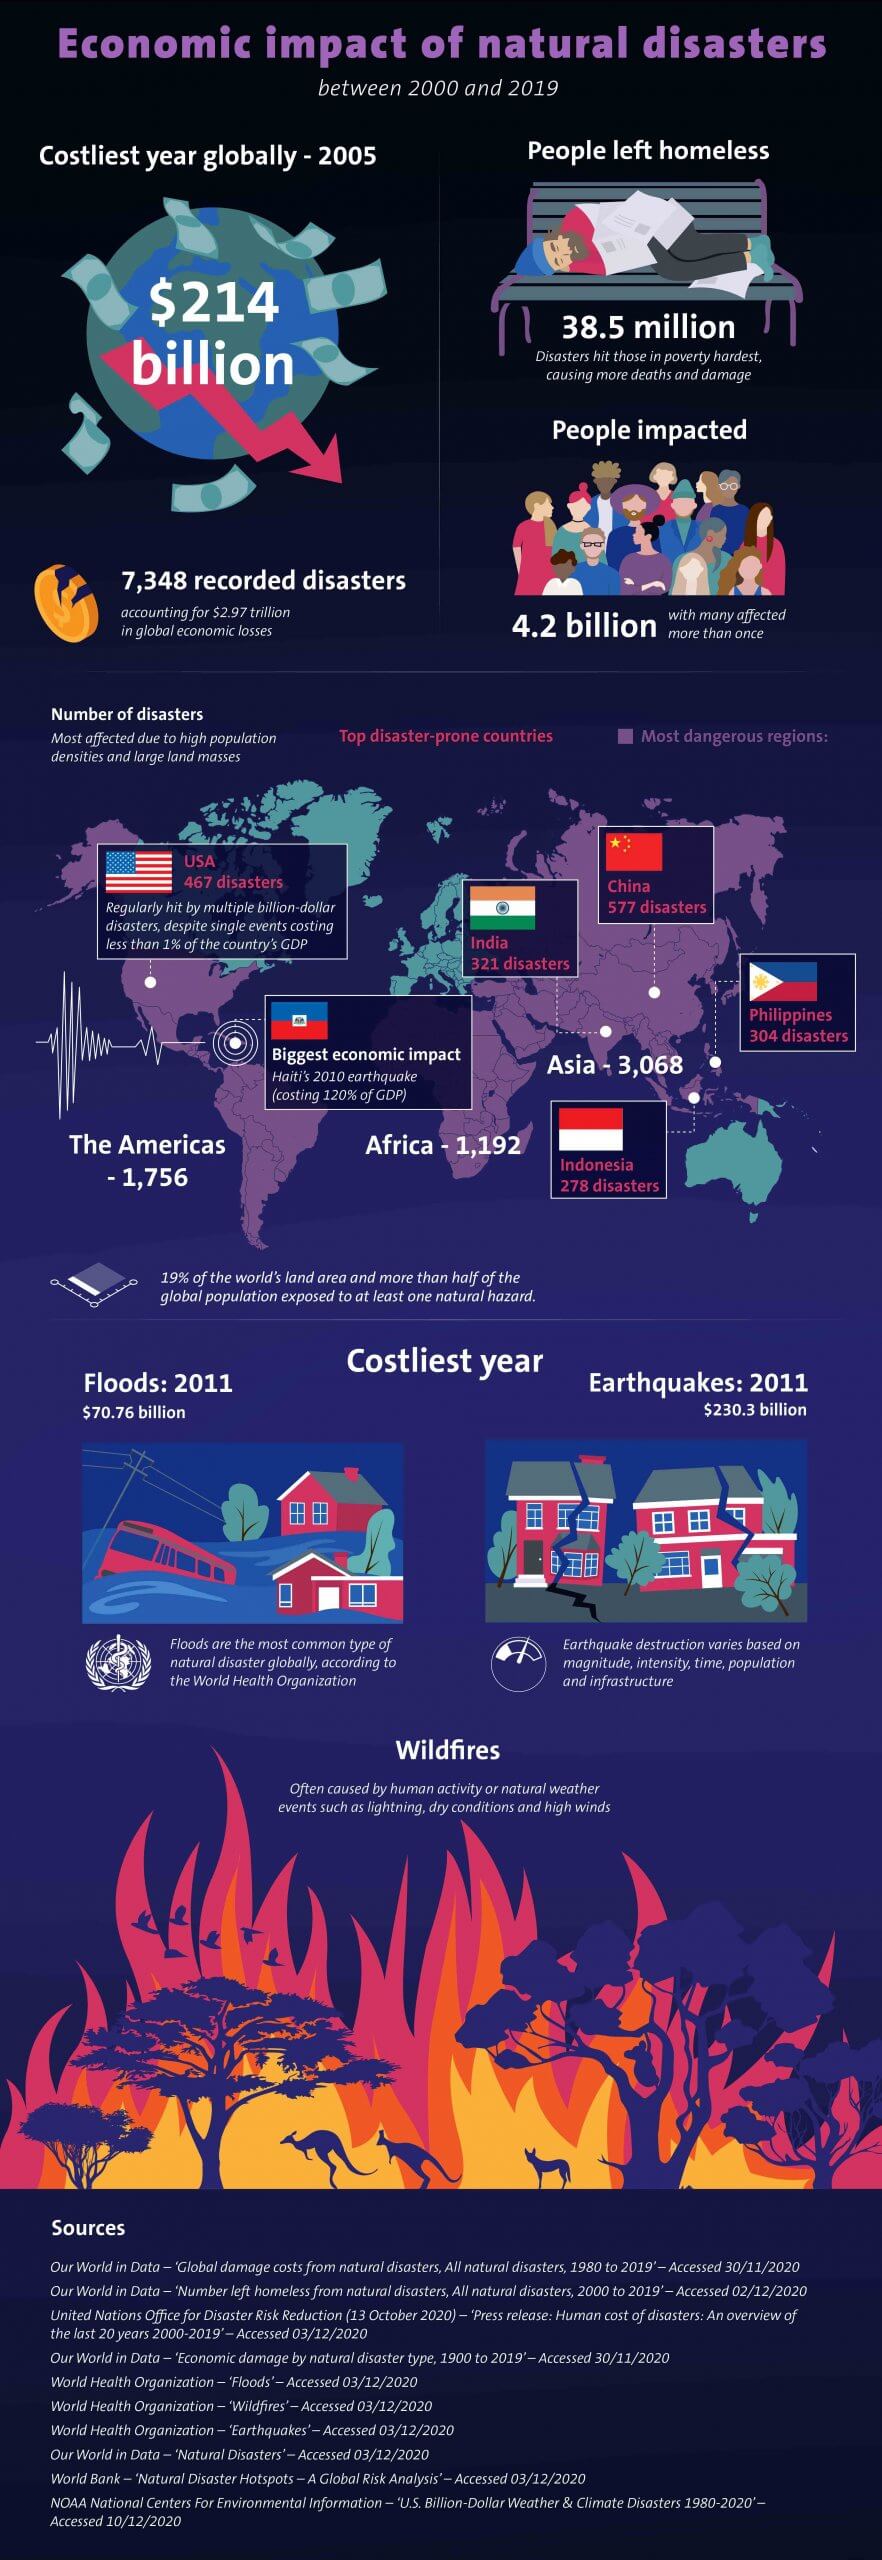
While all these disasters cost billions of dollars, caused mass destruction and significantly impacted the countries they hit, we discovered that some cost more in terms of a nation’s Gross Domestic Product (GDP) than others.
Using the disaster cost as a percentage of a country’s GDP, we determined just how significant the event was on that country’s economy by looking at the top countries on the list.
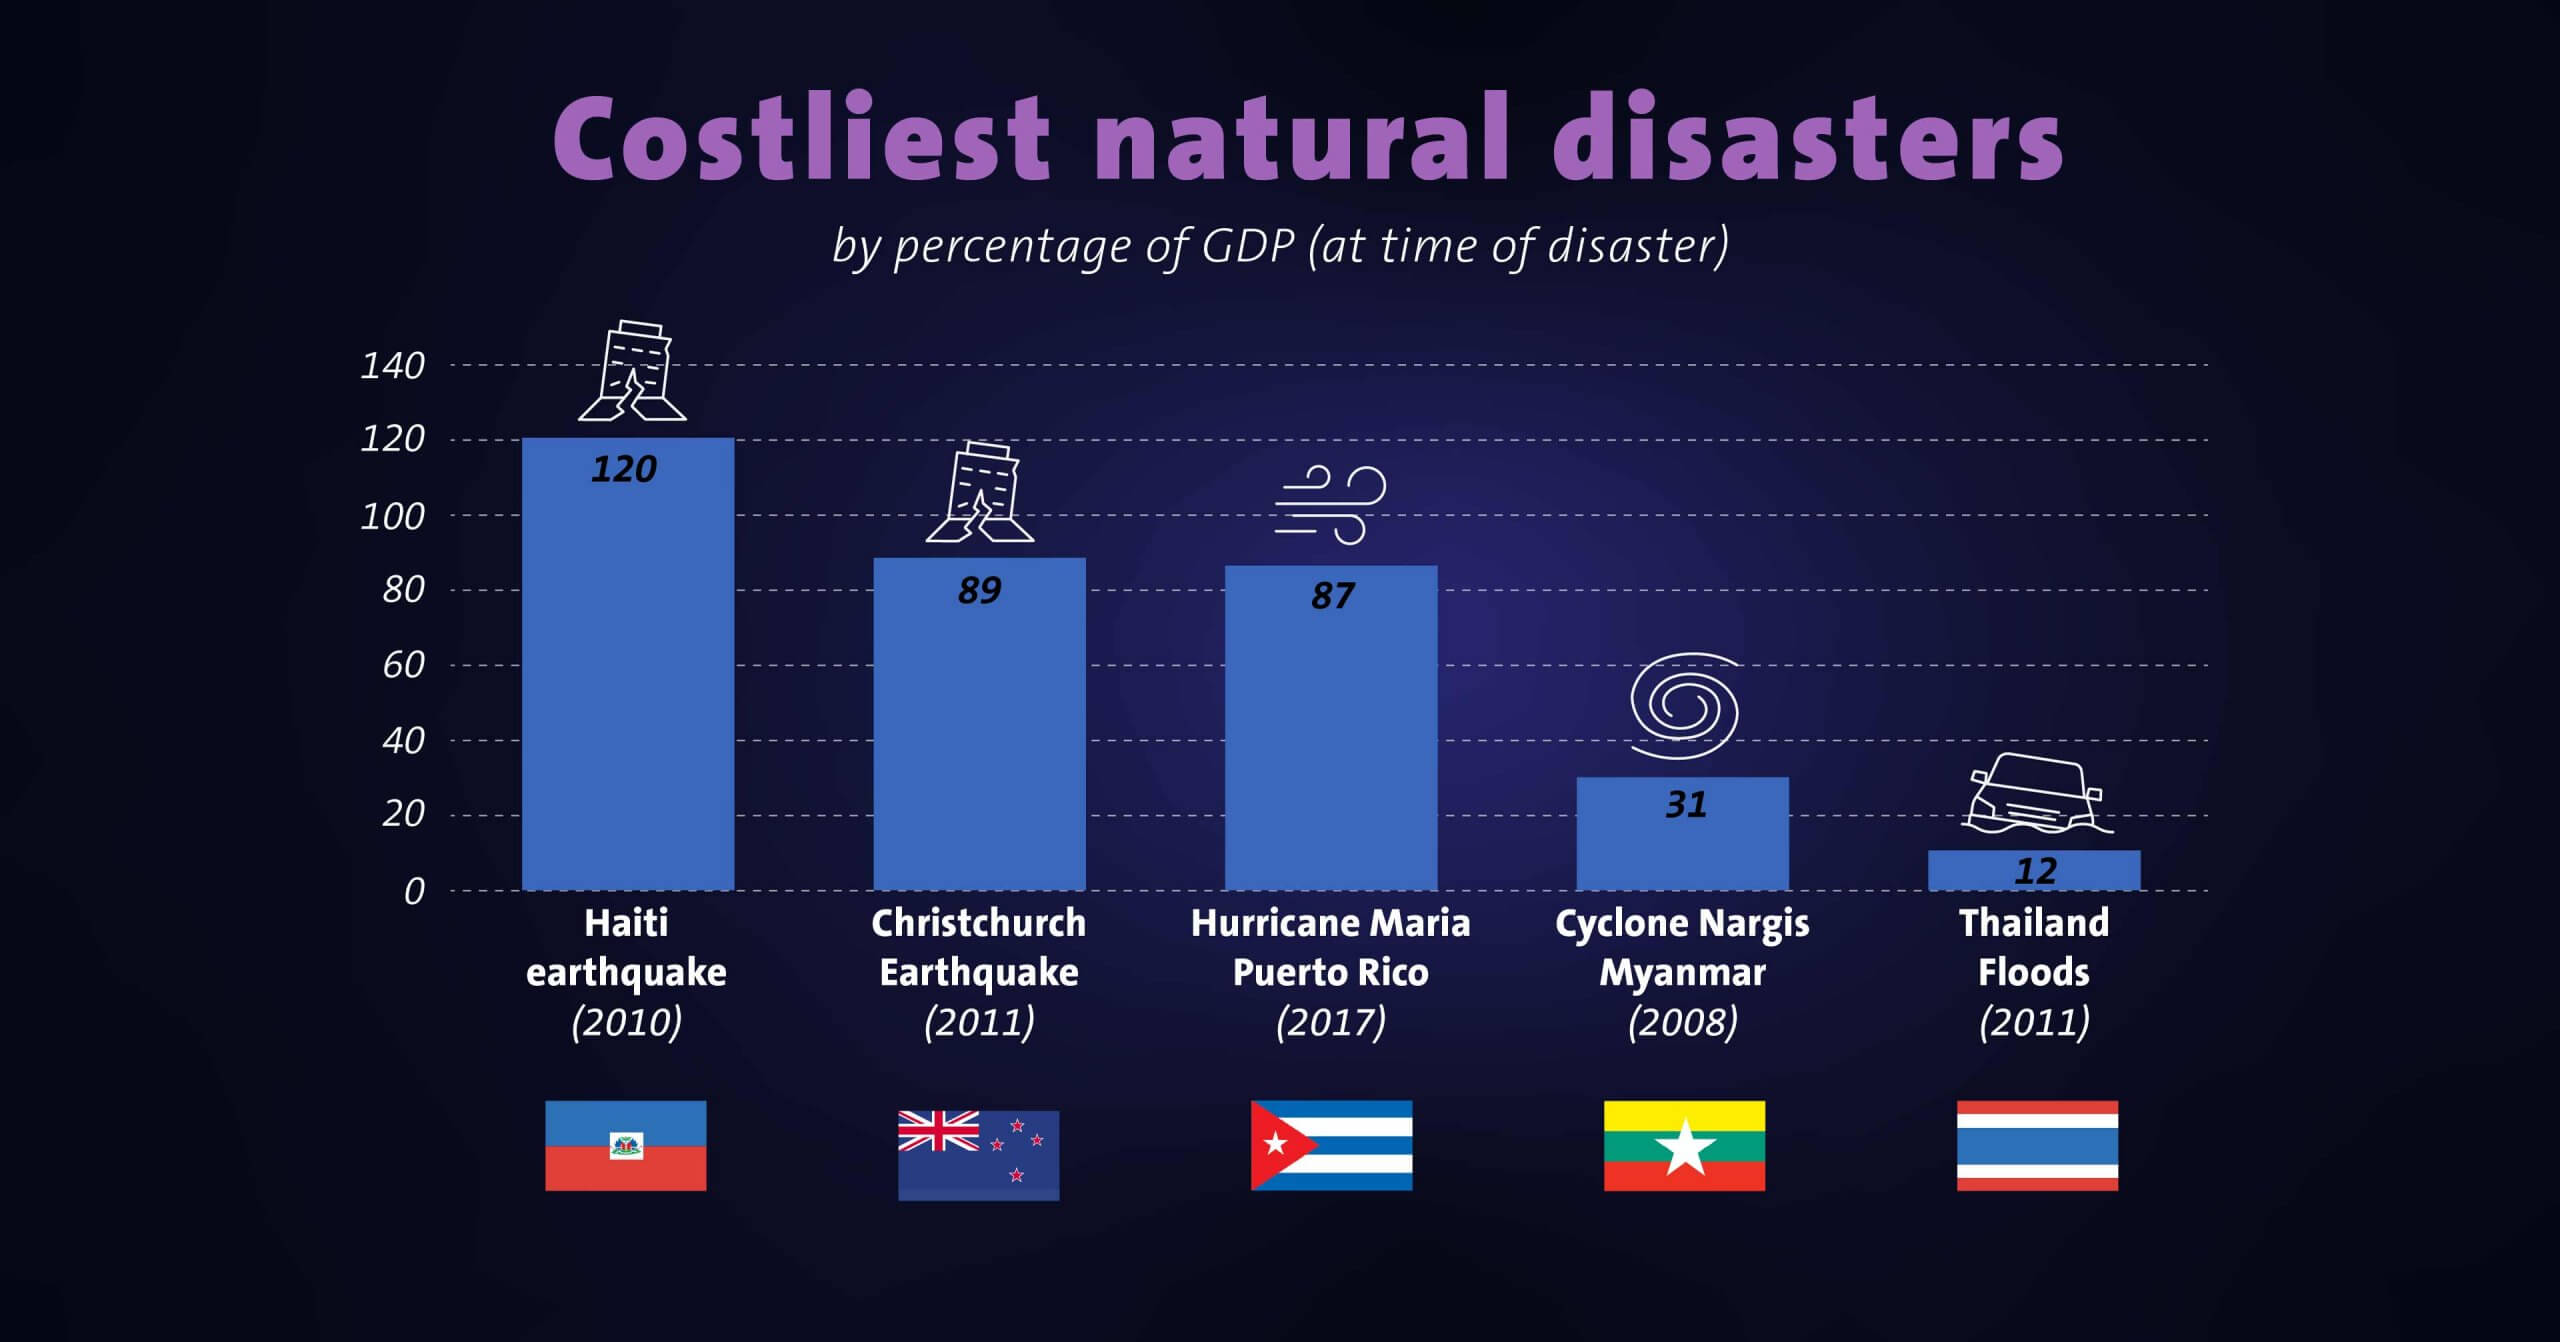
We take an in-depth look at the three disasters on our list where the disaster cost had the greatest impact on the country’s GDP.
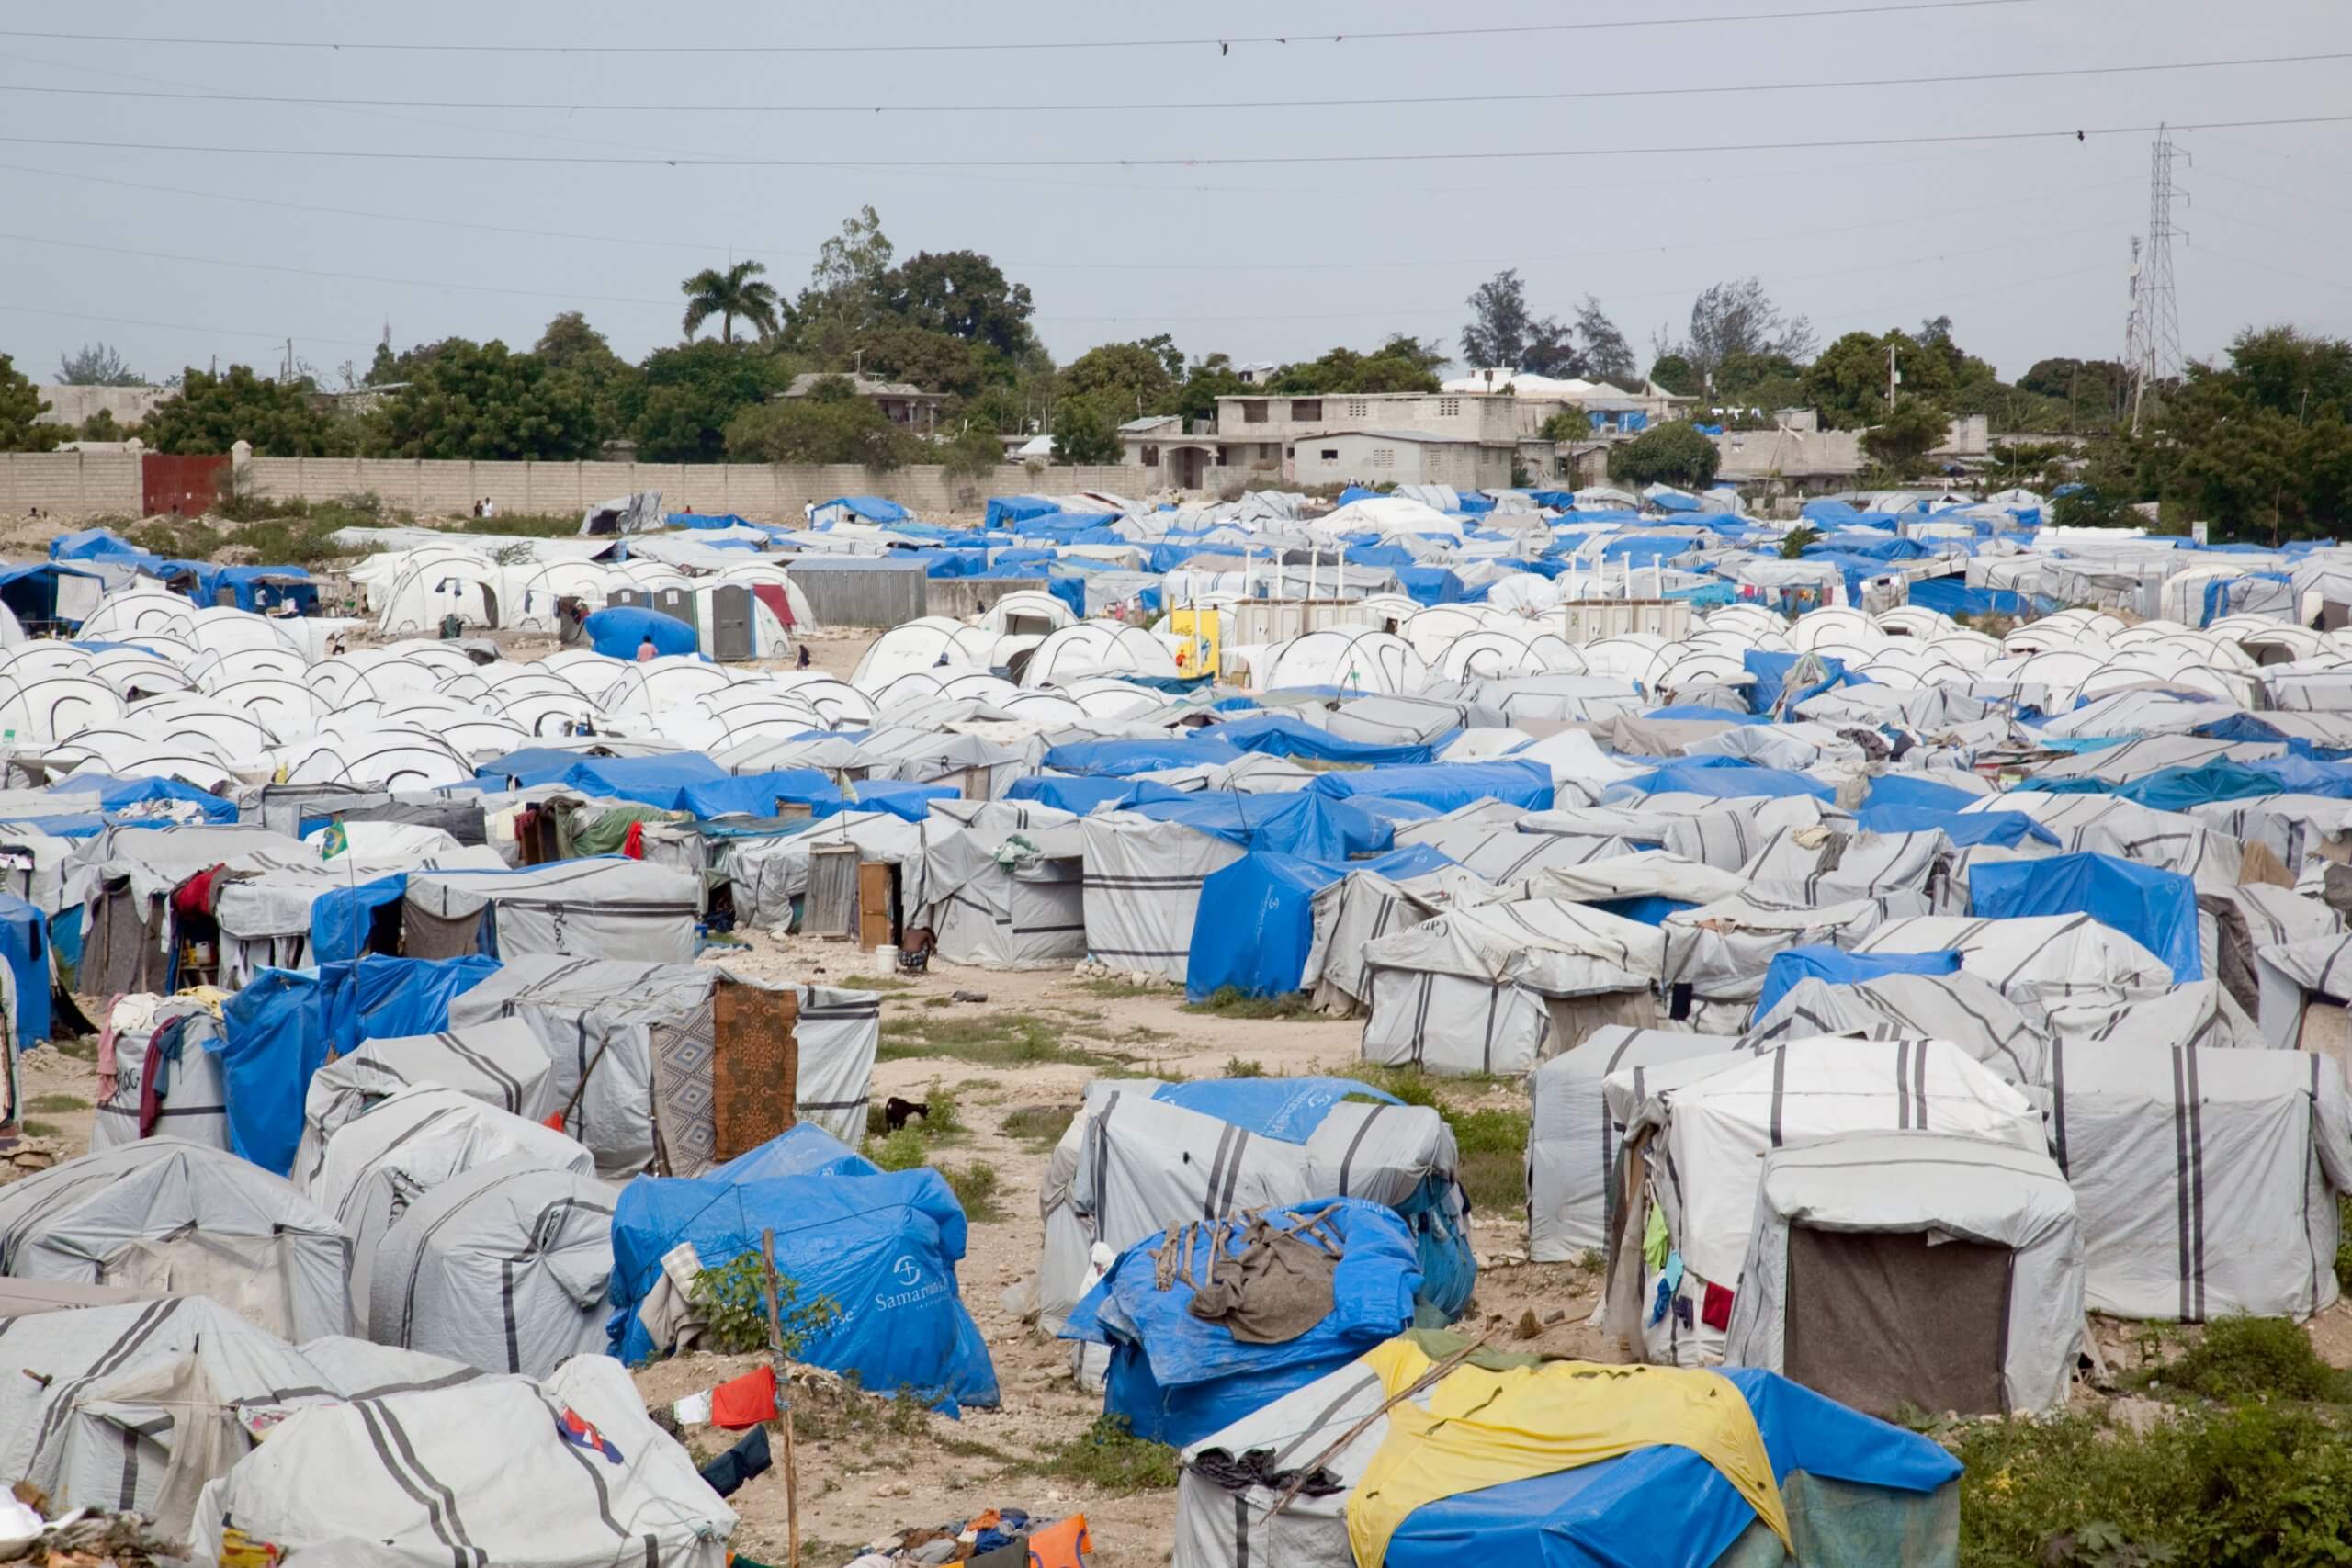
What happened: A 7.0 magnitude earthquake hit Haiti on 10 January 2010. Around 230,000 people died, 300,000 were injured and more than 1.5 million were displaced due to collapsed infrastructure.11
The country had never seen damage at this scale before and the government wasn’t equipped to respond to a crisis of this size. Not only did a third of civil servants in the country lose their lives, but key administrative buildings were destroyed – further impacting recovery efforts. The nation’s capital, Port-au-Prince, was reduced to rubble, with some 35.3% of the nation’s population at the time (3.5 million) living in hard-hit areas.
The World Bank notes that the actual repair costs reached USD$11.3 billion11 – significantly more than the USD$8 billion of damage caused by the earthquake. The earthquake also caused a cholera epidemic.12 The outbreak is believed to have been caused by water contamination and as of 2020, the bacterial disease was close to being eradicated in Haiti.12
The current situation: It’s hard to fully understand how Haiti is coping more than a decade after the initial earthquake, given the country has experienced social-political change since 2018.12 The country remains the poorest nation in the Western Hemisphere, there’s been political instability and the COVID-19 pandemic has hindered Haiti’s weak economy.13
According to the United Nations Office for the Coordination of Humanitarian Affairs (OCHA), humanitarian organisations initially struggled to coordinate the response efforts; and due to the size of the disaster, reconstruction efforts have been long and difficult. The OCHA says that international aid wasn’t as effective as expected and that the situation has been further impacted by other disasters (such as Hurricane Matthew in 2016) and the cholera epidemic.
Several humanitarian groups have provided updates on how their efforts have helped Haiti. The Agency for Technical Cooperation and Development (ACTED) – a non-profit and non-political organisation – says it’s building 500 homes that are resistant to cyclones and earthquakes.12
The organisation is also conducting workshops that educate local leaders about disaster risks and rehabilitation after severe weather events.
Meanwhile, the World Bank notes that the Infrastructure and Institutions Emergency Recovery Project (IIERP) was set up following the earthquake, to support the Haitian Government and rebuild vital institutions and infrastructure that were destroyed.
Government functions have also been restored with the help of the International Development Association (IDA). The IDA has also redeveloped 100 kilometres of road, which created 95,000 days of work for Haitians, improved access to essential services and potentially boosted tourism to affected areas.11
Unfortunately, Haiti is regularly hit by natural disasters, with World Vision explaining that it’s difficult for locals to overcome poverty caused by these events.28
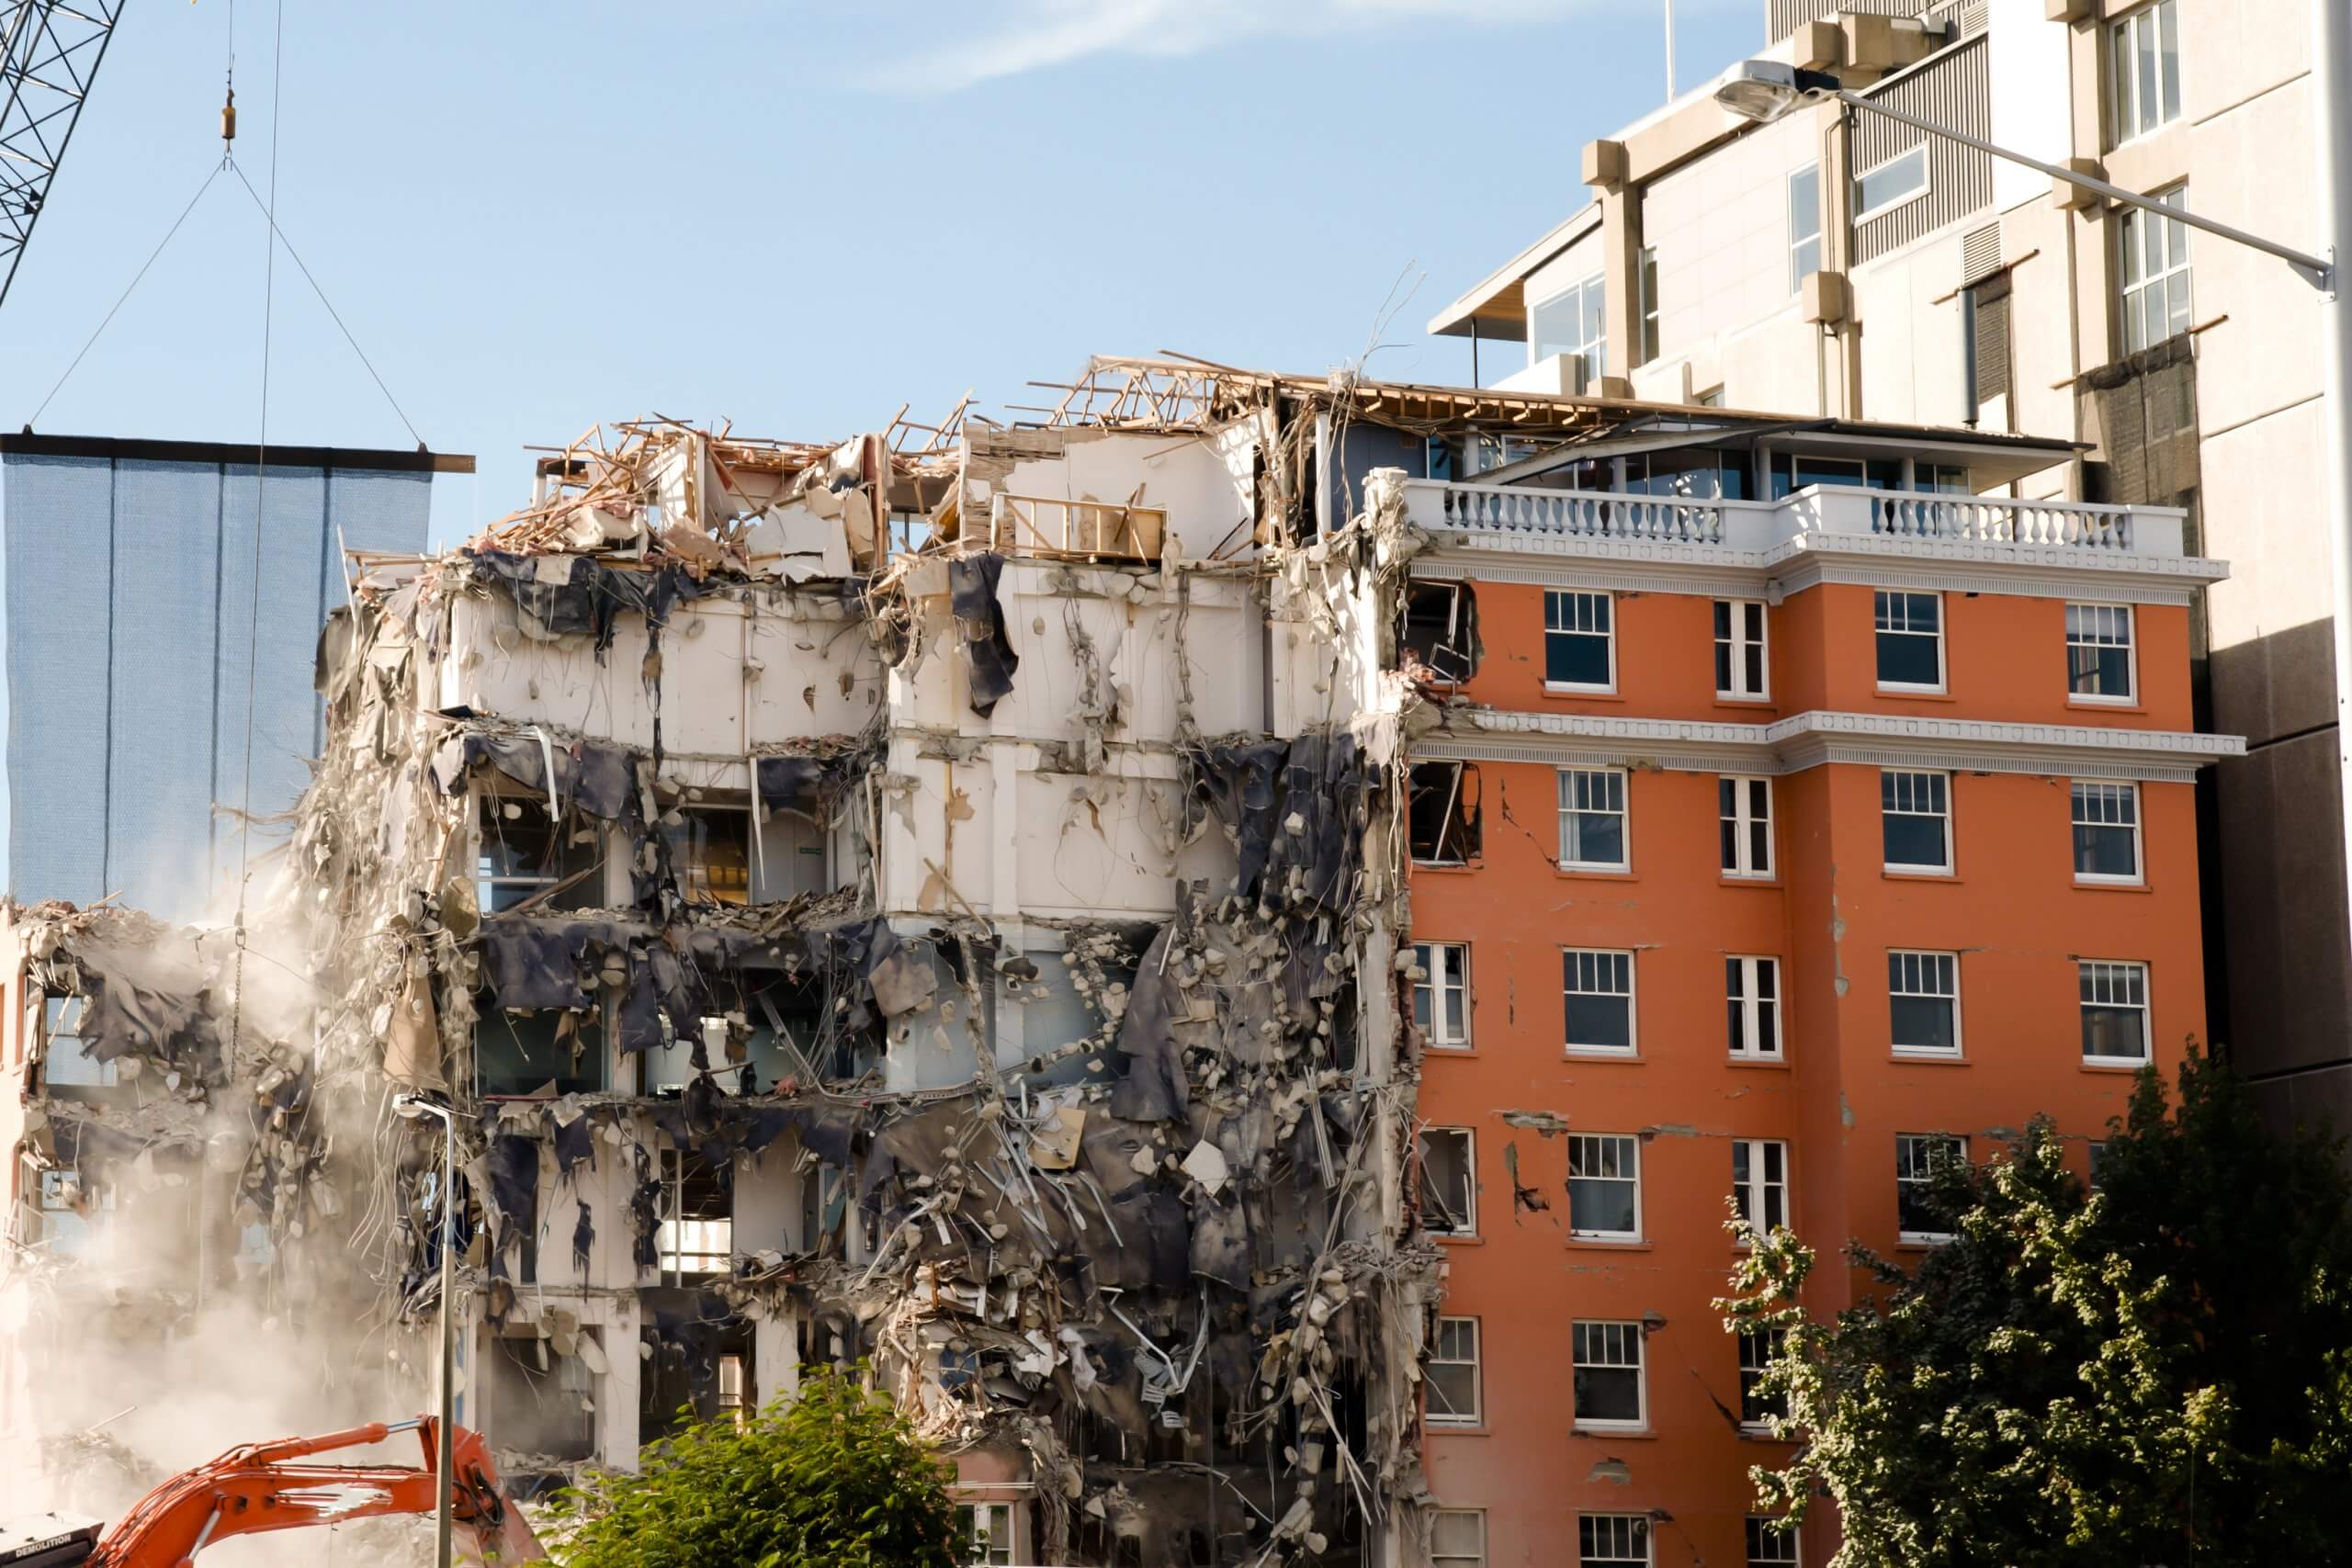
What happened: A 6.3 magnitude earthquake hit Christchurch at 12:51pm on 22 February 2011, killing 185 people, injuring thousands and causing significant damage. It came six months after another quake hit the region, with previously damaged buildings reduced to rubble this time around.14
More than half of the CBD structures had to be demolished, thousands of homes were destroyed, and many suburban areas were abandoned. Residents across the city were left homeless, while others were left with no power or water.15
What’s more, is some areas of the CBD were cordoned off for more than two years after the earthquake.14 Parts of the city and surrounding areas were deemed unsuitable for rebuilding, with 8,062 households offered a buyout from the government. Other areas of the city have been considered fit to rebuild.
A national state of emergency was declared and the government launched the Canterbury Earthquake Recovery Authority (CERA) to help the city rebuild.15
The current situation: Following the earthquake, an estimated 70,000 people left Christchurch due to ongoing aftershocks and because their homes were destroyed and they had little access to essential services.16 However, the city’s population returned to pre-earthquake levels six years later in 2017.17
Statistics also show that Christchurch is slowly bouncing back. Compared to a 2013 census, Stats NZ found that in 2018, there were an additional 11,000 workers in the CBD.18
Of course, the city still faces hurdles a decade after disaster struck. For example, the Christchurch Central Recovery Plan notes that some key issues with Christchurch’s recovery include:
Still, Christchurch City Council has several development projects in the pipeline, including:
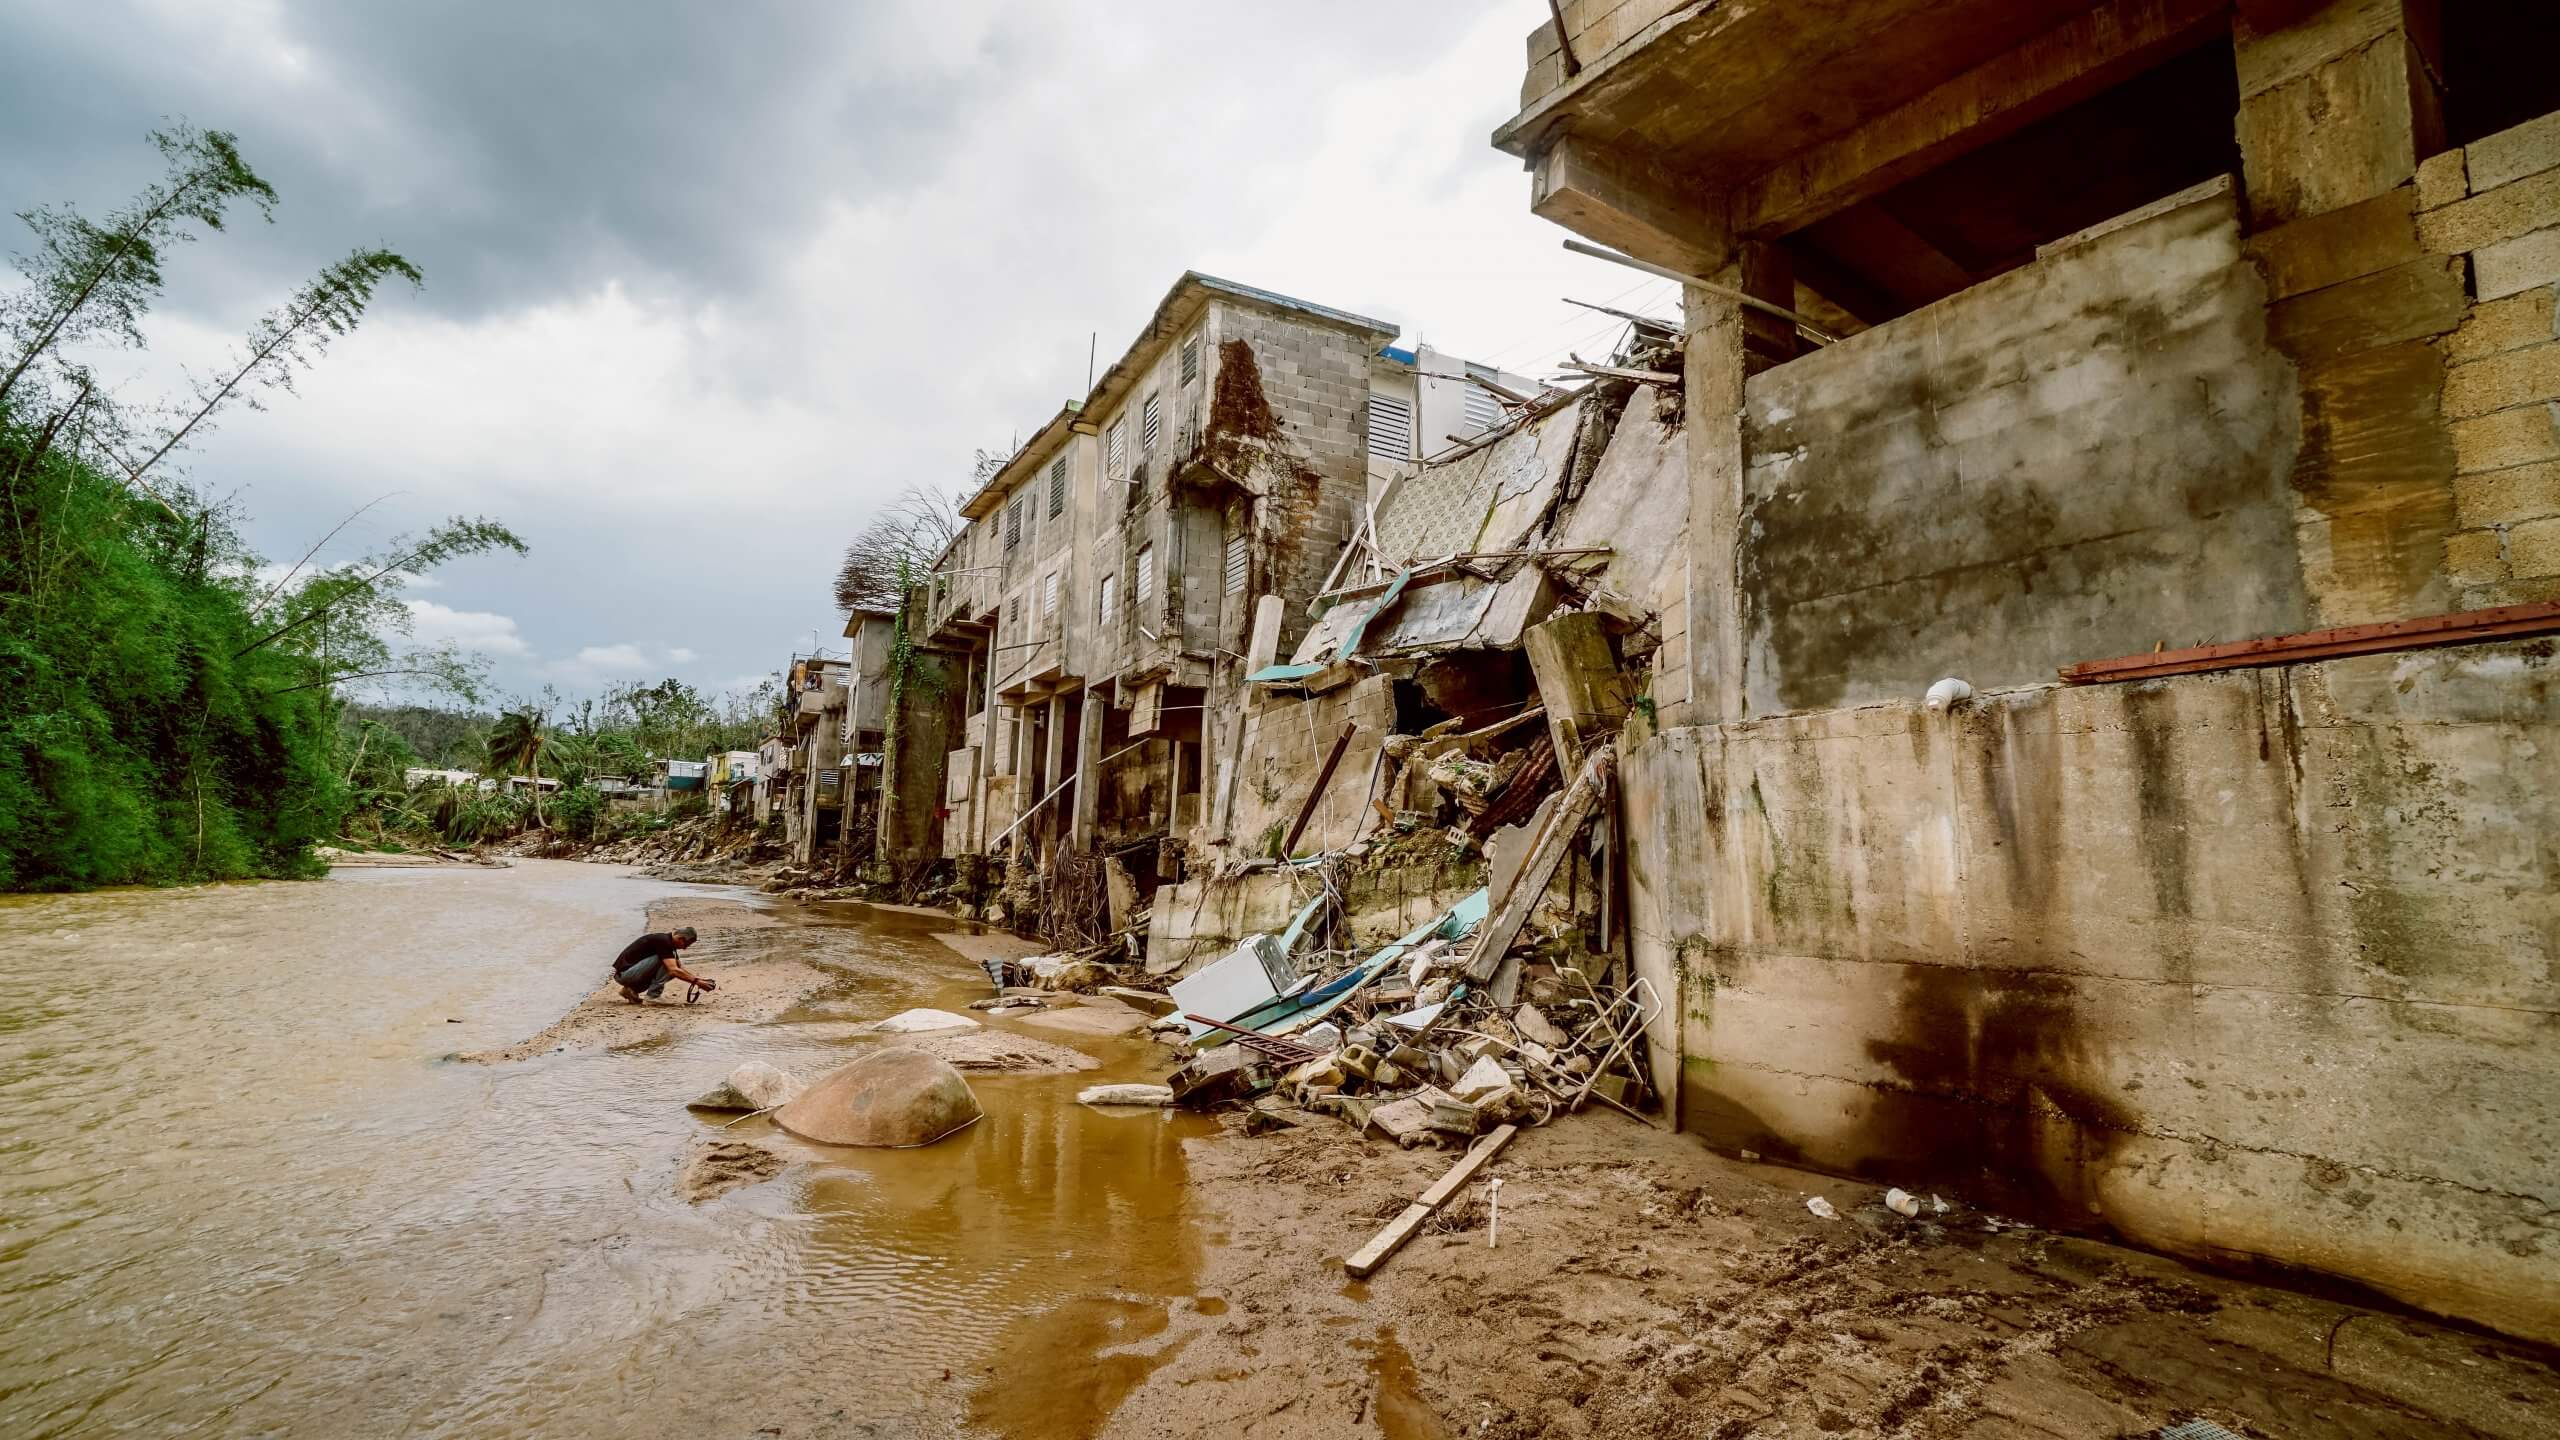
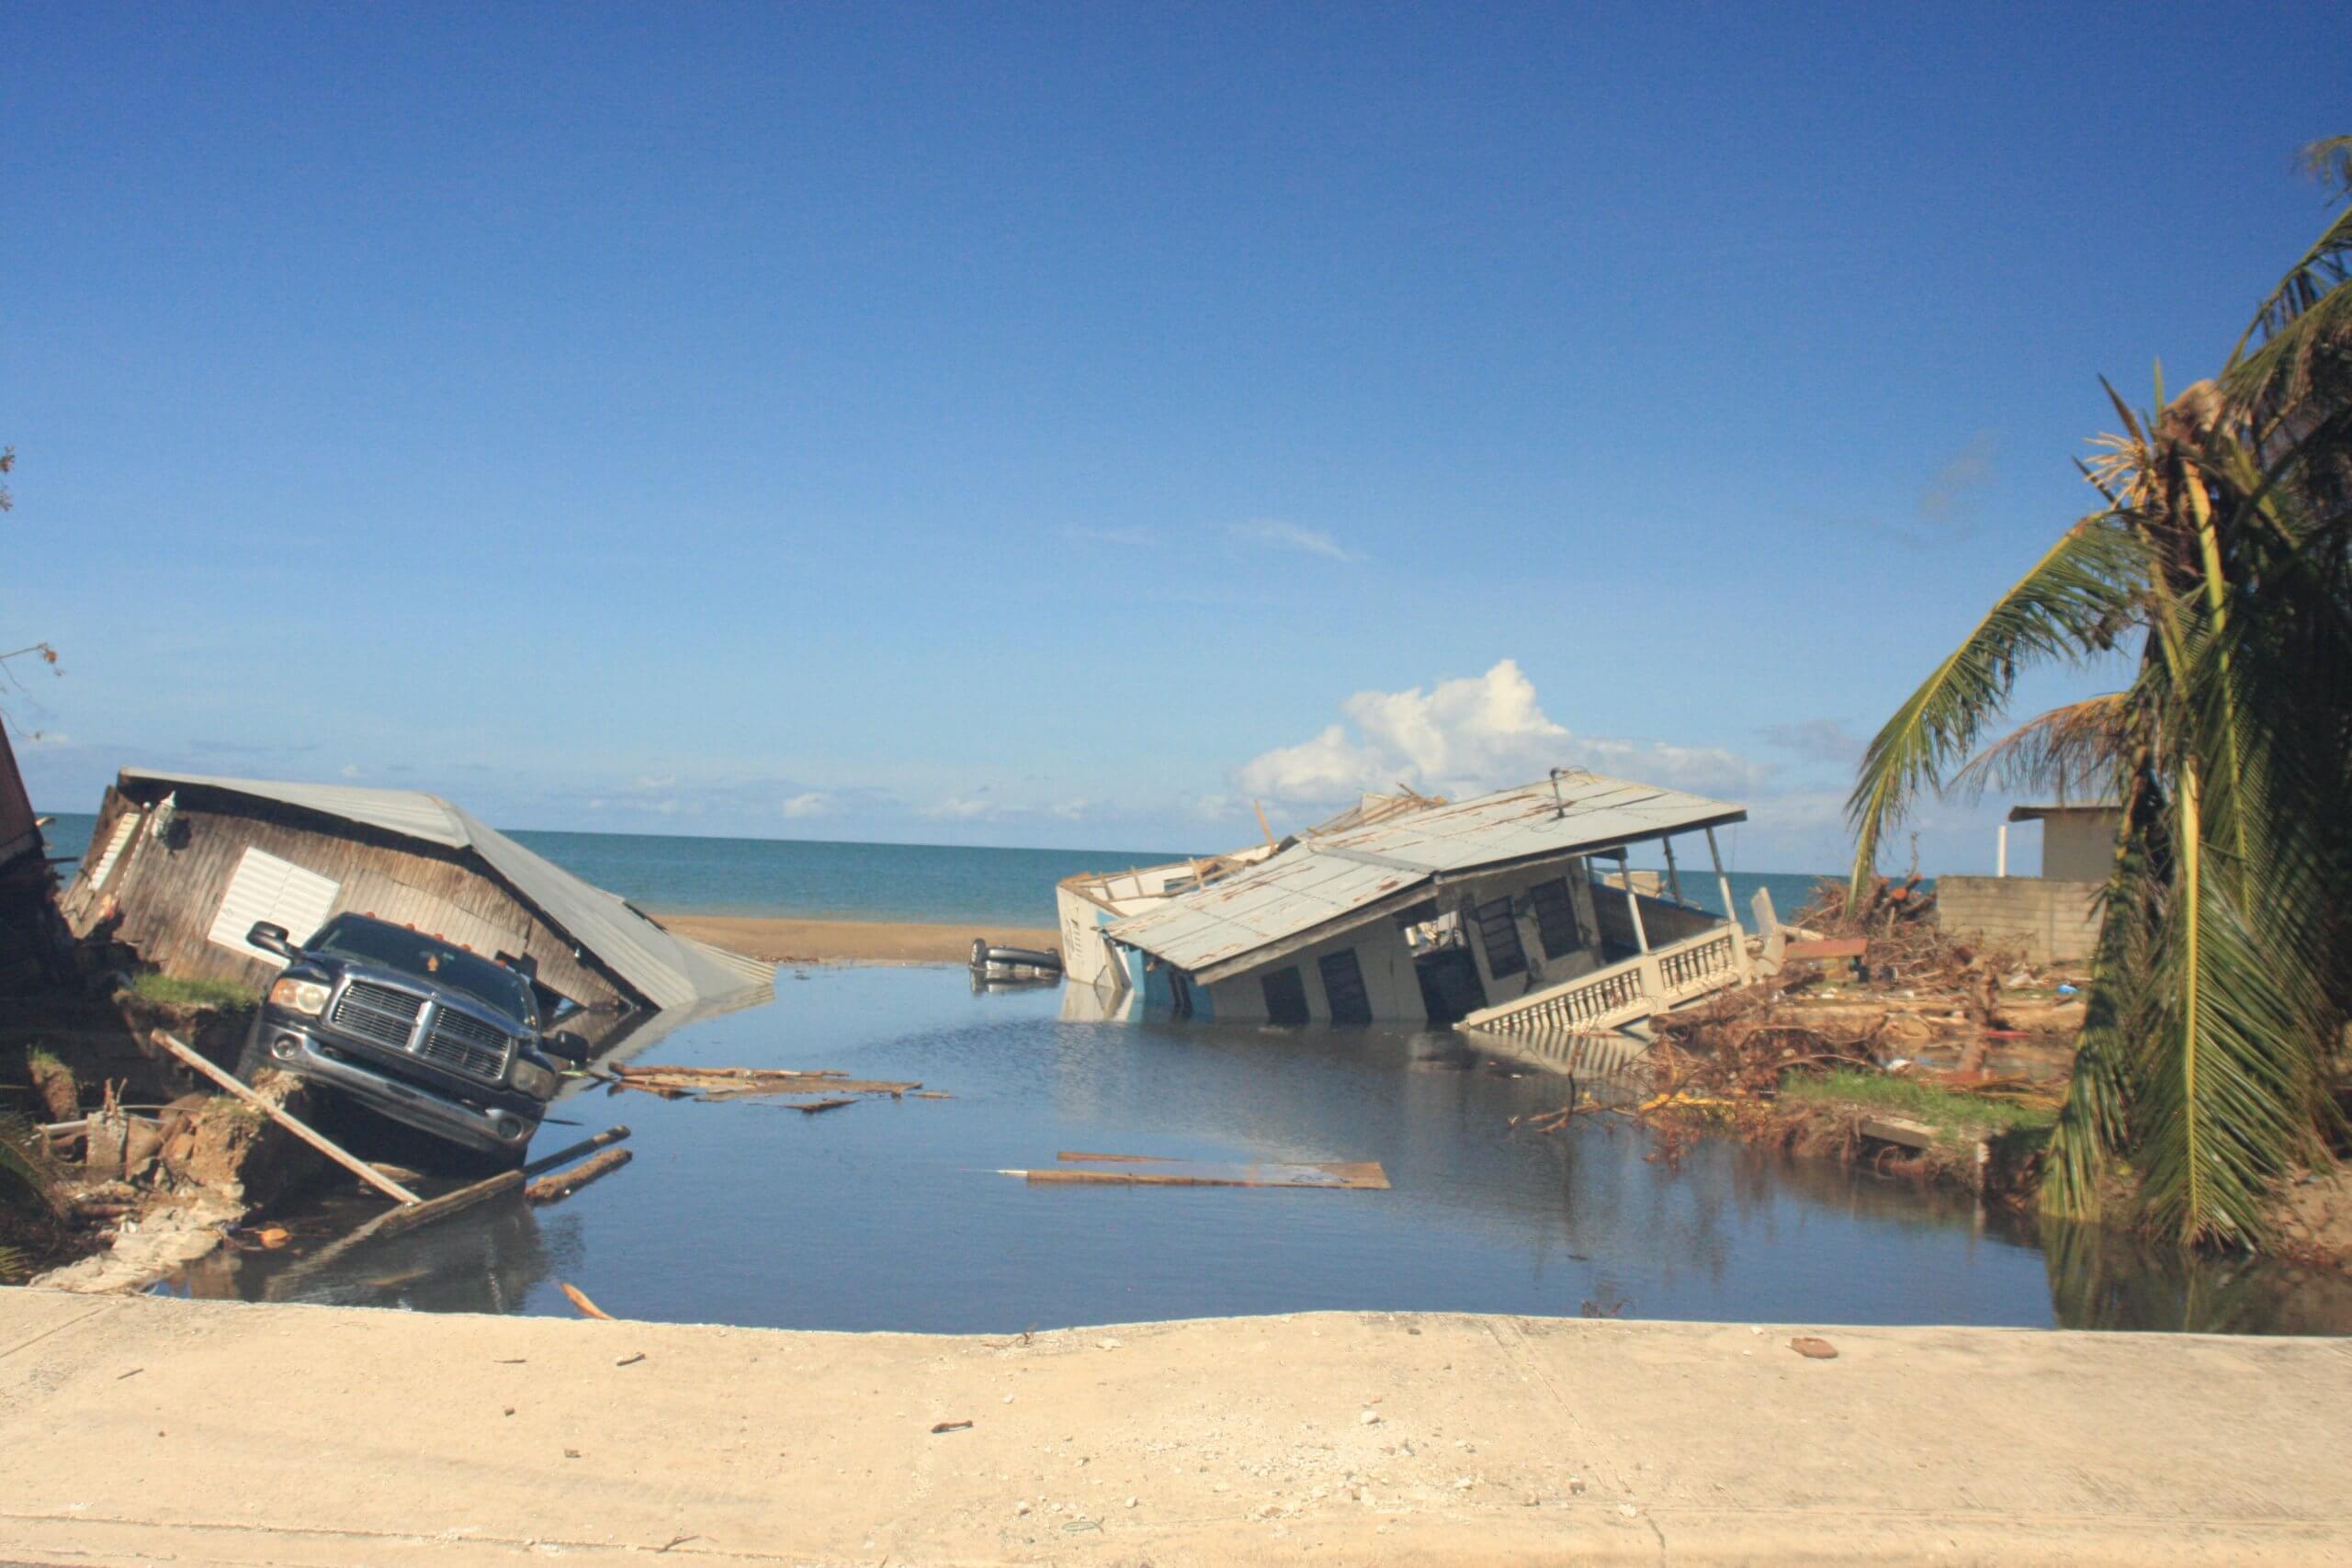
What happened: One of the more recent natural disasters on our list was also one of the most destructive. In fact, Hurricane Maria is one of the top 10 most intense Atlantic hurricanes ever recorded.21 Sadly, Puerto Rico was already dealing with Hurricane Irma’s aftermath, which hit the nation just weeks before Maria. Two in three people were already without electricity, and a third was without clean water because of that disaster.21
The hurricane caused an array of damage, including:
Meanwhile, the official death toll was shrouded in controversy. Government figures initially claimed that 64 people had died,21 but later said that 2,975 people had lost their lives due to the hurricane.22 Many media outlets and researchers criticised the initial number and the government was ordered to release information about the deaths caused by the hurricane.29
In 2018, Governor of Puerto Rico, Ricardo Rosselló Nevares, released a statement and said ‘The hurricane killed 2,975 people. This is a fact, and based on that fact, we adjust the official number of victims. It’s not time to deny what happened – it’s time to make sure it doesn’t happen again.’22
The current situation: Much like the official death toll, controversy has surrounded Hurricane Maria’s recovery efforts in Puerto Rico. In January 2020, Governor Wanda Vázquez Garced ordered a thorough investigation into the mishandling of supplies that were intended to be part of recovery efforts for Hurricane Maria. Supplies were found unused in a warehouse – they hadn’t been distributed to those who needed them when the disaster first struck.23
As a result, Carlos Acevedo, Commissioner of the State Bureau for Emergency Management and Disaster Administration (NMEAD), was fired.23
Meanwhile, data from the United States Census Bureau shows that Puerto Rico’s population decreased by 12,848 (or 3.9% of the population) in the year following Hurricane Maria, with higher rates of out-migration (people moving to mainland America) observed.24
As for recovery efforts, the Federal Emergency Management Agency (FEMA) in September 2020 said it would award USD$13 billion worth of infrastructure grants in Puerto Rico and that the territory would also receive USD$11.6 billion in federal funding.25 This includes:
FEMA also explains that more than 4,800 projects now have funding, which will help restore and rebuild:
Using various sources, we determined a list of worldwide natural disasters that caused more than USD$1 billion worth of damage in the year the disaster struck, where reliable data was available. We’ve endeavoured to include as many relevant disasters as possible based on reliable available data. However, we acknowledge that this list may not be comprehensive of all natural disasters.
The disasters analysed in this article includes floods, hurricanes, cyclones, hailstorms, fires, earthquakes and tsunamis. Using historical data, we determined what the damage caused by the natural disaster was in local currency, as well as in USD. We also converted these figures to understand how much the damage would cost in 2020 due to inflation.
To give us a better understanding of the financial impact at a country level, we took the financial cost of each individual disaster and presented it as a percentage of the relevant country’s GDP. GDP figures were based on World Bank Data for the year of the natural disaster.
We’ve also used statistics to help us determine the global cost per natural disaster between 2000 and 2019, the number of people impacted by natural disasters each year and the total number of natural disasters by year. The cost to individual countries was also taken into consideration.
Brought to you by Compare the Market: Making it easier for Australians to search for great deals on their Home & Contents Insurance.