The Burrow

Nov 3, 2022
A mortgage is a massive investment, quite likely the biggest financial asset (and commitment) many of us could ever have in our lives. Not only do you have to repay the amount borrowed plus interest, but there may be other fees as well.
With that in mind, it’s no wonder many homeowners will be concerned (to some degree) about house price growth in their country. A house is an investment as well as a home, and it’s reasonable to hope that you would get some return on investment should you decide to sell your home in the future.
There are a lot of factors to consider when buying a home and what will give you the best value for your money; the house itself, furnishings and amenities, architectural style, the sale price of the property, when you buy and when you sell, plus greater economic factors that influence house prices.
One factor that has a significant impact on the cost of a mortgage is the interest rate.
Comparing home loans can help you find a loan that has a more competitive home loan interest rate. Even what seems like a small difference can shave off hundreds or even thousands of dollars from the total cost of a mortgage.
You can also compare the other aspects of a home loan to search for mortgages with lower fees, or fee-free extra repayments to reduce the length or size of your loan. All of these aspects can help save you money, meaning you could get more back in your pocket.
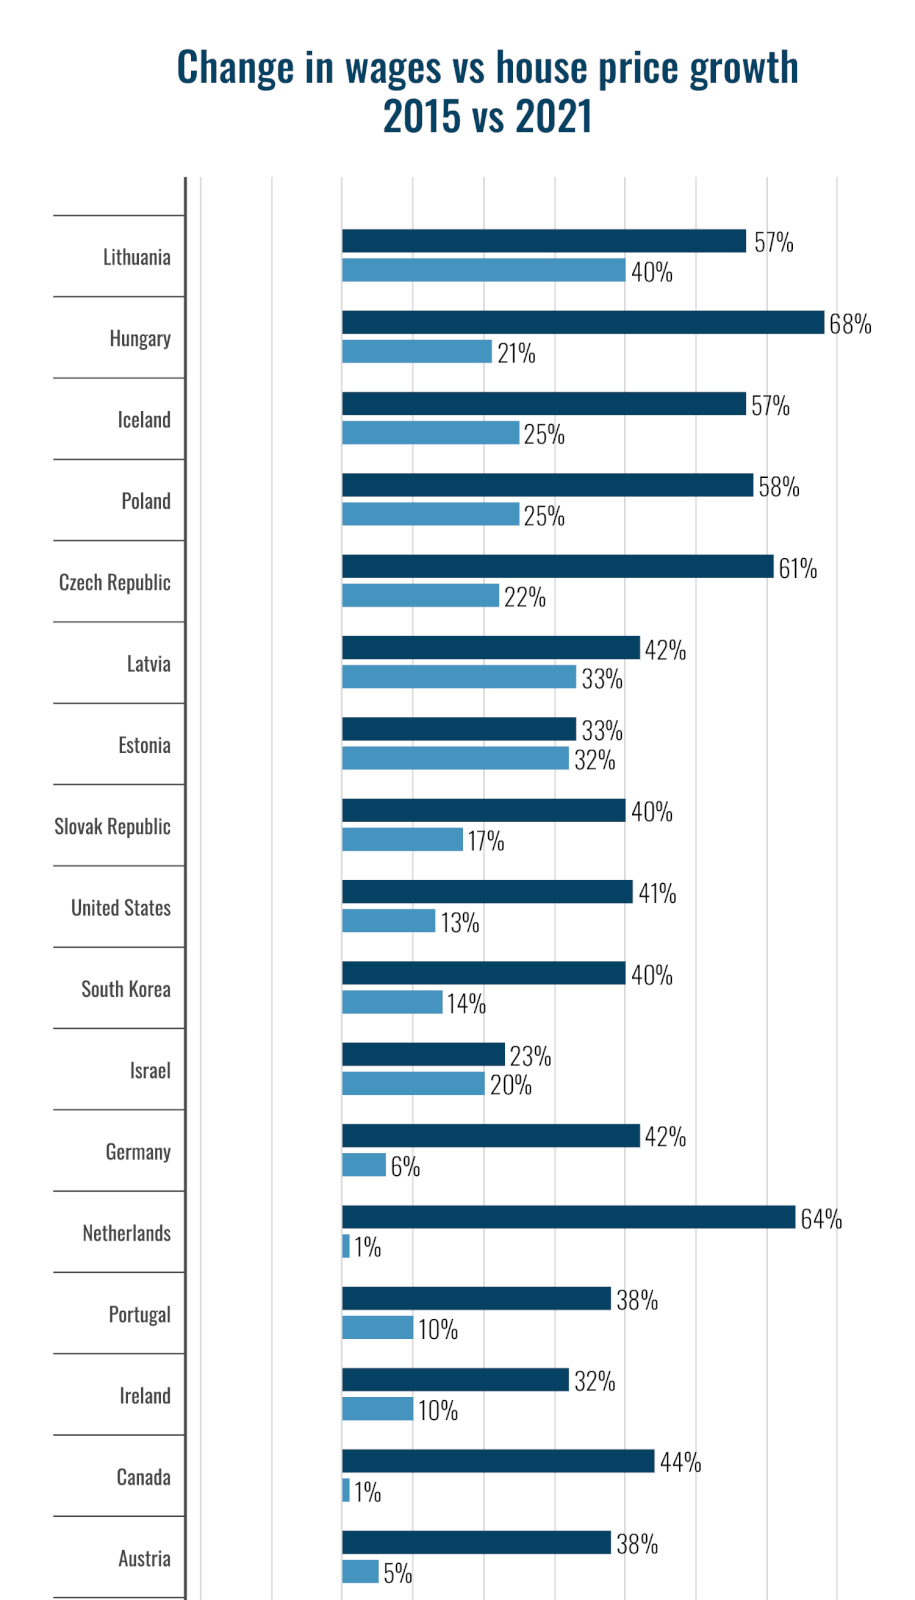
There are a variety of factors that can affect whether a particular country is good for a long-term investment on a new home or rental. We decided to look at two: changes in house price growth and the average wage.
These two factors provide a simple snapshot that is easy for anyone to understand – how quickly house prices have risen, and whether the average wage has increased alongside them – which can help prospective borrowers save more for a deposit.
When we combine the data to rank the nations on both house price growth and wages, the top three nations are:
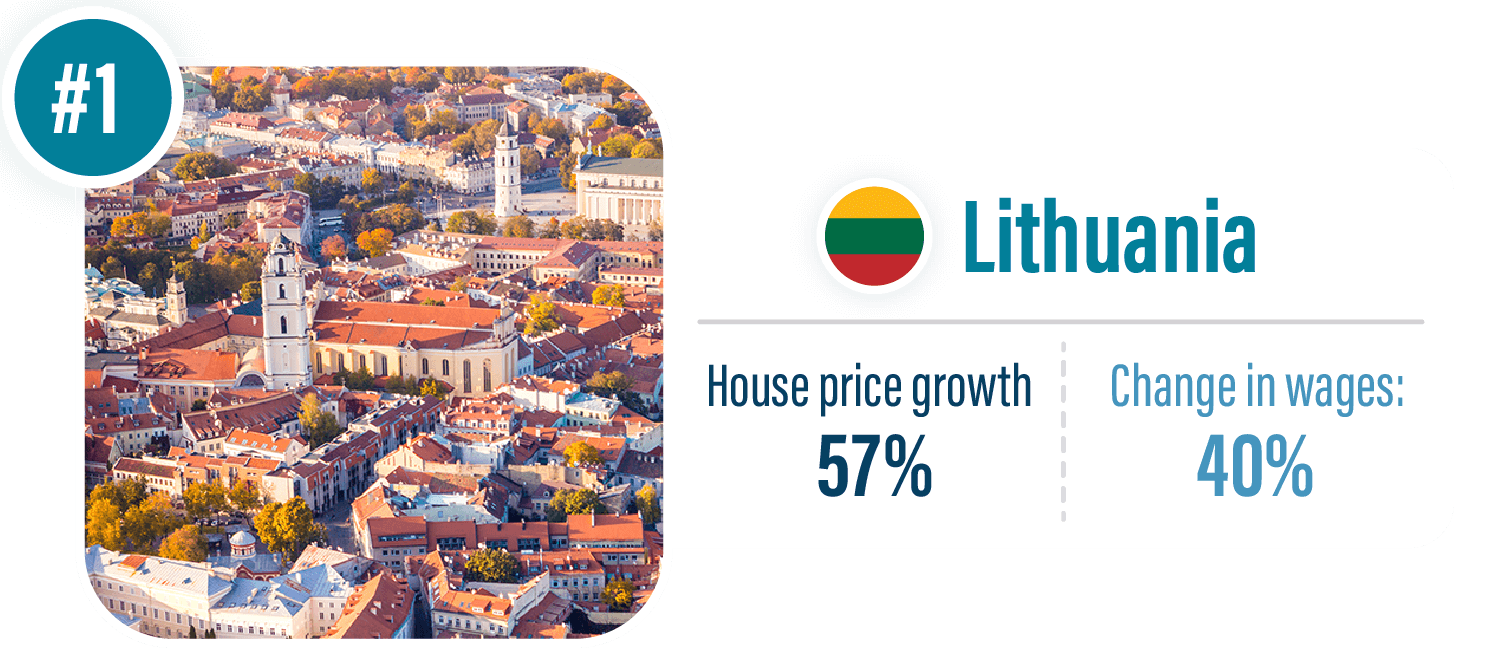
Lithuania stands out as the top nation when focusing on both house price growth and average wages. At first glance, it would appear the best nation for a return on investment for purchasing real estate.
The Lithuanian economy has been resilient in the face of inflation increases driven by supply chain issues and the war in Ukraine,1 and wages have seen strong growth. Compared to 2015, the average wage in 2021 was 39.74% higher, according to the Organisation for Economic Co-Development (OECD). The rate of house price growth increased 56.65% in 2021 compared to house price growth in 2015.
It’s worth noting that the Bank of Lithuania did state that inflation in 2022 has made the cost of living outpace wages,1 highlighting how important house price growth is for investors and prospective borrowers with plans to sell later on, as every dollar counts.

House prices in Hungary have grown consistently year-on-year since 2015. While prices rose rapidly from 2016 to 2019, the rate of growth was slowed by the COVID-19 pandemic but has continued to move upwards.2 Average wages have also grown strongly.3
Interestingly, in the first quarter of 2022 house prices in Hungary continued to rise despite sales numbers remaining relatively flat. House prices in Hungary since 2015 have seen some of the highest growth among all European countries, as noted by the Hungarian Central Statistical Office.4
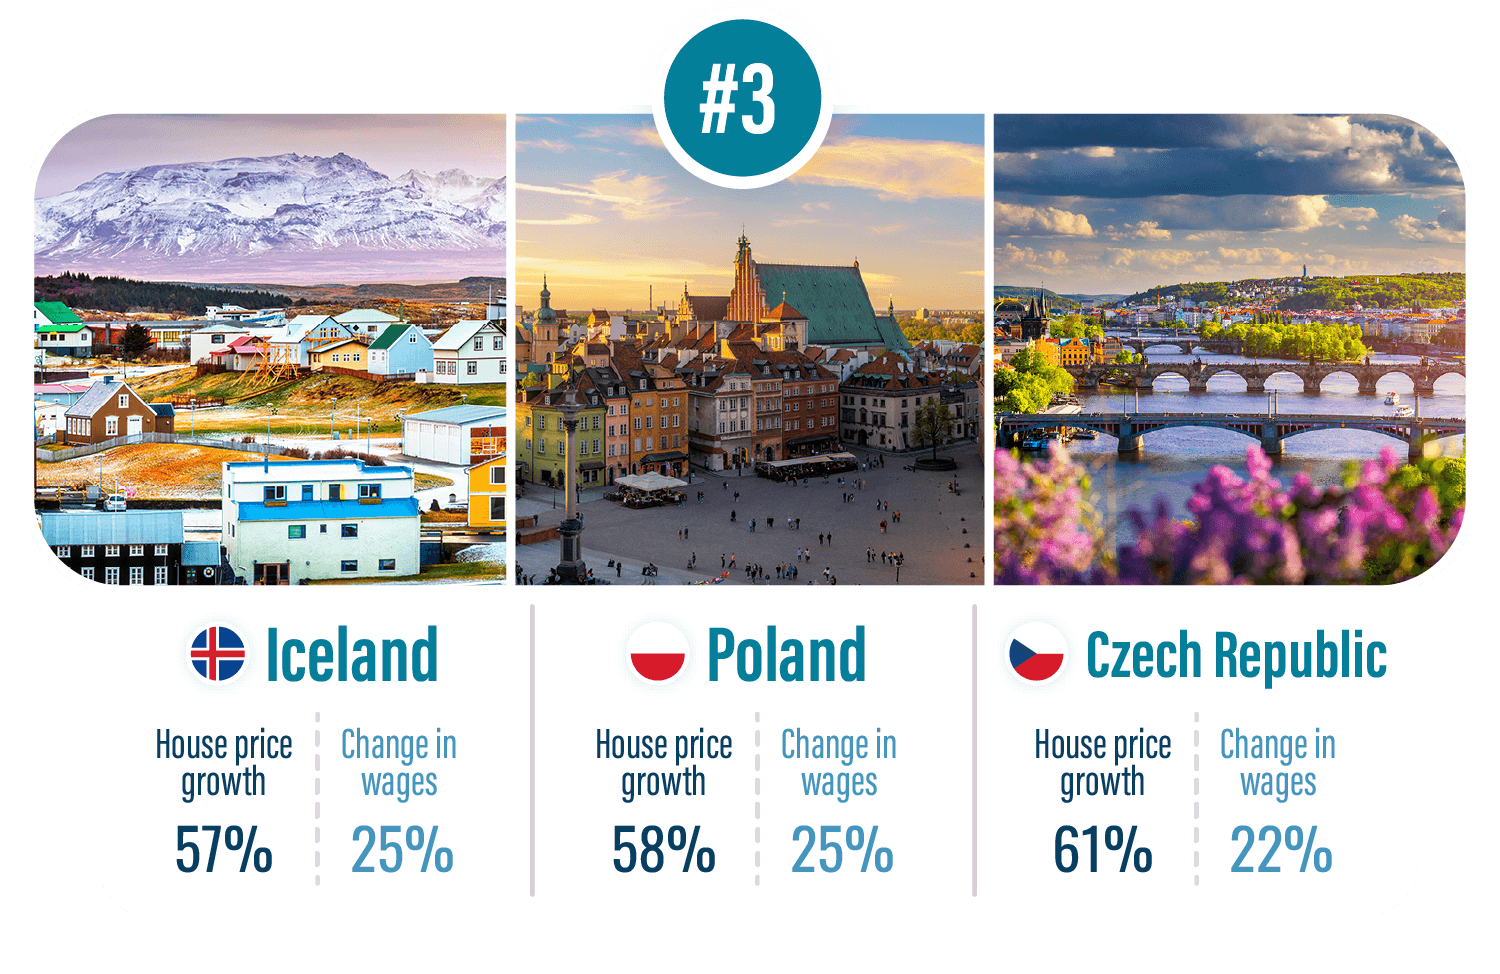
Iceland, Poland and Czech Republic all tied for third place when ranked on changes in house price growth and the average wage together in a single indexed figure, despite slight differences between each country for those two metrics. Iceland had the biggest increase in the average wage, but the smallest change in house price growth rate of the three nations. On the flipside, the Czech Republic had the lowest average wage of the three but the biggest jump in house price growth rate.
Here’s how the rest of the nations performed.
| Rank | Country | Combined ranking score |
| 1 | Lithuania | 18.48 |
| 2 | Hungary | 18.18 |
| 3 | Iceland | 17.87 |
| 3 | Poland | 17.87 |
| 3 | Czech Republic | 17.87 |
| 6 | Latvia | 16.96 |
| 7 | Estonia | 14.84 |
| 8 | Slovak Republic | 14.23 |
| 9 | United States | 13.32 |
| 10 | South Korea | 13.02 |
| 11 | Israel | 11.5 |
| 12 | Germany | 11.2 |
| 12 | Netherlands | 11.2 |
| 14 | Portugal | 10.9 |
| 15 | Ireland | 10.6 |
| 16 | Canada | 9.08 |
| 17 | Austria | 8.78 |
| 18 | New Zealand | 8.77 |
| 18 | Denmark | 8.77 |
| 20 | United Kingdom | 8.47 |
| 21 | Mexico | 8.18 |
| 22 | Slovenia | 7.87 |
| 22 | Sweden | 7.87 |
| 24 | Japan | 6.96 |
| 25 | Luxembourg | 6.36 |
| 26 | Switzerland | 6.06 |
| 27 | Australia | 6.05 |
| 28 | Finland | 5.14 |
| 28 | Spain | 5.14 |
| 30 | France | 4.84 |
| 31 | Norway | 4.84 |
| 32 | Belgium | 3.63 |
| 33 | Greece | 3.02 |
| 34 | Italy | 1.81 |
Ranking score is based on a combined, indexed score incorporating both the percentage change in house price growth from 2015 to 2021 and the change in average wages from 2015 to 2021.
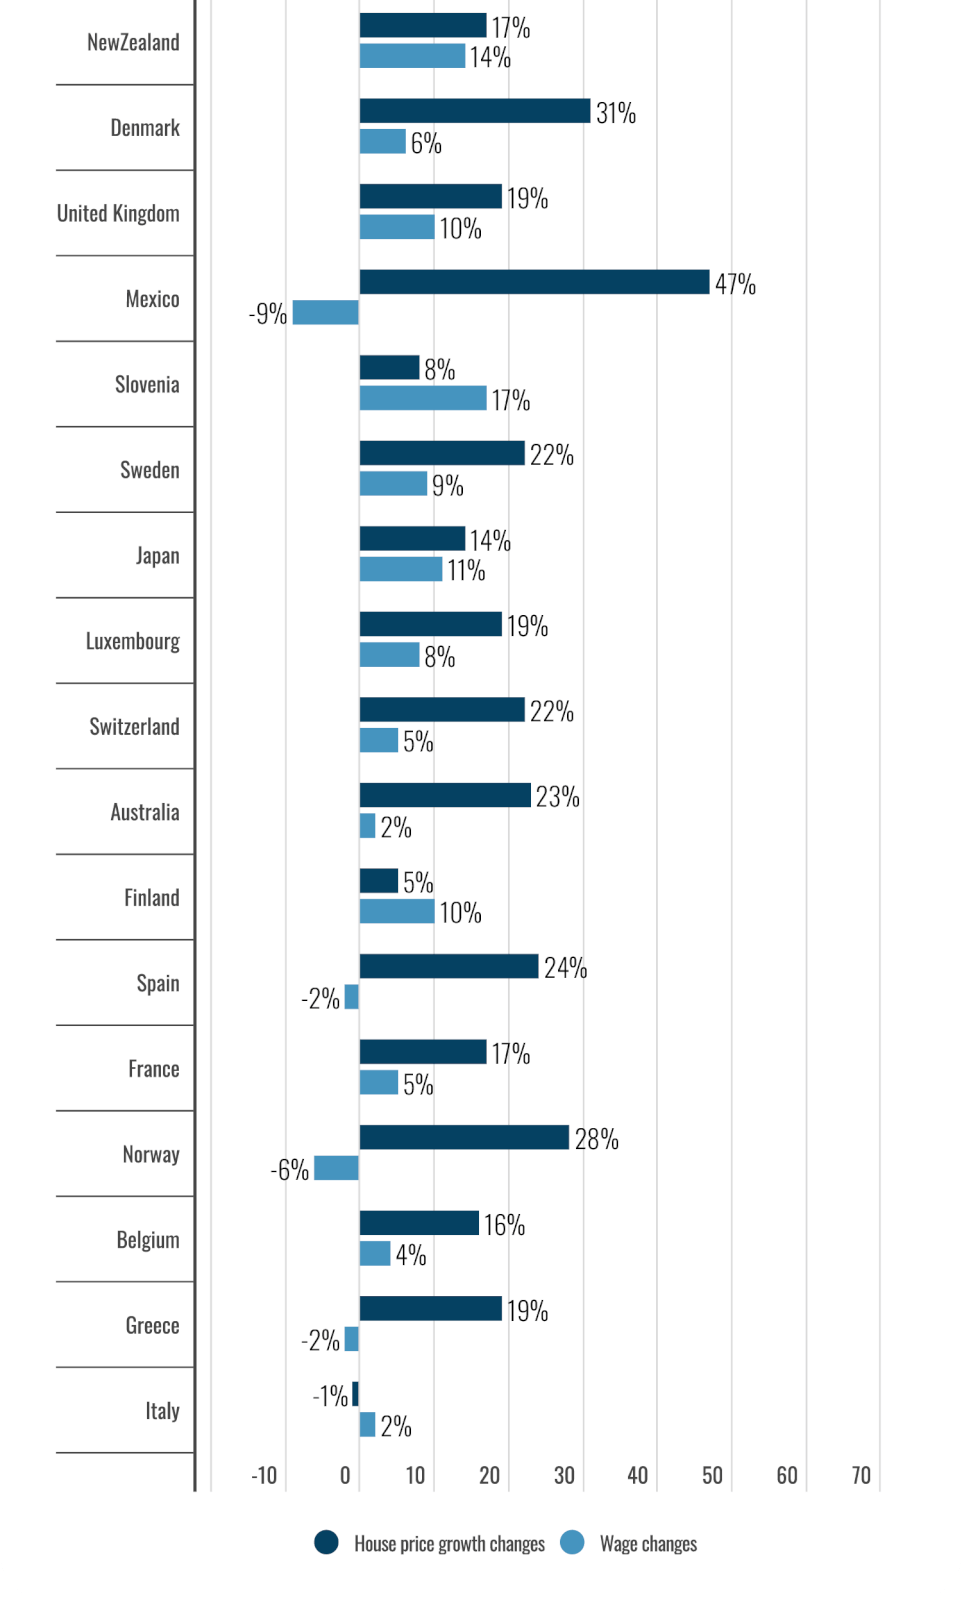
While a comparison from 2021 to six years ago shows which nations are experiencing the biggest increases in growth right now, it’s also important to look back year-on-year and see how house prices have changed within each country.
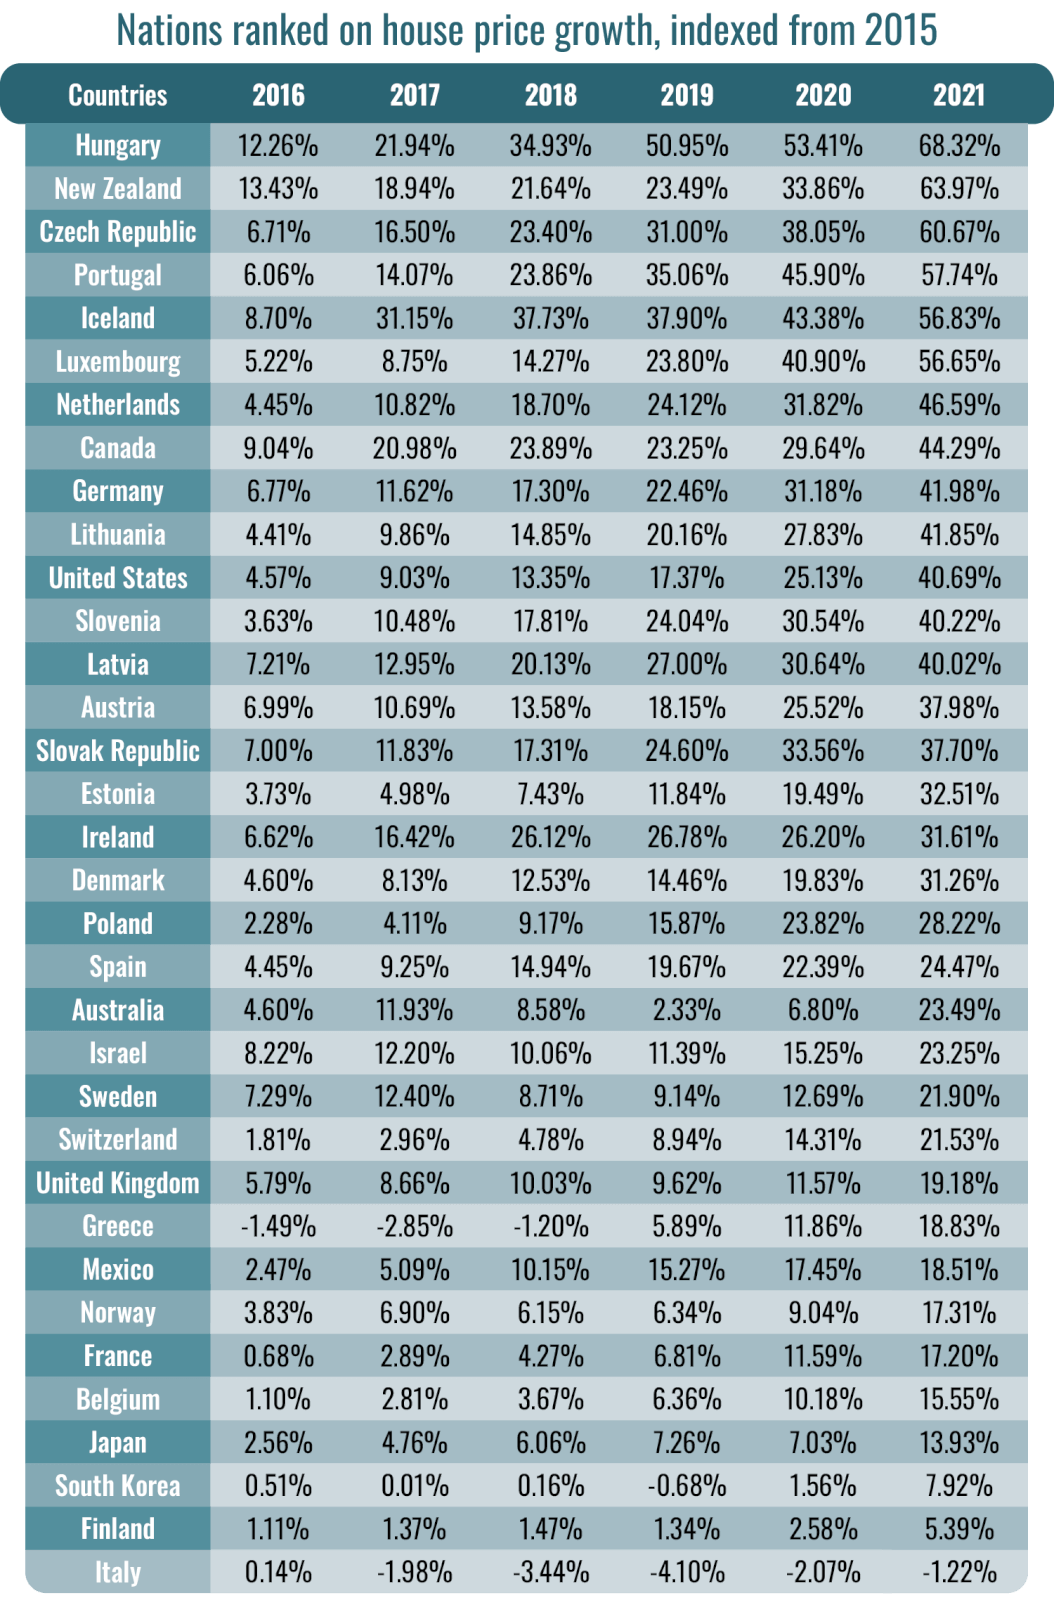
N.B. Each year is measured to a baseline figure in 2015. These percentages represent a change in growth rate. A negative number means that the growth rate has slowed, but prices are still increasing.
Past performance is not indicative of future performance – comparing rate of growth as a percentage. A nation could have negative numbers and still have actual house prices be higher than in the past – the rate of growth has just slowed down.
The house price data was sourced from the OECD and represents changes to the growth in house prices, based on an indexed figure. Each year is individually compared to a baseline figure from 2015, not the year before. As prices are always changing, the percentage changes in growth in comparison to 2015 are a useful indicator of how house prices have performed in recent years.
The data on average wages were also sourced from the OECD. The percentage difference in wages was done by comparing the 2021 average wage figure with the 2015 average wage figure.
These two data points were then indexed and combined into a single score so each nation could be given a ranking.
Data sets:
Housing prices. OECD Data, Organisation for Economic Co-operation and Development. 2022.
Average wages. OECD Data, Organisation for Economic Co-operation and Development. 2022.
1 Macroeconomic projections: June 2022. Lietuvos Bankas Eurosistema. 2022.
2 Housing prices, housing price index, Quarter 1 2021. Hungarian Central Statistical Office. 2021.
3 Data of all household’s income and consumption. Hungarian Central Statistical Office. 2022.
4 Housing prices, housing price index, Q1 2022. Hungarian Central Statistical Office. 2022.
5 Total median income by education. Statistics Iceland. 2022.
6 House prices to keep rising in the near term. Íslandsbanki. 2022.
7 Statement of the Monetary Policy Committee 24 August 2022. Central Bank of Iceland. 2022.