The Burrow
Mar 15, 2023
Whilst there will always be a market for doer-uppers, the trend for moving into a home that’s completely modernised has never been more popular.
However, buying a renovated home with a high-quality finish can often be a lot pricier than a property that needs a little love. With that being said, if you’re considering moving home soon, then you could see the value of your property increase by investing in some home improvements.
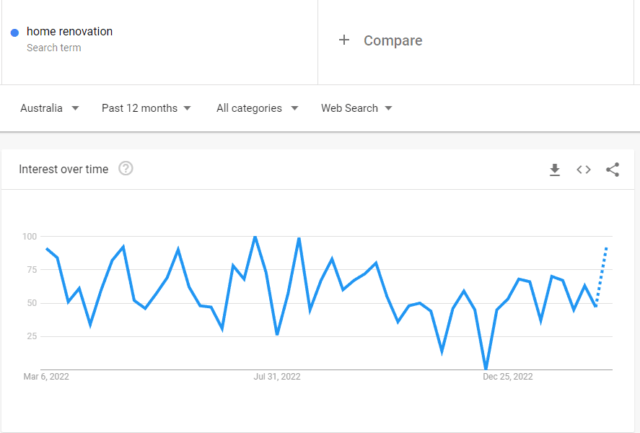
With searches for “home renovation” on the rise1 in Australia, it’s clear more people are thinking about modernising their homes. With that in mind, the home loan experts at Compare the Market have crunched the data across Australia and the USA, to discover the cheapest areas for home improvements.
We did this by looking at several factors, including median home values, the average amount spent on home improvements, the average wages of construction workers, and more.
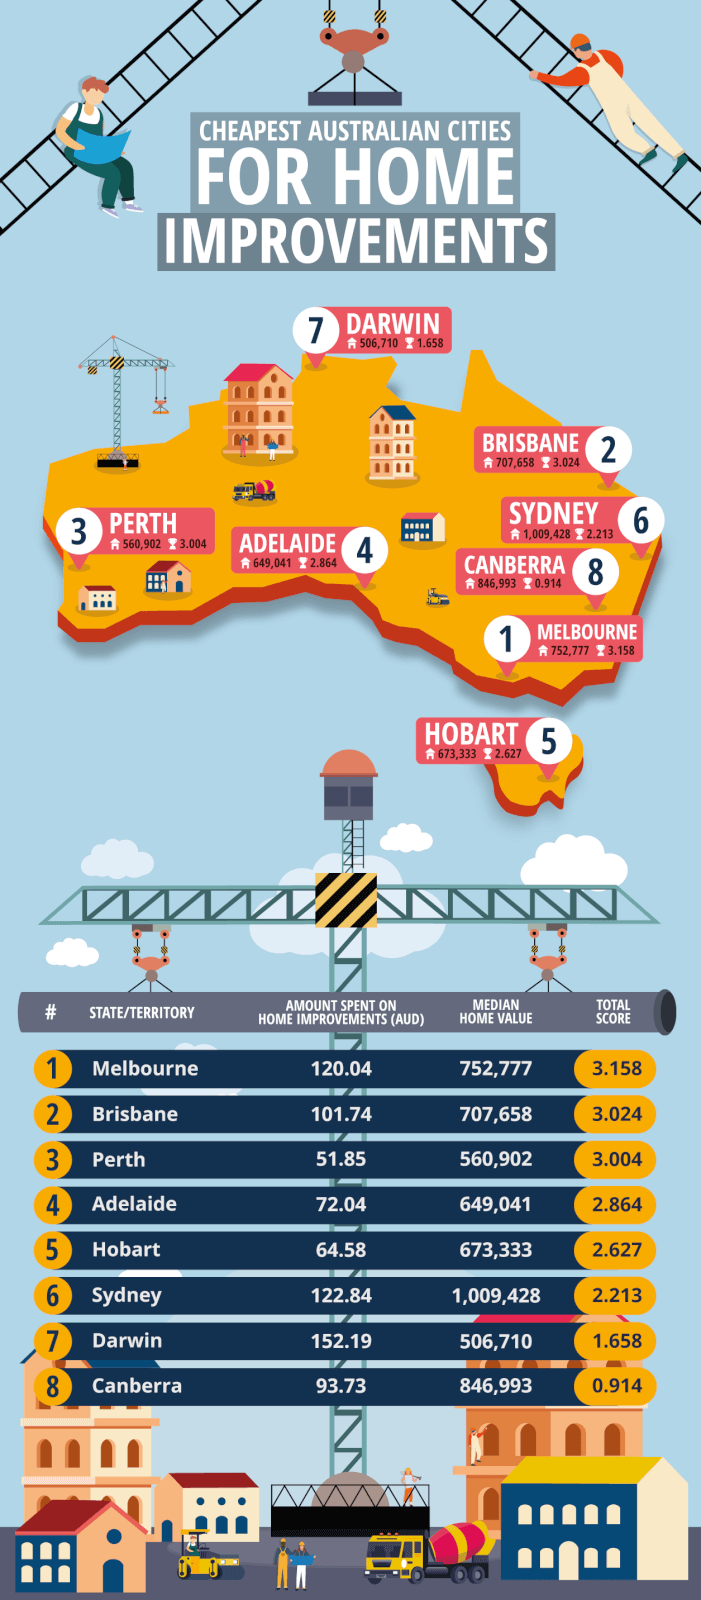
Where in Australia could you see the biggest profit from flipping houses? Find out below…
Melbourne comes in first place, with homes averaging at AU$752,777. With residents spending around AU$120.04 every quarter on home improvements, there are lots of opportunities to flip your home and sell it for a profit.
Not only that, but Melbourne has the most hardware stores, at 481, alongside the highest number of construction workers per 1,000 people, at 54.26; meaning whether you want to do it yourself or get someone else to sort it for you, you’ve got plenty of options.
In second place is Brisbane, with the average resident spending AU$101.74 on home improvements every three months. With 440 hardware stores located across the region, there’s a lot of opportunities to shop around; and with Brisbane’s properties valuing at an average of AU$707,658, some home improvements here and there should see you make a decent profit.
House prices are amongst the most affordable in the country, with properties in Perth averaging at AU$560,902. So, if you’re looking for your first property to flip, Western Australia’s capital could be the ideal option.
Residents in this area spend the least on home improvements compared to the rest of the country, at an average of AU$51.85, which suggests one of two things: either a lot of houses aren’t modernised, or the cost of updating your home is cheaper than average. Either way, you could be onto a real winner if you want to do up a house here.
Wages for construction workers are the second lowest in the country, at an average of AU$1,622.90 a week, and with 45.56 employees for every 1,000 people, you’ll be spoilt for choice when looking to hire a construction worker at an affordable price.
Not only that, but Adelaide is home to the third cheapest properties on average, with properties valuing at around AU$649,041.
Hobart rounds off our top five cheapest cities for home improvements, with the cost of the average property in the city standing at AU$673,333.
Residents spend the second lowest amount on home improvements, at around AU$64.58 per quarter – perhaps because there are more limited options to try out DIY, with just 67 hardware stores across the state.
Saying that, hiring construction workers is extremely affordable here, with average weekly wages coming in at around AU$1,568.50, so if you’re wanting to flip a home in the Tasmanian capital, hiring an expert may be the answer.
Sydney comes in sixth place, scoring lower because its houses are the most expensive, with Sydney properties valuing at an average of AU$1,009,428. Darwin comes in seventh place, with the cheapest properties on our list, at just AU$506,710 on average showing a huge opportunity to make some money. However, it has the fewest number of hardware stores at 30, alongside the smallest proportion of construction workers per 1,000 people, at 43.25.
Coming in last place is Canberra, with house prices the second most expensive on our list, at an average value of AU$846,993, alongside the highest average weekly wages of construction workers, at AU$1,983.70, meaning you’re less likely to make a profit.
Moving over to the USA, we analysed a few different factors, including looking at the average value of a loan used to cover home improvements, alongside average hourly labourer wages, and the median age of houses.
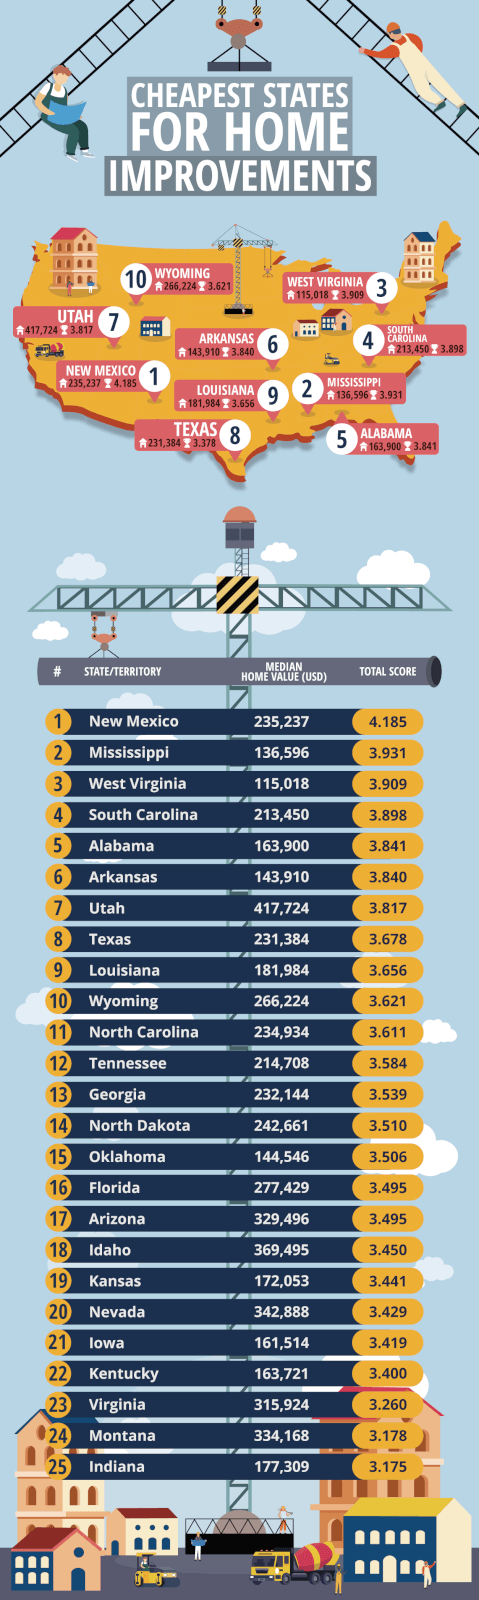
So, if you want to make some extra cash, it’s time to find out the top states to flip a home and make some money.
In first place is New Mexico, with hourly labourer wages the fourth lowest in the country, at US$16.76 on average, alongside the highest number of construction workers per 1,000 people, at 13.37.
Mississippi comes in second place, with the average age of a house standing at 36. It has the second cheapest house prices, at an average of US$136,596, alongside the joint second cheapest home improvement loan values, at US$45,000, meaning there are plenty of opportunities to make a profit on your home, here.
With the average house valuing at just US$115,018, West Virginia has the cheapest homes in the whole of the USA, with average loan values for home improvements standing at US$45,000.
Plus, with 10.57 construction employees per 1,000 people, there are lots of opportunities to hire an expert, with the cost of doing your home up relatively affordable.
In fourth place is South Carolina, with homes here some of the newest, at 32 years on average. It has the eighth highest number of construction workers per 1,000 people, at 9.12, and the typical loan value for home improvements taken out is US$55,000, which is pretty standard across several other states, including Utah, Montana, Michigan, and Pennsylvania.
The deep southern state of Alabama rounds off our top five cheapest states for home improvements. With the average value of a home standing at US$163,900, (the seventh cheapest in the country), as well as the second cheapest hourly labourer wages at US$15.61, making it a great place to add value to your home, and make a profit.
As Stephen Zeller, General Manager of Money at Compare the Market states: “Updating your kitchen or bathroom can add a considerable amount to your property when selling, but that’s not the only thing you can do. Replacing old carpets with some fresh flooring, or giving your walls a new lick of paint can help to modernise it, and make it look more appealing to prospective buyers, which could help you to sell your home for more.”
Saving for a renovation can be tough, especially if you’re looking to update some big-ticket items such as the kitchen or a bathroom. One way you could cut back on extra fees, is by reviewing your current home loan and potentially looking at refinancing . By comparing the current loans on the market with your own and making a switch, you could find a deal with fewer fees and better rates, meaning the money you save could go towards improving your home.
This dataset provides two rankings, one for US states, and one for Australian states/territories. These rankings look at five different factors each, to determine the cheapest locations for home improvements within the US and Australia. Once the data for the factors was collected, the factors were then normalised, to provide each factor with a score between 0 and 1. The normalised values were then summed, to give each location a total score out of 5. The locations were then ranked from highest to lowest, based on their total scores.
The US factors used are as follows:
The Australian factors used are as follows:
The US factors were indexed as follows:
The Australian factors were indexed as follows:
All data is correct as of 09/02/2023.
Source in text
Research sources
US Median Home Age – https://housemethod.com/home-warranty/median-home-age-us/
US Median Home Value – https://constructioncoverage.com/research/cities-investing-most-in-home-improvements-2021
US Median Home Improvement Loan Value – https://constructioncoverage.com/research/cities-investing-most-in-home-improvements-2021
US Median Labourer Wage – https://www.bls.gov/oes/current/oes472061.htm
US Number of Construction Workers – https://www.bls.gov/oes/current/oes472061.htm
AU Median Home Value – https://www.corelogic.com.au/__data/assets/pdf_file/0021/12954/CoreLogic-home-value-index-Jan-23-FINAL.pdf
AU Amount Spent on Home Improvements – https://www.abs.gov.au/statistics/industry/building-and-construction/construction-work-done-australia-preliminary/sep-2022#data-download (Table 4)
AU Number of Hardware Stores – https://www.yellowpages.com.au/search/listings?clue=hardware+store
AU Mean Labourer Wage – https://www.abs.gov.au/statistics/labour/earnings-and-working-conditions/average-weekly-earnings-australia/may-2022#data-download
AU Number of Construction Employees – https://www.abs.gov.au/statistics/labour/employment-and-unemployment/labour-force-australia-detailed/latest-release (Table 05)
AU Population Data – https://www.abs.gov.au/statistics/people/population/national-state-and-territory-population/latest-release