The Burrow
Sep 13, 2021
At some point in your life, you may have heard that a home loan is the largest financial commitment you will make in your life. As it turns out, this rings quite true in Australia.
According to OECD data, the average Australian household has debt of around 210.07% of their net yearly income.¹ In layman’s terms, Australians are spending a lot more than we’re earning. But why is that?
Well, when breaking down debt, it’s important to understand where it comes from. In 2015-16, The ABS found home loans made up 56% of total household debt, and other property loans 33%.¹³ They also found credit card debt to be the most common in Australia, held by 55% of households.¹³ And while it’s not easy to pin down the source of all of Australia’s debt, our property market and spending habits likely have something to do with it.
In fact, in late 2020 we saw a 1% ($24.2b) rise in household debt, driven mostly by housing loans and short-term debt, such as credit cards.14 This could be attributed to the surplus of housing and falling rents in Sydney and Melbourne, and the easing of lockdown measures which encouraged households to spend.
What’s important to understand is that your household debt could be determined by more than simply your income and expenditure. Where you live, and how much it costs to live there, can also play some role in dictating your spending.
With that in mind, the home loan experts at Compare the Market were curious to see how household debt varies around the world in comparison to Australia. So, we’ve presented data from the Organisation for Economic Co-operation and Development (OECD), revealing the countries with the highest and lowest household debt, based on the latest available data.
Click through the tabs below to see the top and bottom three countries with household debt!
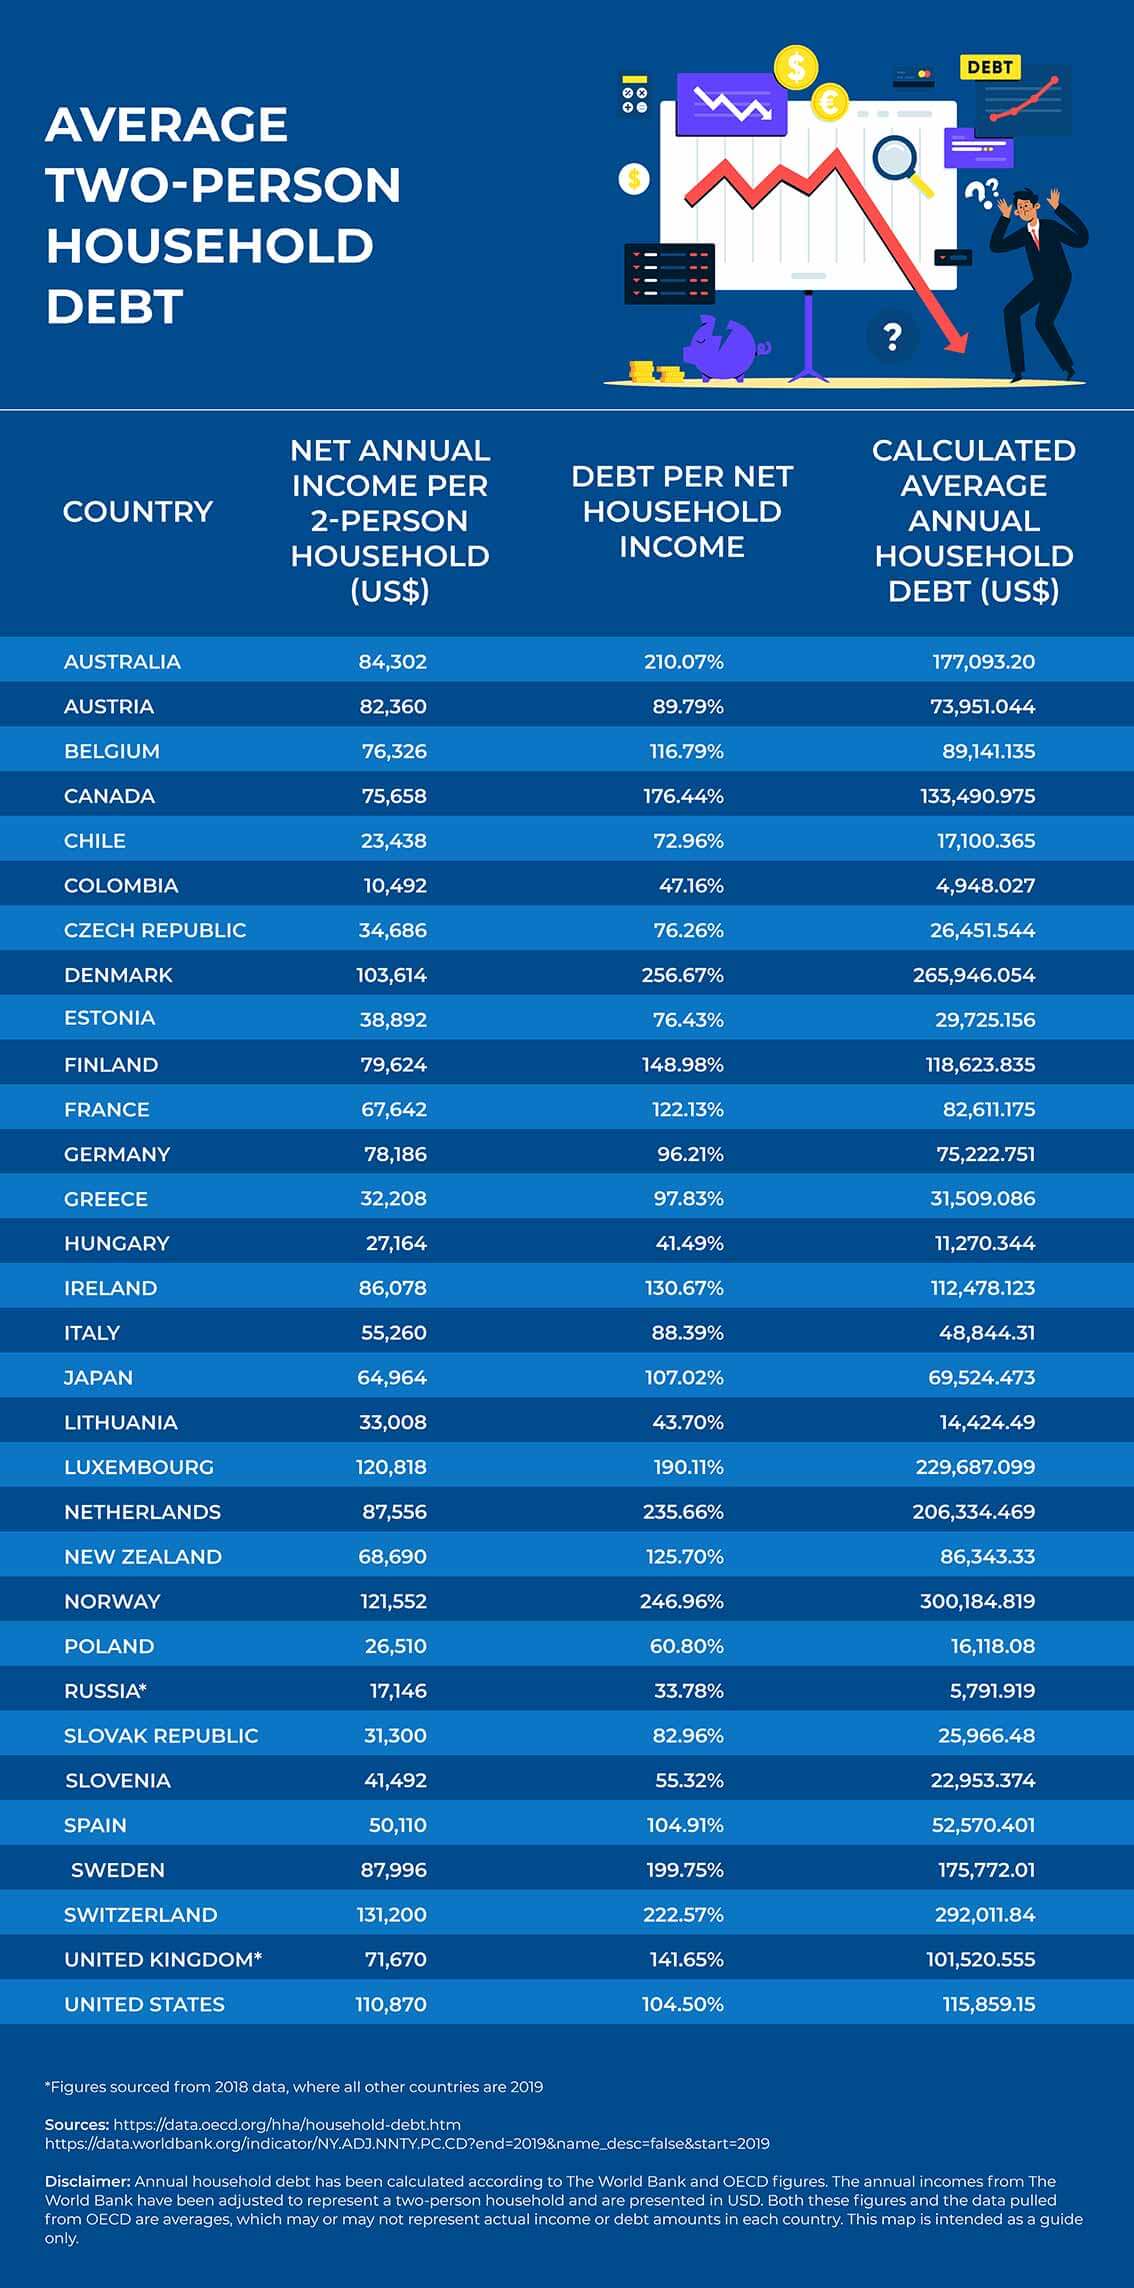
The table below reveals the portion of net disposable income each household has in debt and orders it from highest household debt to lowest. These figures are averages and may not be indicative of what your debt looks like. OECD defines disposable income as the income of households (eg. wages and salaries), after considering the payment of taxes and social contributions (if applicable).
If, for example, you’re a household in Australia with a combined net disposable income of $100,000, this data suggests your debt is around $210,070.¹ Seems high? Remember that this could include your mortgage, investor debt, loans and credit card debt.
Here’s how the rest of the world fares:
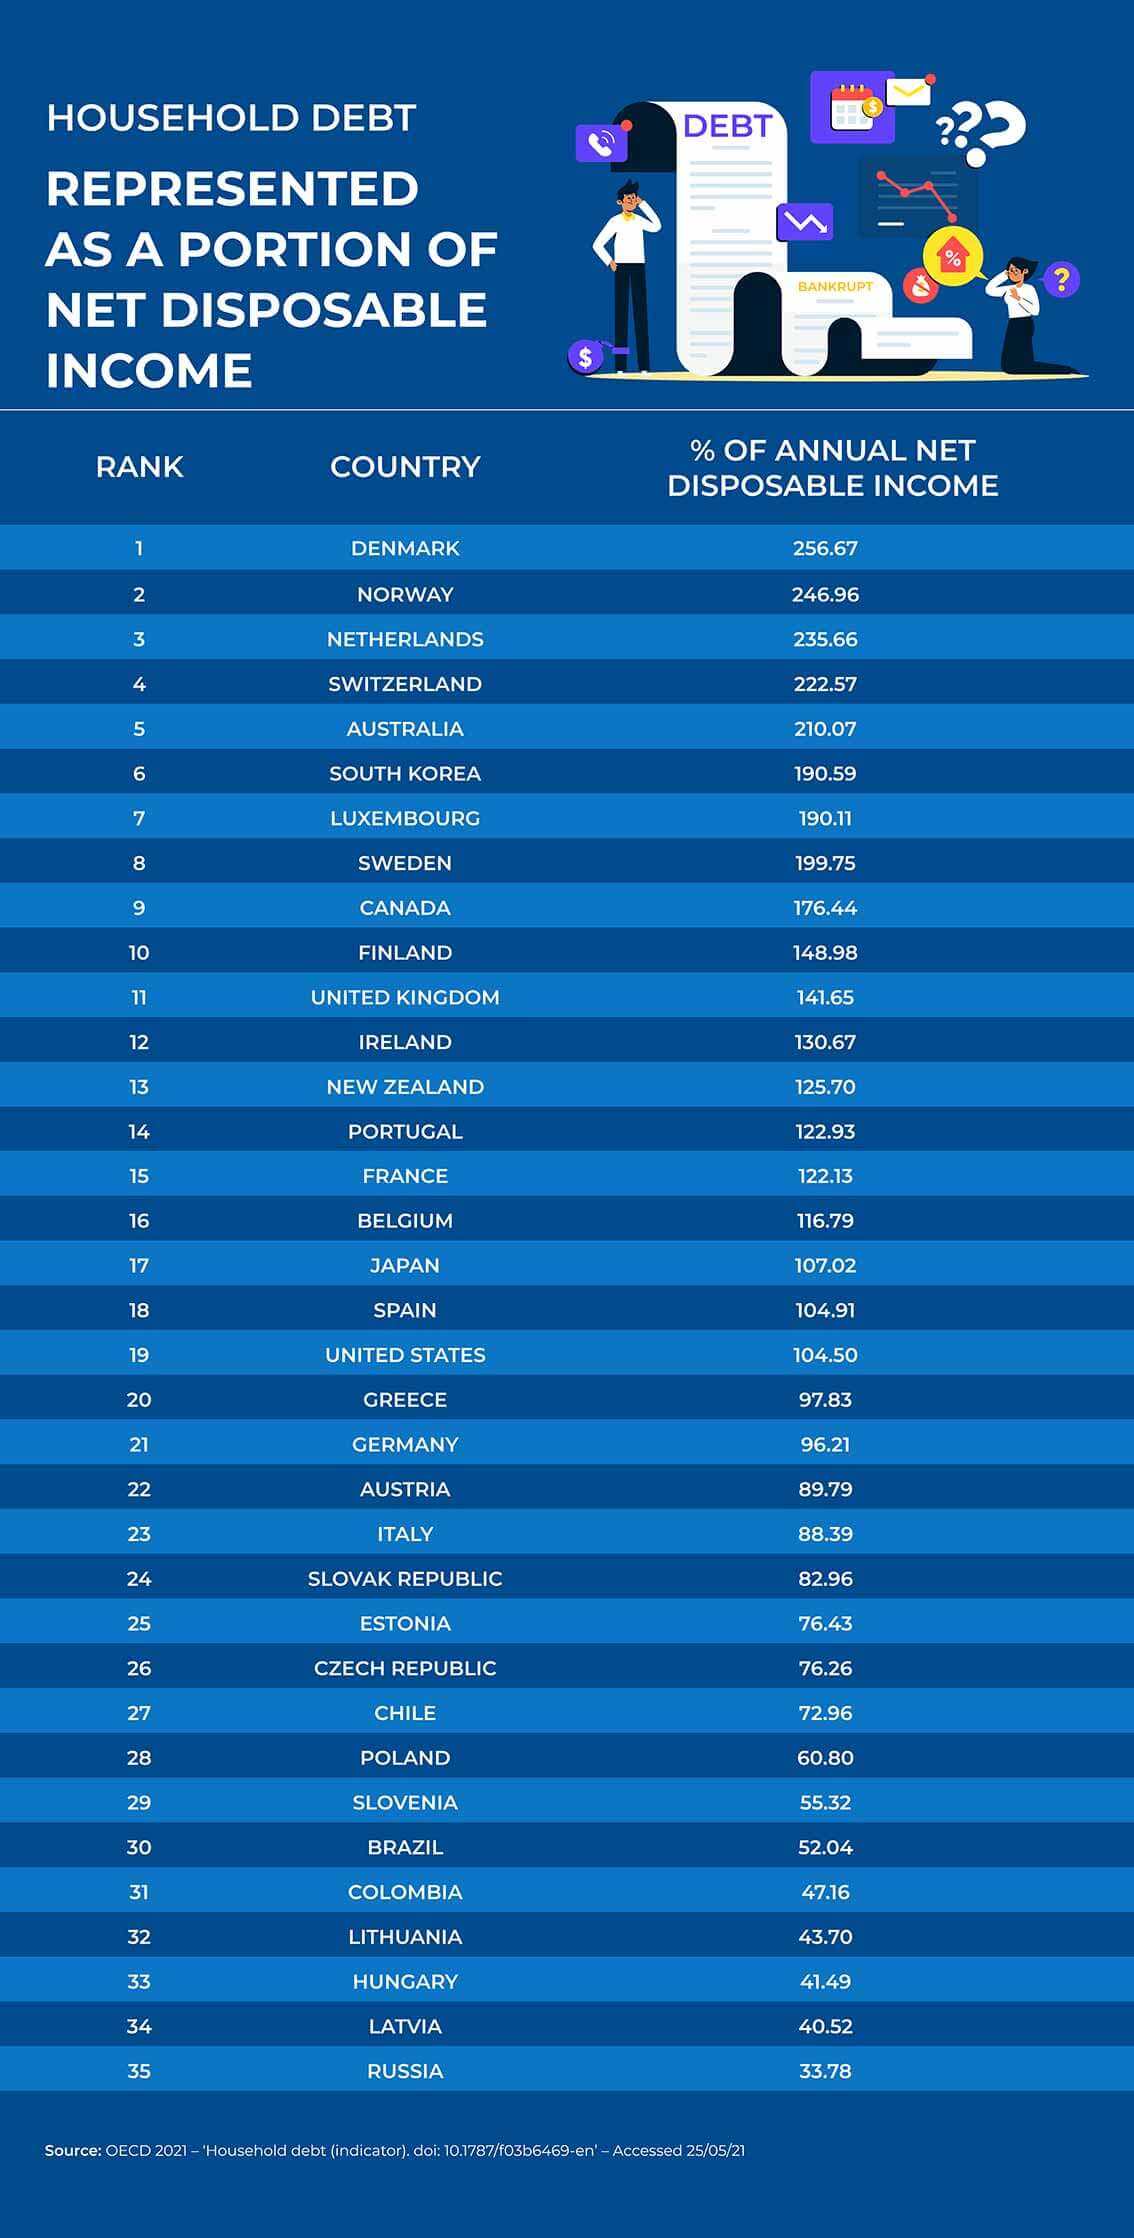
Of the 35 countries analysed, 19 had debt totalling more than net disposable income.¹ What’s interesting to note is that these countries are all considered to have advanced economies. Historically, rising household debt in advanced economies has been relative to rising household income, but in recent years, property prices have outpaced incomes.² And given that mortgages are likely to make up a high portion of a household’s liabilities, there’s sense to be made of these debts.
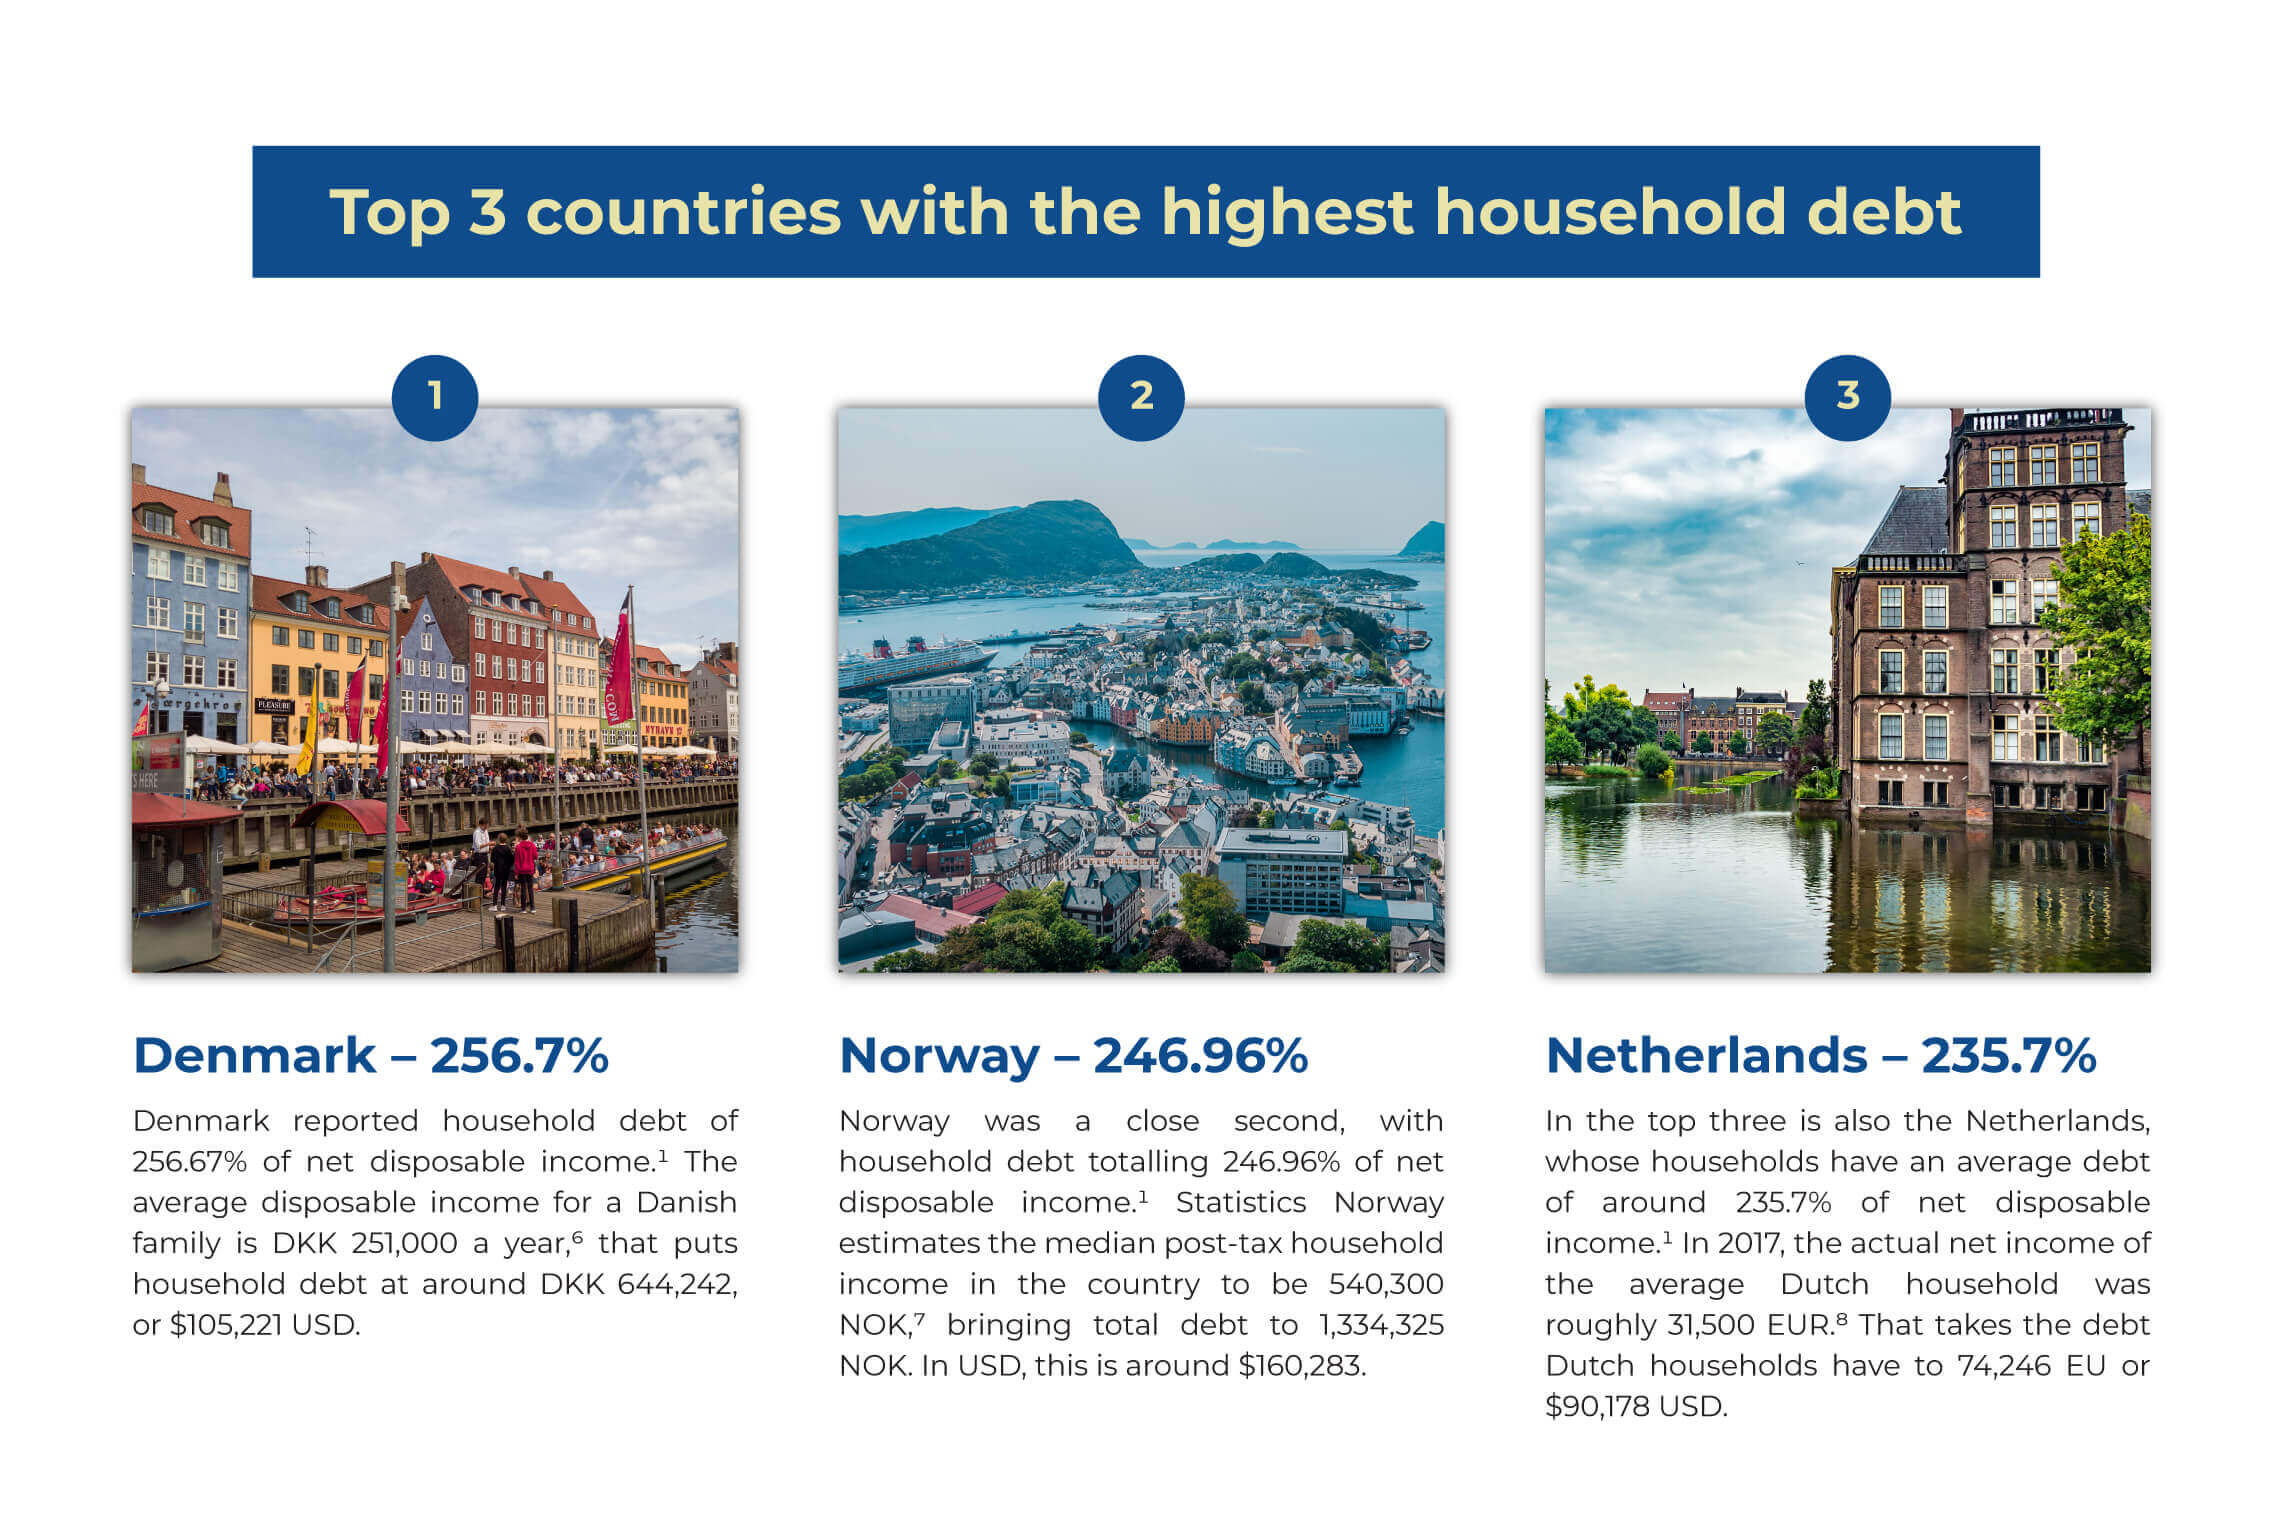
In news that’s unlikely to shock, at the top of the household debt list are expensive countries to both live in and visit. Given that Denmark is ranked the country with the highest household debt,¹ it comes as no surprise that Denmark’s capital, Copenhagen, was listed as the 25th most expensive city to live in, in 2020.³ Switzerland’s capital, Zurich, ranks as the fourth-most expensive city to live in against 209 others,³ and it’s also fourth-ranking for highest household debt.¹ Cost of living takes into account factors such as rent/mortgage, other housing costs, transport, groceries and more.
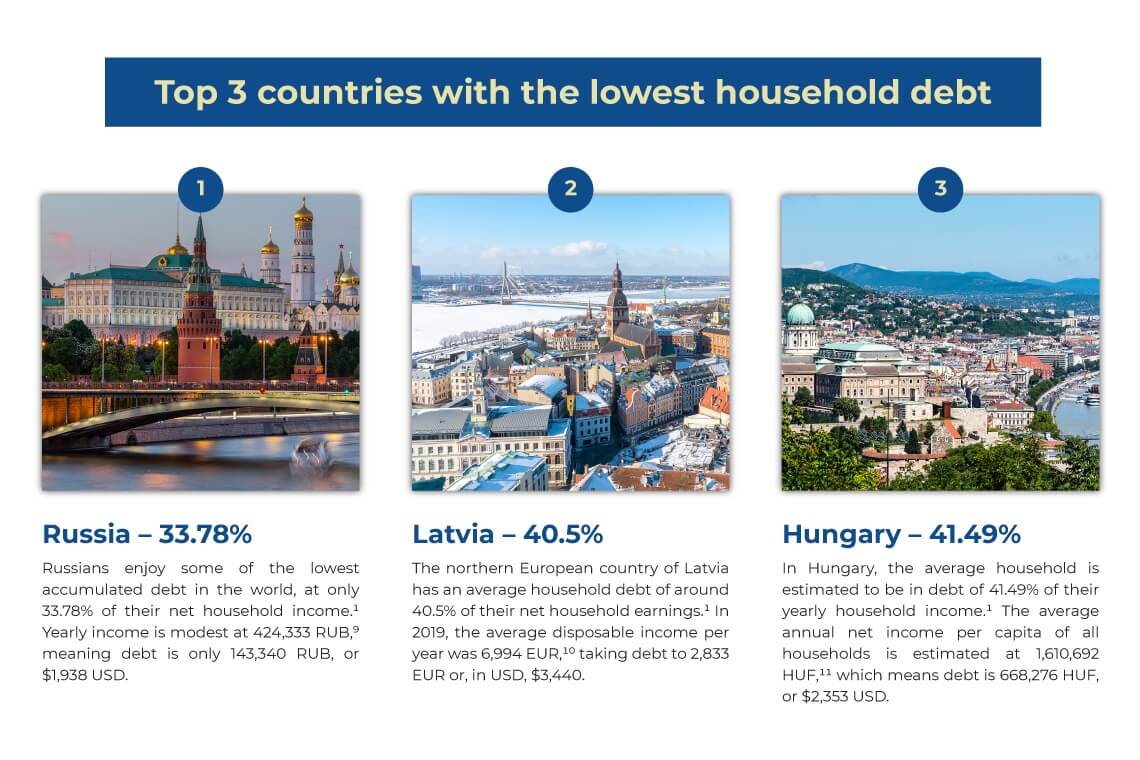
As revealed by the OECD, countries within eastern Europe were revealed to have the least amount of household debt.¹ A possible explanation for this could be that mortgages are relatively uncommon in this part of the world. In Russia, Latvia, Hungary and Lithuania, 81.6% to 89.9% of the population owned their home outright in 2018, compared to 60.5% to 81.3% in Denmark, Norway and the Netherlands.⁴
All currency conversions completed on 25 May 2021.
1OECD 2021 – ‘Household debt (indicator). doi: 10.1787/f03b6469-en’ – Accessed 13/05/21
2OECD 2017 – ‘Resilience in a time of high debt’ – Accessed 14/05/21
3Mercer 2020 – ‘Cost of Living Survey’ – Accessed 14/05/2021
4HOFINET 2018 – ‘Countries’ – Accessed 15/05/2021
5The World Bank 2018-19 – ‘Adjusted net national income per capita (current US$)’ – Accessed 14/05/21
6STATISTICS DENMARK – ‘DENMARK IN FIGURES 2019’ – Accessed 15/05/21
7Statistics Norway 2021 – ‘Income and wealth statistics for households’ – Accessed 15/05/21
8Statista – ‘Average annual disposable income of households in the Netherlands 2017, by background’ – Accessed 15/05/21
9CEIC Data 2019 – ‘Russia Household Income per Capita’ – Accessed 15/05/21
10CEIC Data 2019 – ‘Latvia Household Disposable Income (HD): per Capita: Monthly Avg – Accessed 15/05/21
11Hungarian Central Statistical Office – 2.2.0.1. Main data of all households’ income and consumption (2019) – Accessed 13/05/21
12Australian Bureau of Statistics – ‘Household Income and Wealth, Australia, 2017-18′ – Accessed 13/05/21
13Australian Bureau of Statistics – ‘6523.0 – Household Income and Wealth, Australia, 2015-16’ – Accessed 13/05/21
14Australian Bureau of Statistics – ‘Australian National Accounts: Finance and Wealth 2021′ – Accessed 13/05/21
Brought to you by Compare the Market: Making it easier for Australians to search for great deals on their Home Loans, refinance your home or compare home loans interest rates.