The Burrow
The COVID-19 pandemic wreaked absolute havoc on the world, temporarily upending our normal way of life and leaving countries with a financial headache still being felt today.
However, some things happened that many did not expect, such as a -soaring real estate market in several parts of the world that saw house prices spike at a time of economic uncertainty.
This got us thinking – did some countries see a shift in household debt, and did it ‘pay off’ with an increase in wealth by seeing an increase in home ownership?
Getting clear data on this topic for countries across the world is tricky, but we can use Organisation for Economic Co-operation and Development (OECD) data to track changes in household debt (across all loans, not just mortgages) with changes to financial assets by household (this includes cash, savings, property equity, life insurance, shares and pension funds).
It may be a ‘simplistic’ view, but it gives us a good overview of household debt vs asset averages. A country with a drop in debt levels but increase in financial assets (on average) could see people feeling a bit less pressure, as Compare the Market’s General Manager of Money Stephen Zeller explains.
“When you take on debt you need to pay it back. As the cost of living rises around the world, some households could be feeling serious financial pressure. Having financial assets means that if all else fails, you have a backup plan to help see you through.,” says Zeller.
“Conversely, if a country saw an increase in debt without meaningful improvements to the average household’s financial assets, this group could be feeling greater financial stress with little room to manoeuvre.”
As experts in home loans and refinancing, we looked at 31 countries across the globe and how the average household debt and average financial assets per household changed from 2019 to 2021.
Here is what we found.
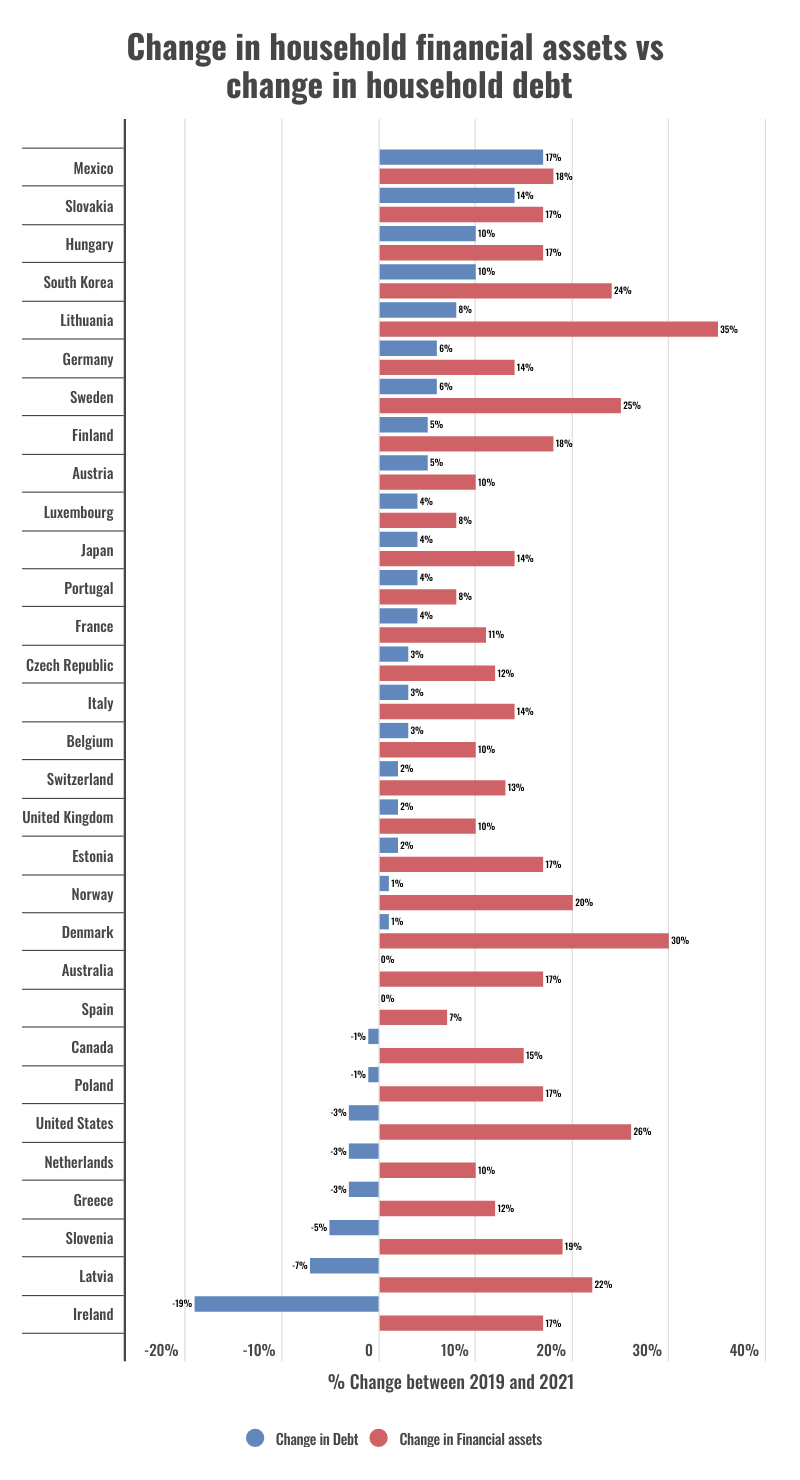
Looking at the chart below, Ireland had the biggest drop in the average household debt (measured as a percentage of disposable income). From 2019 to 2021, the average debt decreased by 19%, while the average household financial assets per capita (measured in USD) increased by 17%.
Other countries that saw a big decrease in household debt while financial assets per capita grew were Latvia and Slovenia. Latvia had a 7% decrease in debt and a 22% increase in financial assets, while Slovenia saw a 5% debt decrease and a 19% increase in financial assets per capita.
While all countries saw an increase in financial assets, most countries also saw debt levels increase. Mexico had the biggest increase at 17%, followed by Slovakia at 14% and Hungary and South Korea at 10%.
Spain and Australia saw no change in debt levels, but did see a growth in financial assets – 7% for Spain and 17% for Australia.
The countries with the biggest increases in the value of their financial assets (regardless of how debt levels changed) were Lithuania at 35%, Denmark at 30% and the United States at 26%.
Sources: Household debt and Household financial assets. OECD Data. 2023.
So, which country performed the best?
Based on the graph above, you could say Ireland saw the best positive change in this time period, as their average debt levels per household had the biggest decrease while financial assets per capita increased 17%. Or you could argue that Lithuania came off best as their average assets per capita increase was the biggest, with a difference of 27% between financial asset increases and debt increases.
Using an equally weighted indexation formula however, we get a very different ranking.
By ranking each country’s debt and financial asset changes to each other and giving the country two scores out of 10, we can average these two measures together to provide a single index score.
In this simplified ranking, Latvia has the best score of 9/10. This is because the nation had a higher increase in financial assets per capita than Ireland, while still having a big drop in debt levels – especially compared to other countries with bigger increases to financial assets.
Latvia was followed by the USA who scored 8.8/10 and Slovenia at 8.5/10. Like Latvia, both of these countries had positive increases to monetary assets per household while seeing the average debt levels decrease.
At the bottom end of the rankings was Luxembourg with a score of 1.7/10. Luxembourg saw some of the smallest growth in financial assets at 8%, while debt increased at 4%, which was a common increase for several nations.
Portugal was second from the bottom with a score of 2.2/10. They did slightly better because the raw data saw Portugal have a slightly lower increase than debt – Portugal’s was 4% and Luxembourg’s was 4.4%, but it was rounded to 4% in our index.
Austria also scored 2.2/10 due to low growth in financial assets only twice that of the growth in debt. Hungary was in a similar position scoring 2.8/10 with financial assets per household increasing 17% while debt levels increased 10%.
| Country | Index score |
| Latvia | 9.0 |
| United States | 8.8 |
| Slovenia | 8.5 |
| Denmark | 8.2 |
| Ireland | 7.7 |
| Norway | 7.2 |
| Poland | 6.8 |
| Australia | 6.5 |
| Canada | 6.2 |
| Estonia | 6.2 |
| Greece | 5.8 |
| Lithuania | 5.7 |
| Sweden | 5.5 |
| Finland | 4.8 |
| Netherlands | 4.8 |
| Korea | 4.8 |
| Italy | 4.3 |
| Switzerland | 4.3 |
| United Kingdom | 3.8 |
| Czech Republic | 3.7 |
| Spain | 3.7 |
| Japan | 3.5 |
| Mexico | 3.5 |
| Slovak Republic | 3.5 |
| Belgium | 3.2 |
| France | 3.2 |
| Germany | 3.0 |
| Hungary | 2.8 |
| Austria | 2.2 |
| Portugal | 2.2 |
| Luxembourg | 1.7 |
Sources: Household debt and Household financial assets. OECD Data. 2023.
Stephen Zeller notes that these numbers are only part of the picture, but they do provide a high-level overview that helps visualise what’s happening for debt levels and financial assets.
“It’s important to remember that we’re looking at the biggest changes in what the average debt and value of household financial assets is here to see who has had strong improvement in these measures during the COVID-19 pandemic,” says Zeller.
Zeller notes it would be too simplistic to say that the average person in Luxembourg is struggling more than those in Mexico or Latvia. Luxembourg has one of the highest average wages in the OECD, after all (Average wages, OECD 2023).
“There was a lot of change and Governments across the world scrambled to implement economic policies to try and protect their economies,” Zeller continues. “We saw a huge surge in real-estate markets, which affects equity values, which is reflected in the OECD financial assets data. We also saw stocks and shares largely recover after a terrifying period of freefall, and that’s also captured in the OECD data we used to calculate our rankings.”
As the pandemic was declared and countries in the world were plunged into lockdown, almost all stocks saw massive drops in value, which started to pick back up in June for some sectors, with most recovering by the start of 2021 (The impact of COVID-19 on capital markets, one year in, McKinsey & Company 2021).
For many people, a home is one of the biggest financial assets we may ever have. Zeller notes that in times of economic hardship, comparing home loans could help ease the pressure.
“There may be better interest rates and/or an option with less fees that you can switch to, which could help save you money during the course of your loan,” says Zeller. “Even a difference of half a per cent could save you thousands over the term of your mortgage.”
“Australians looking for a mortgage can make it easier to weigh up interest rates, features and fees by using our comparison service to view available loan products. It just takes a few minutes and helps simplify the application process, and it could make a real difference by reducing the cost of repayments, depending on available options.”
To calculate the index ranking, each country was given a score based on how the country’s debt and financial asset changes compared to each other. The country with the biggest positive was given a score of 10, and the one with the worst was given a score of 0. The rest of the countries were given a normalised score between 0 and 10 for each metric.
These two scores were then averaged together to provide a single equally-weighted index score out of 10. The metrics and how they were scored are detailed below.
References:
Average wages, OECD Data. 2023.
The impact of COVID-19 on capital markets, one year in. Chris Bradley, Peter Stumpner, McKinsey & Company. 2021