The Burrow

Feb 8, 2024
How much of a difference does your upbringing make to your life? It’s a question that’s been debated for ages and, in a world with a greater focus on equity, the wealth gap within society is under the microscope.
There has always been a wealth divide in society, but this has become more pertinent than ever in the face of stagnant wage growth, increasing inflation and rising house prices making home ownership seem less and less likely for young people wanting to buy their own home. It has sparked intergenerational conflict with different age groups pitted against each other over who is (or was) better off.

There has always been a wealth divide in society, but this has become more pertinent than ever…
Just how likely is it that someone could climb up the social ladder?
To get to grips with the depth of feeling on the wealth divide in society, the home loan interest rate and refinance experts at Compare the Market Australia surveyed more than 3,000 adults across Australia, Canada and the USA, asking them questions about their social class, money habits, upbringing and home ownership.
Join us as we explore the results.
Social class is a somewhat nebulous term referring to wealth, status and asset ownership. It is generally understood that upper class refers to business and company owners or upper management, while middle class refers to middle management, and working class refers to lower-level employees – though this division will not fit every individual or their circumstances.
In our survey, we left this term largely undefined so that survey respondents would pick what they understood applies to them.
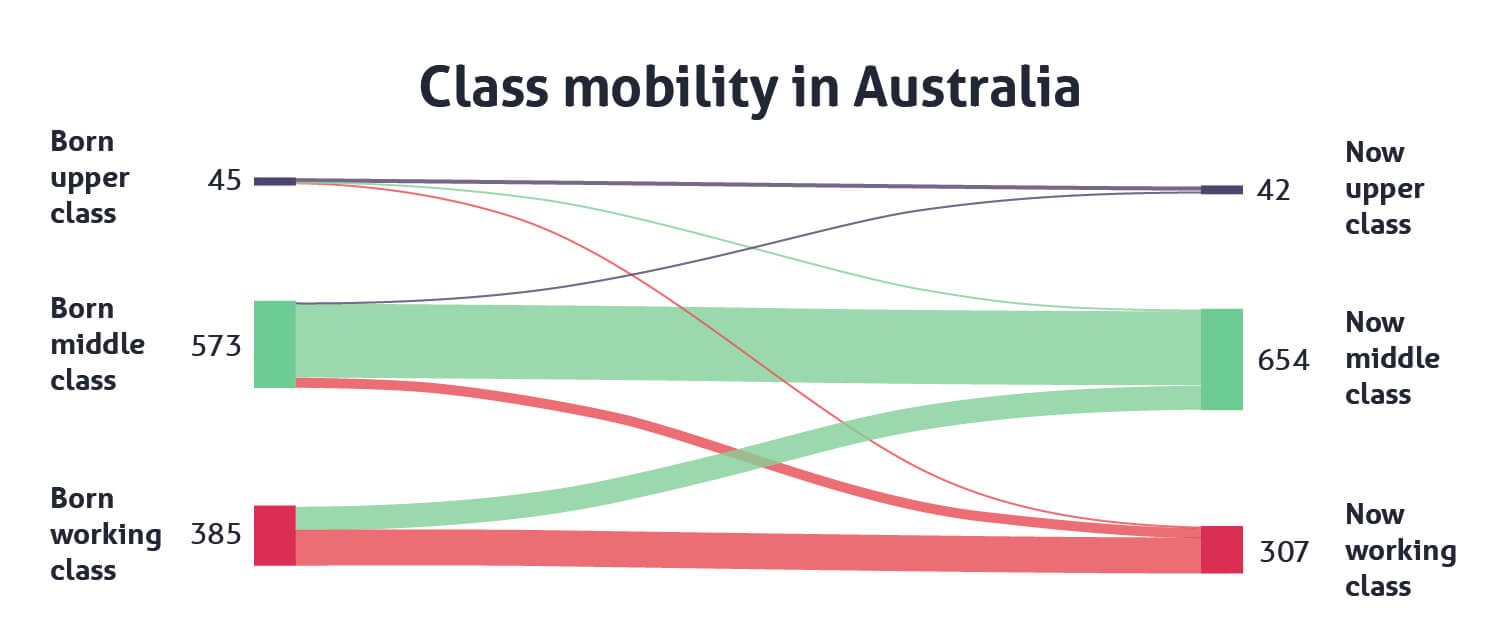
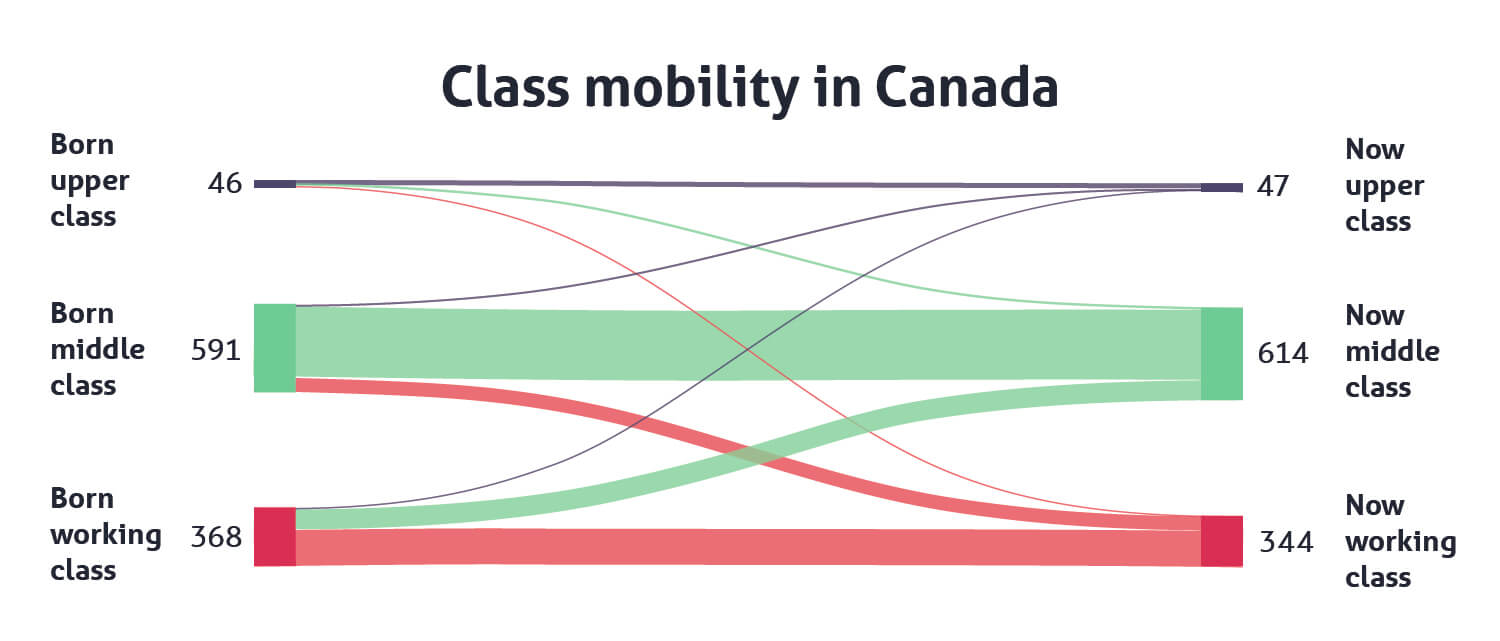
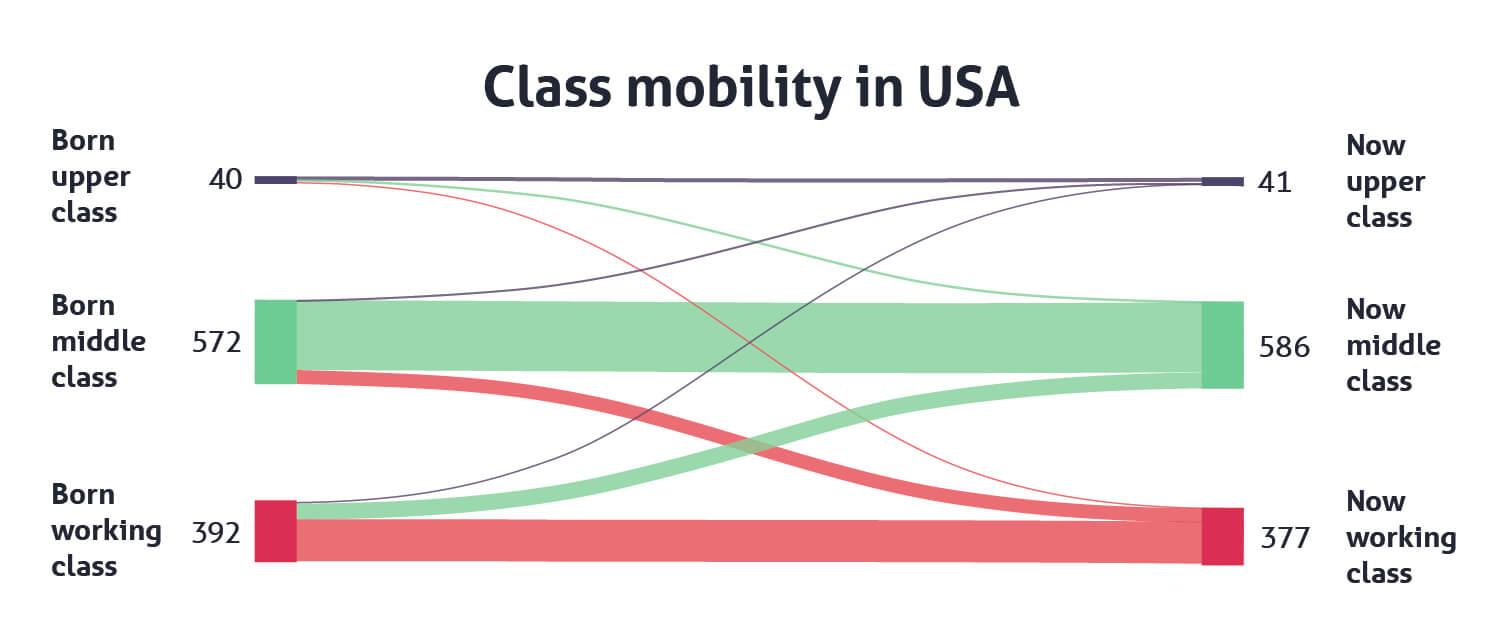
Comparing the social class respondents said they grew up in to where they are today, the middle class saw a big increase and the working class saw a decrease across all three countries as respondents moved up the social ladder.
Australia’s biggest increase was people moving from working to middle class. Of those who said they grew up working class, 38.9% had moved up and were now middle class. In Canada it was lower at 32.8%, and the USA had the lowest amount of upward mobility for the working class at 28.3%.
Interestingly, the data shows that those born with a silver spoon can have it taken away, as a considerable number of people who grew up in the upper class now identified as middle class.
In Canada, almost half of those born upper class now were middle class (43.4%), while in America this was the case for 37.5% of those born upper class. Australia saw the least amount of upper class people stepping down a rung on the social ladder, but it was still a considerable amount at 33.3%.
The graphs below showcase the change in social class from childhood to the present day, as at the time of the study.
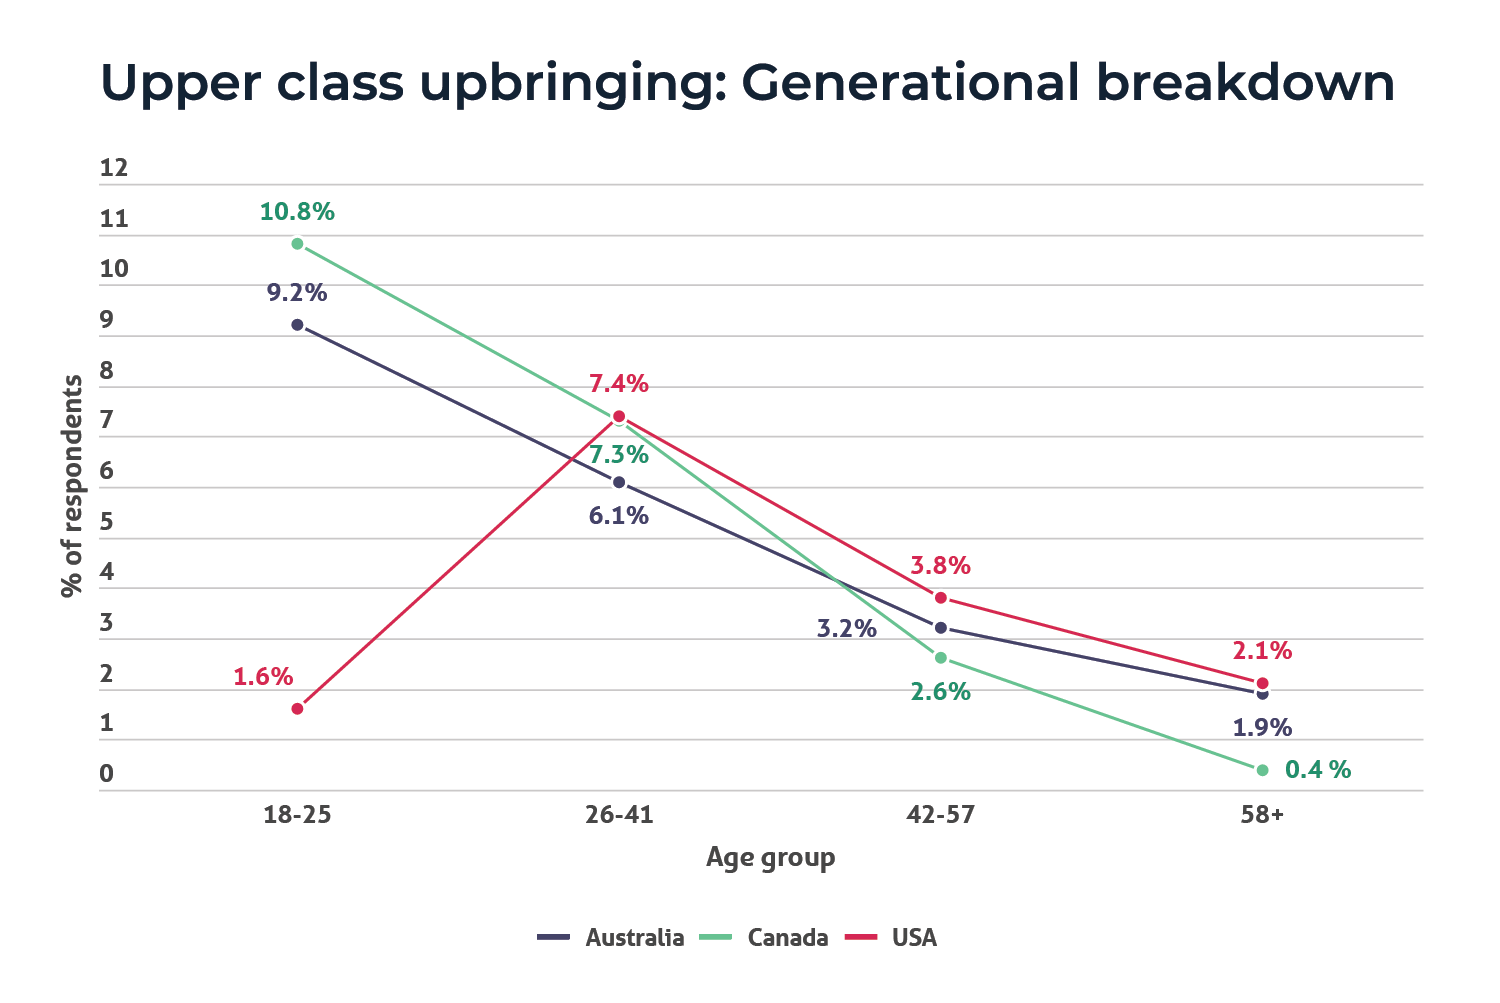
It’s now a classic argument between different age groups – who had it better? While this can be quite an involved discussion that can potentially sour the mood at any family gathering, when it comes to social class, one thing is clear: Younger people are off to a better start.
Across each country we surveyed, younger age groups were more likely to say they were raised in the upper class of society than older generations – except for American Gen Z (18–25 year-olds). Interestingly, only 1.6% of Americans in this age group said they grew up upper class, compared to 9.2% of Australians and 10.8% of Canadians in the same age group.
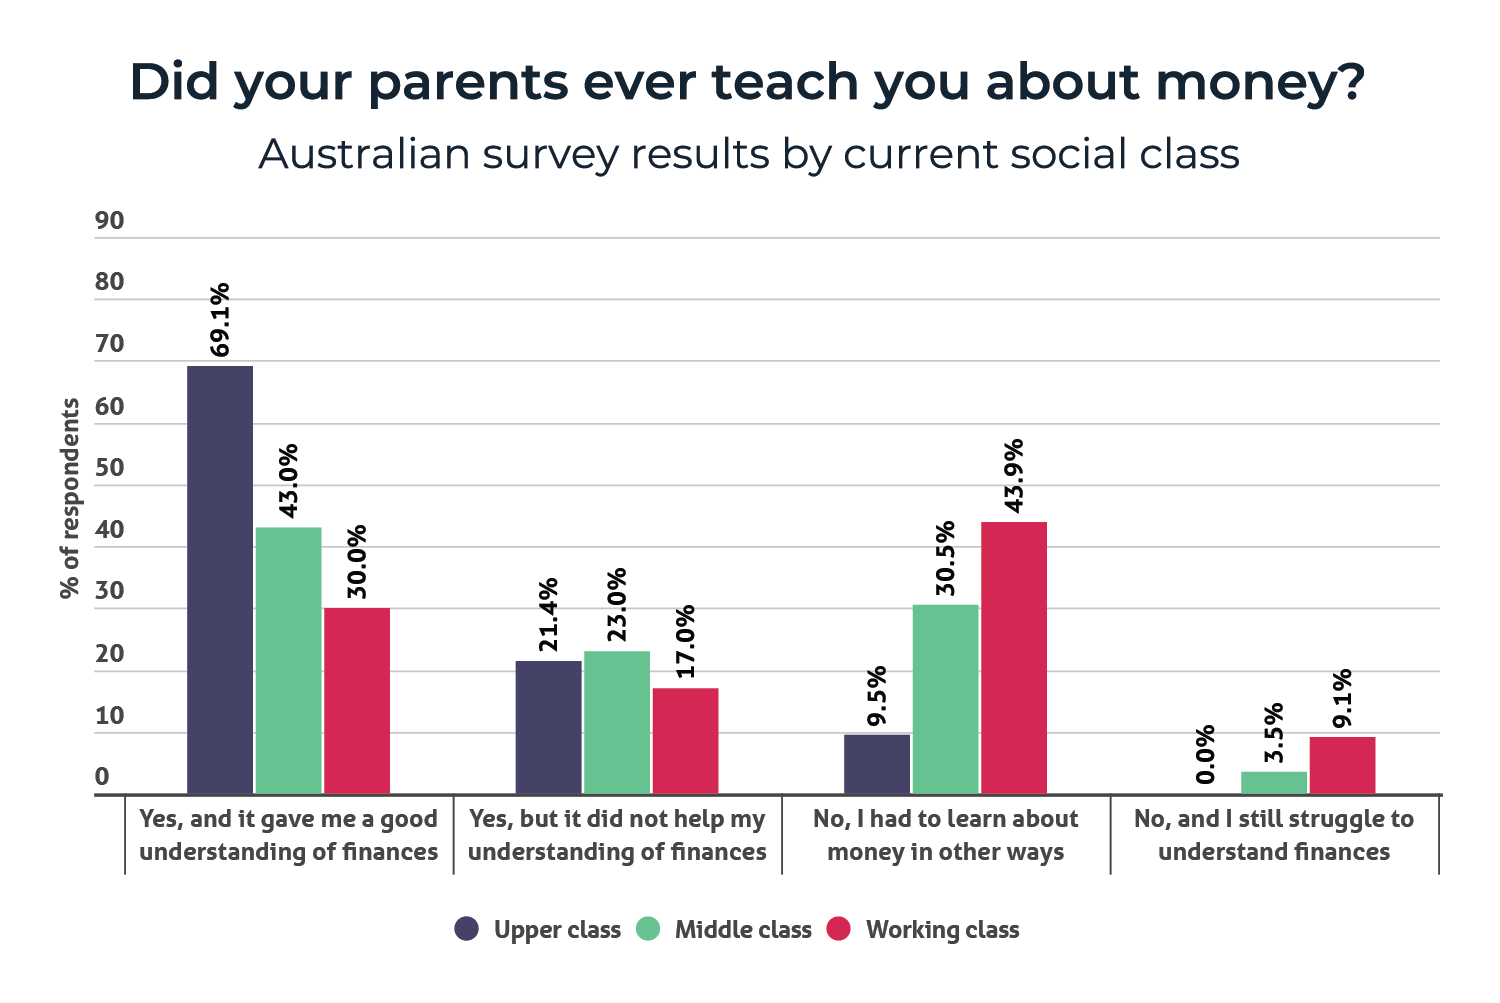
Compare the Market Australia’s survey asked respondents if their parents ever educated them about finances during their childhood. The number of respondents who said their parents gave helpful lessons were:
However, some said that while their parents taught them about money, it wasn’t helpful:
Additionally, a further third of respondents surveyed in each country said they were never taught about finances by their parents and had to learn in other ways, while less than 10% in each country said their parents didn’t teach them and they still struggle to understand finances today.
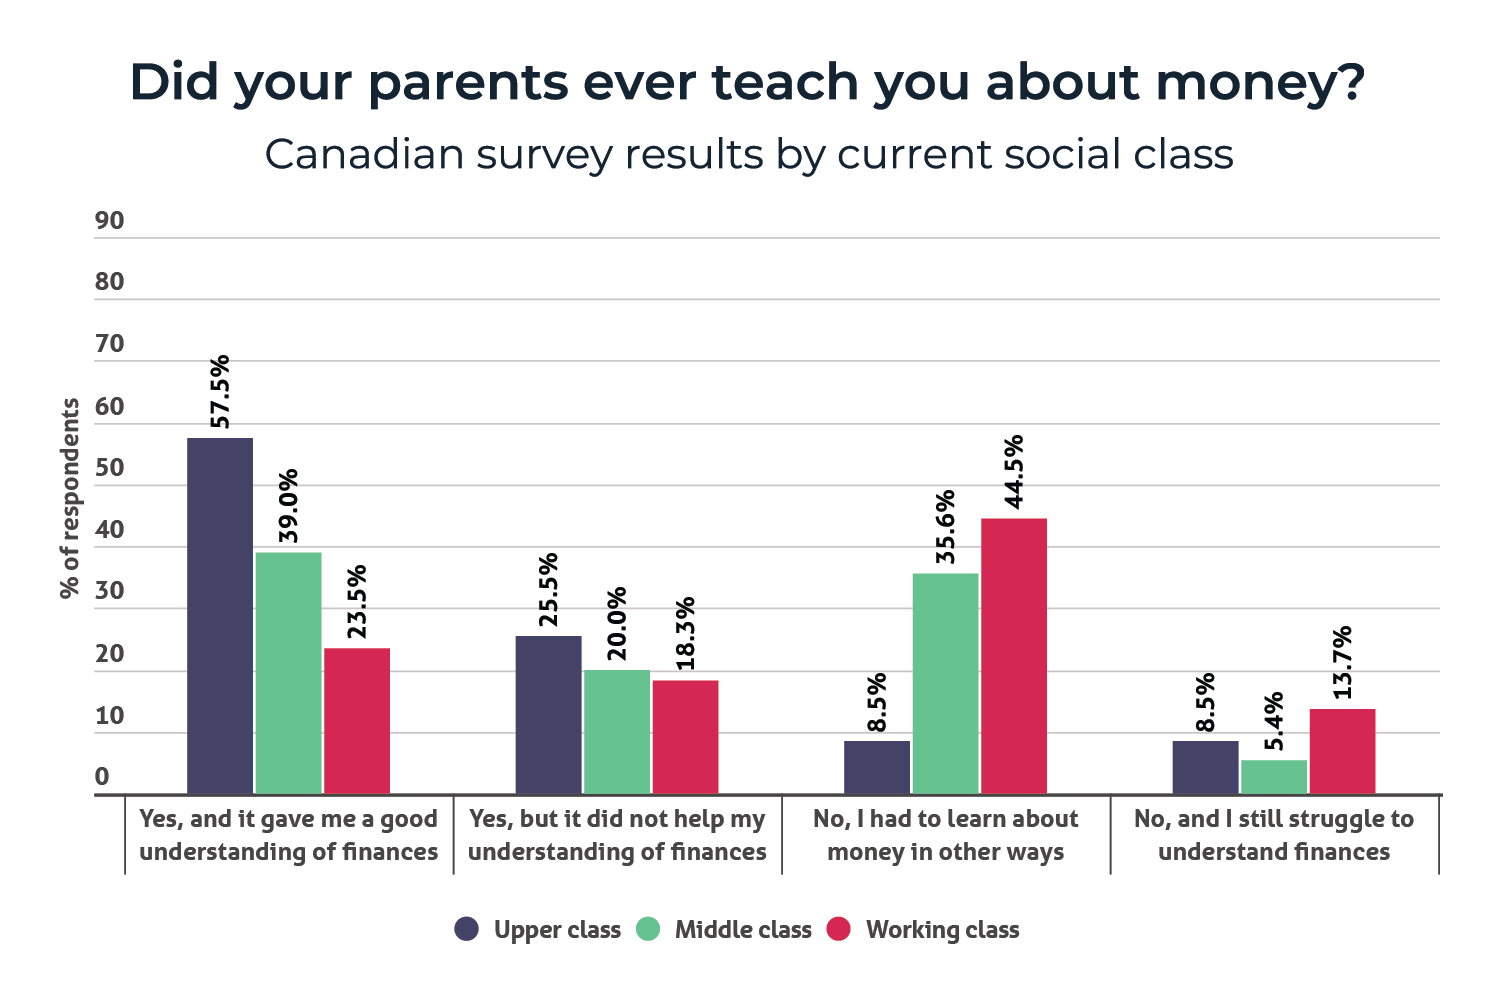
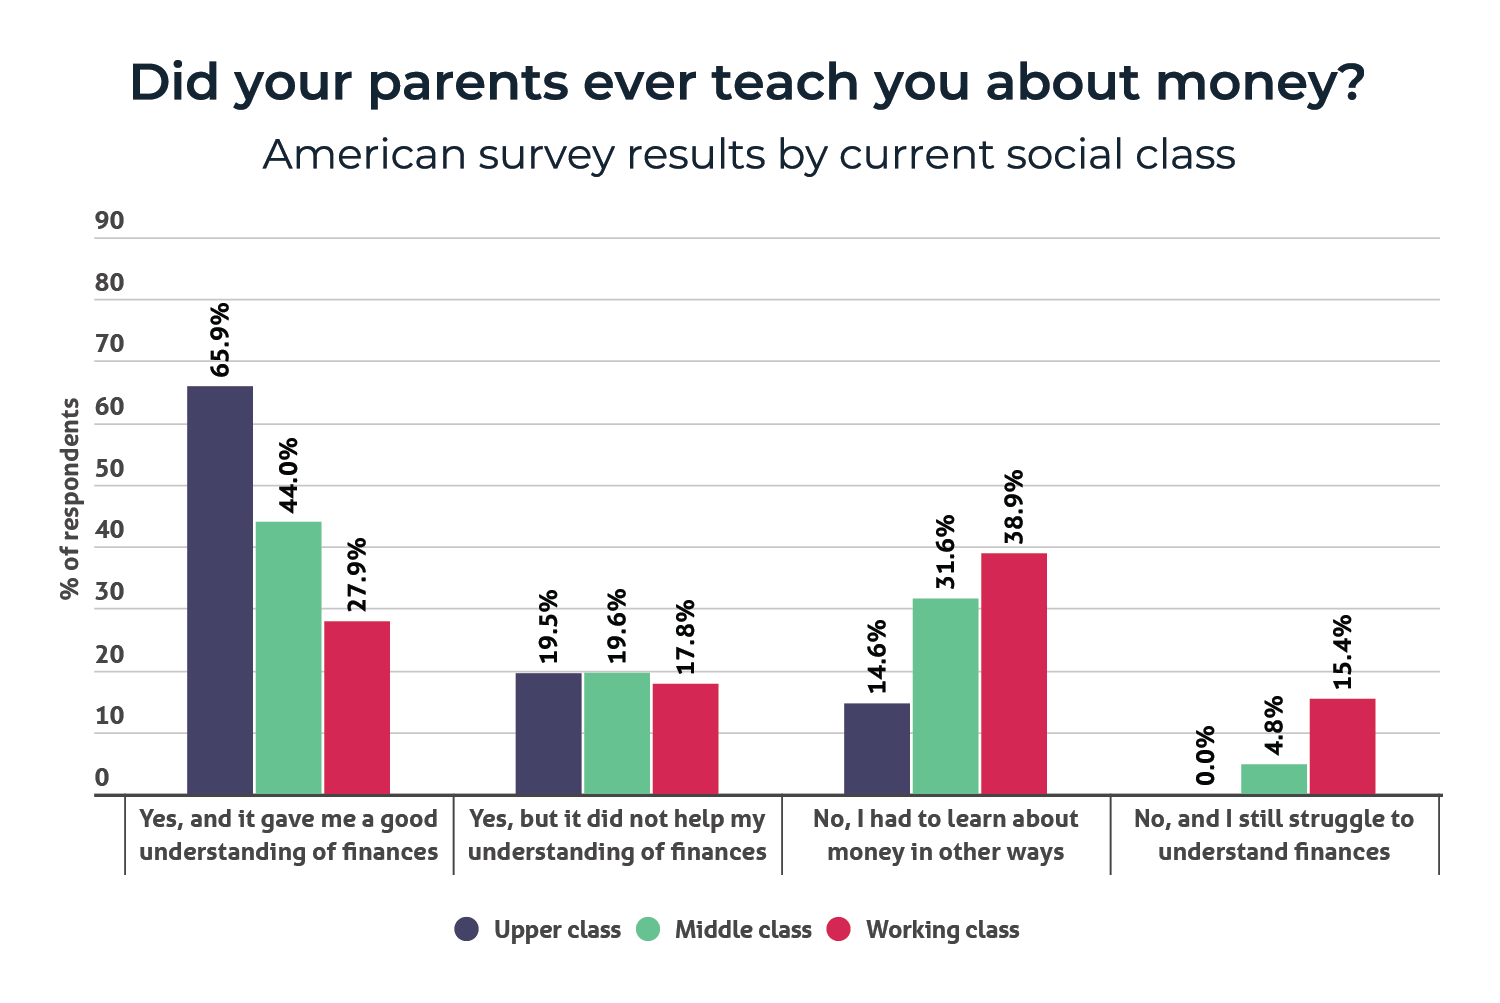
Breaking down the responses to this question by the self-identified social class of respondents, those who said they are currently upper class were more likely to have been taught by their parents.
On the other hand, those who identified as working class were more likely to not have been taught by their parents and had to figure things out for themselves. The graphs below highlight the difference for each country.
When asked whether they would feel confident enough to teach younger generations about money and finance, just over 50% in each country said they felt they could teach about some important monetary issues – but not all.
There was barely any difference between each country (55.7% in Australia, 55.1% in the USA, and 54.8% in Canada). Interestingly, Americans were the least confident, with 16.3% saying they were not confident teaching about critical finance topics at all. Canada was a close second with 14.9% saying they didn’t feel confident teaching about it, followed by 12.0% of Australians.
Would you feel confident teaching younger generations about important financial issues? | Australia | Canada | USA |
Yes, I would be equipped to provide adequate knowledge of some important issues | 55.7% | 54.8% | 55.1% |
Yes, I would be equipped to provide adequate knowledge on all important money issues | 32.3% | 30.2% | 28.6% |
No, I am not equipped to provide knowledge of any important money issues | 12.0% | 14.9% | 16.3% |
Interestingly, Australians and Americans who said they were currently in society’s upper class were most likely to say they could provide adequate knowledge on all important monetary issues (73.8% of Australians and 56.1% of Americans in this group), but this wasn’t the case for Canada.
The majority of Canadians who were currently upper class indicated they felt comfortable teaching about some important issues, but not all (68.1%). Only 29.8% of upper class Canadians felt prepared to teach about all important finance issues.
The survey also asked respondents to describe their money spending habits. For Canada and the USA, the number one response was, “I budget to save and spend on what I want” (38.9% for Canada and 38.0% for the USA).
In Australia, the top response was, “I’m a serious saver – I never spend money on things I don’t need” (39.4%).
Worryingly, more than one-in-ten people in each country say that they spend beyond their means and never have any savings (11.0% in Australia, 13.2% in Canada and 13.6% in the USA). The table below shows the results for each country to this question.
How do you handle your money? | Australia | Canada | USA |
I budget to save and spend on what I want | 36.7% | 38.9% | 38.0% |
I’m a serious saver | 39.4% | 32.3% | 28.1% |
I spend beyond my means | 11.0% | 13.2% | 13.6% |
I’m an impulse buyer | 10.8% | 12.0% | 17.9% |
I put all my money in stocks and shares | 2.2% | 3.5% | 2.3% |
Pocket money can be a great way to teach a child about money and managing finances. Regardless of whether it was freely given or earned for doing household chores, over half of Australians got pocket money from their parents when they were kid (52.1%). An additional 24.0% said they sometimes got pocket money, while 23.8% said they never received pocket money.
Compared to the USA and Canada, Australians were slightly more likely to receive pocket money when growing up. In the USA 44.7% said they regularly received it, and 32.5% said they got pocket money sometimes, while 22.8% said they never did. In Canada the results were 48.2% for regularly, 27.8% for sometimes and 24.1% for never.
This means that Canadians overall were the most likely to never receive pocket money in comparison to Americans and Australians.
But what impact (if any), did this have on their spending habits?
The majority of respondents said they would save up any pocket money to spend on something special.
What did you do with your pocket money? | Australia | Canada | USA |
Spend it immediately | 25.9% | 35.4% | 35.4% |
Save it up to spend on something special | 71.3% | 63.4% | 63.5% |
I wasn’t allowed to spend it | 2.7% | 1.2% | 1.2% |
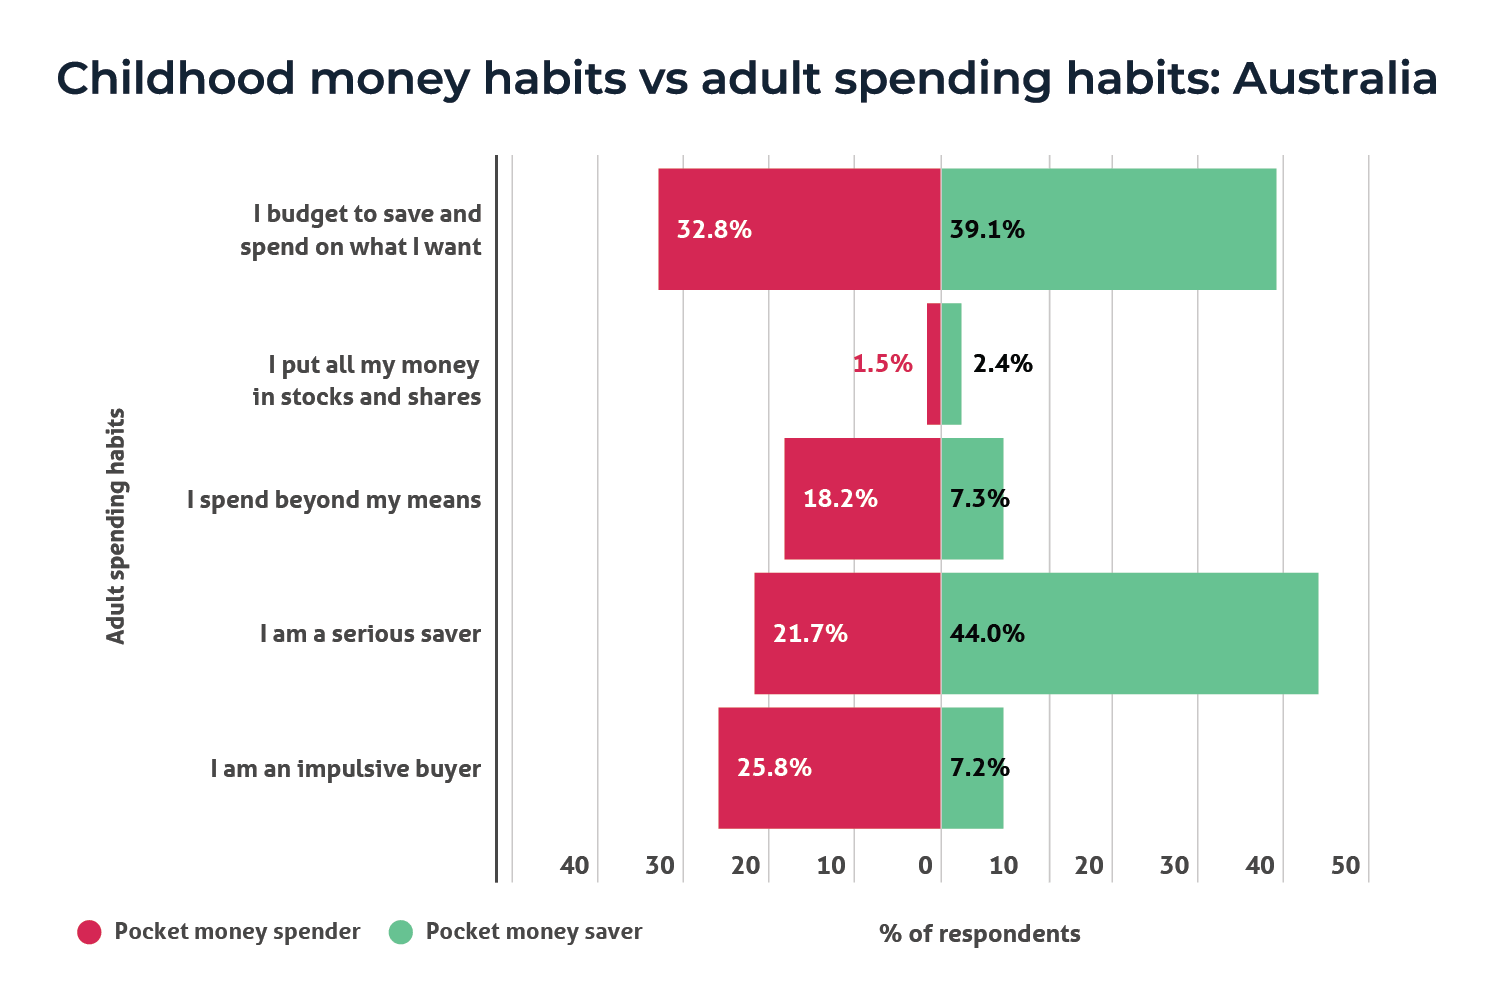
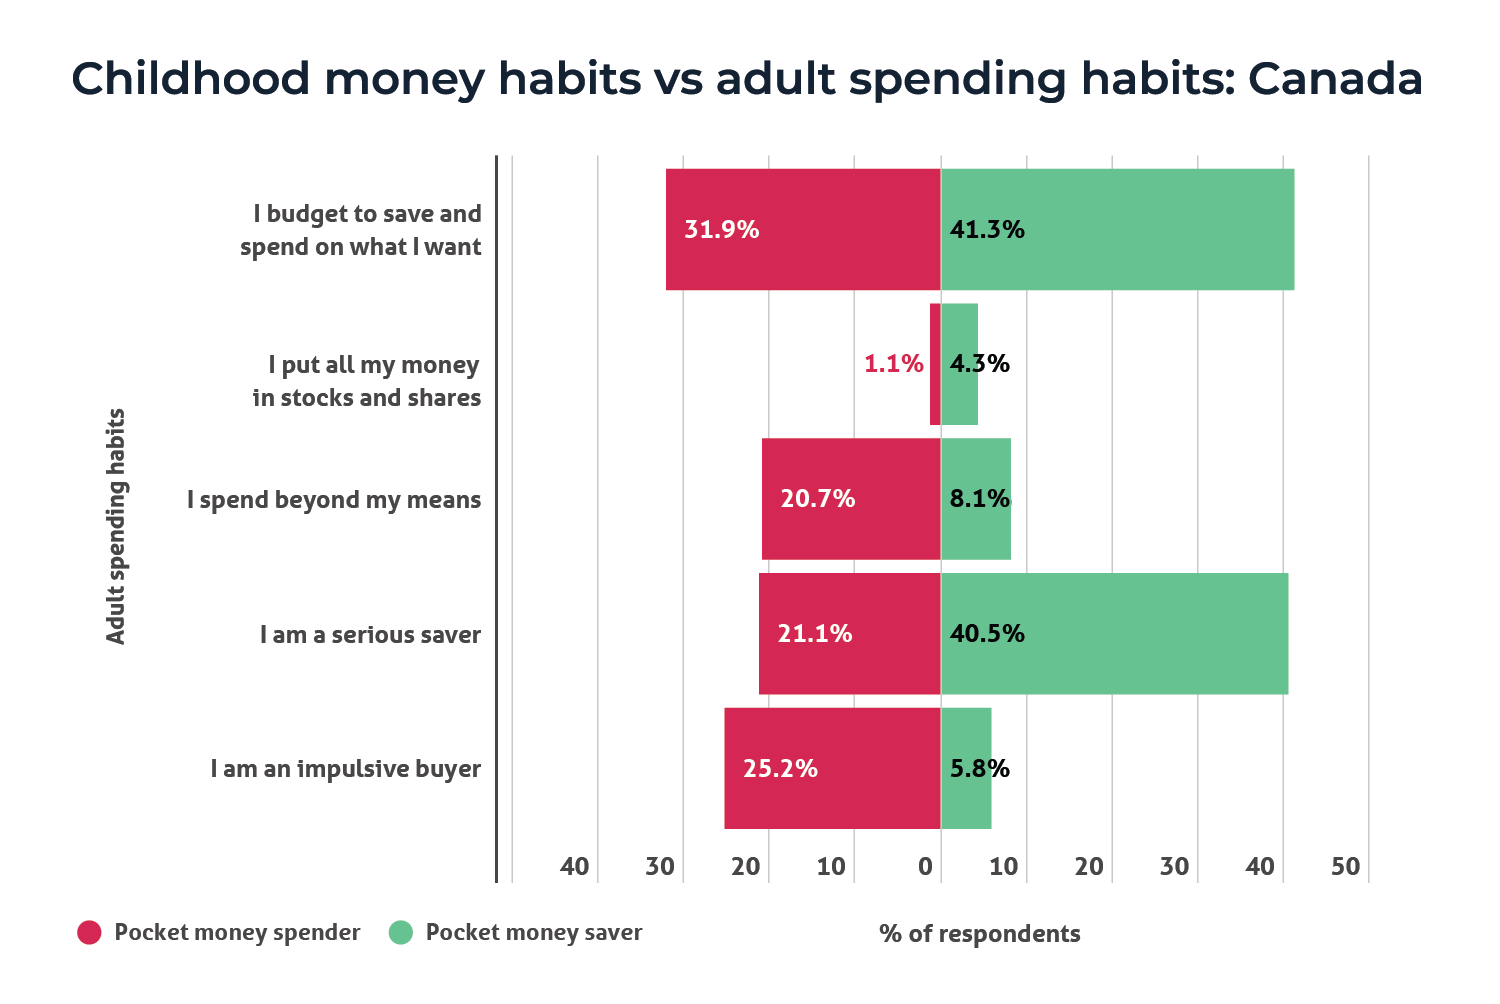
By diving into the answers, it appears that the way people handle their pocket money as a child has an impact on how they handle and spend money as an adult.
Of course, other factors will also influence someone’s money habits, including receiving instruction from parents and being exposed to financial matters when growing up, as shown earlier. But as the charts below show, there is a clear connection between what people did with their pocket money as a kid and how they spend money today.
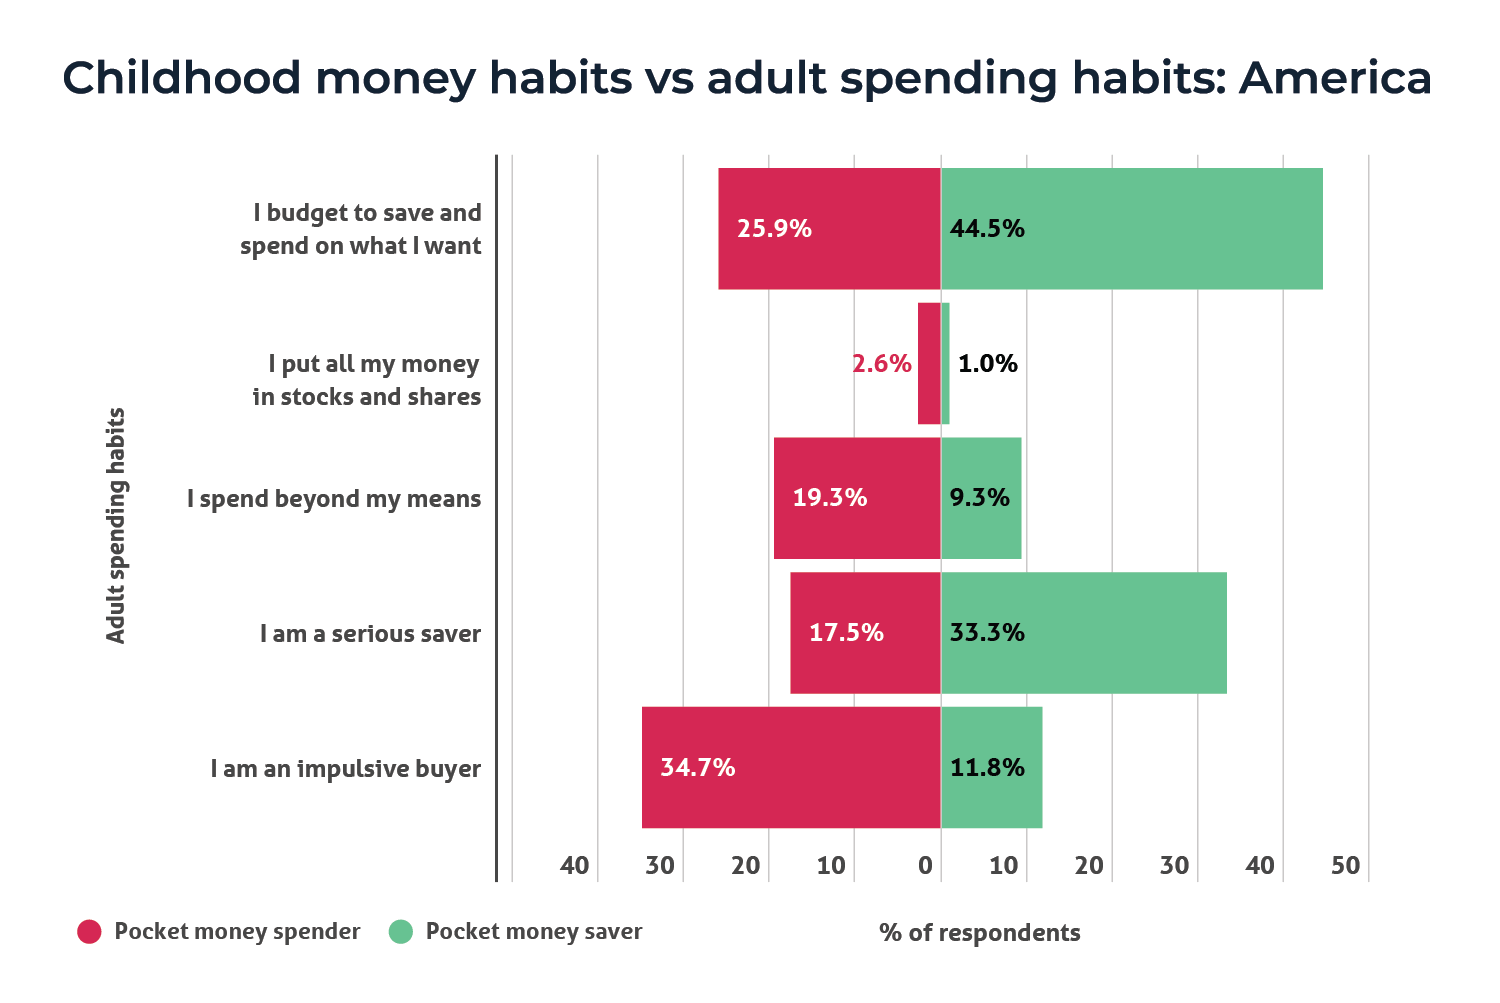
For example, 34.7% of Americans who spent their pocket money immediately identify as impulse buyers today, while the majority of those who saved their pocket money say they budget and save up to buy the things they want nowadays (44.5%).
In Australia and Canada, the majority of those who spent their pocket money immediately and those saved it up were budgeters today. In Australia, 32.8% of childhood spenders and 39.1% of childhood savers said they budgeted to spend on what they wanted, while in Canada it was 31.9% and 41.3% respectively.
However, the second most common response was quite telling. In Australia, 25.8% of childhood spenders identify as impulse buyers today, while the second largest response for childhood savers was to identify as a serious saver in their adult life (those who never spend their money on things they don’t need) at 44.0%.
It was the same story in Canada with 25.2% of childhood spenders describing themselves as impulse buyers, while 40.5% of those who saved their pocket money as a kid say they are a serious saver today.
The charts below show the breakdown of current money habits for those who were pocket money savers and spenders in each country (those who weren’t allowed to spend their pocket money weren’t included due to a low response rate).
Owning a home is a massive financial undertaking and is typically the most valuable asset most people would be able to own in their lifetime. Not everyone necessarily wants to own a home, but it’s understood that most people do.
And unfortunately, it’s getting harder and harder to afford a home – especially for younger adults.
Housing affordability is one of the key issues in arguments between the generations. For Baby Boomers, houses were simply more affordable during their younger years. In the US, the Berkeley Economic Review found 45% of those born between 1946 and 1964 were able to buy a home when they were 25 to 34 years old. In 2019, this had dropped to 37% for Millennials of the same age (those born between 1981 and 1997).1
Locally, the Australian Institute of Health and Welfare (AIHW) highlights that 54.2% of those born between 1947 to 1951 were able to become homeowners between 25 and 29 years old, but that has dropped to 36.1% for those born between 1992 and 1996.2
This data backs up the results from our survey. While overall, most people own a home (either outright or with a mortgage), when broken down by age group, the difference in home ownership rates is astronomical.
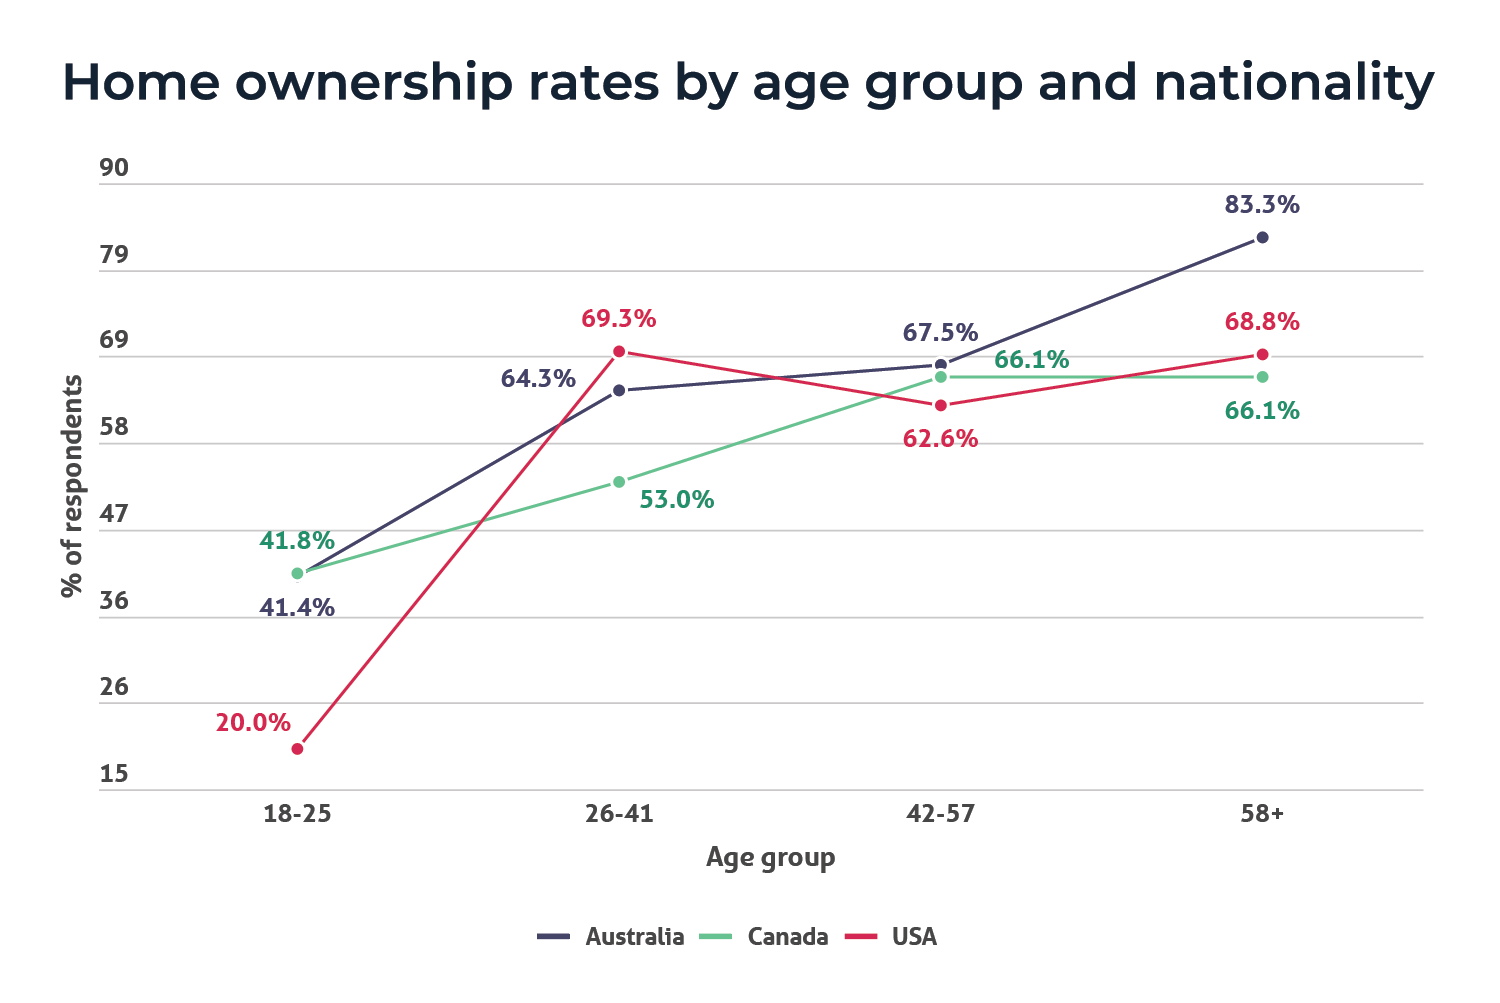
The chart above shows the USA had the biggest difference in home ownership rates for Gen Z adults. Only about 20% owned a home, while 80% didn’t – but this quickly flipped with 69.3% of Millennials owning homes, as opposed to 30.7% who didn’t.
Australia and Canada had a closer gap with just under 60% of Gen Z survey respondents being non-homeowners while just over 40% were homeowners, and this changed at a slower rate for older generations than it did in the US.
For Baby Boomers (those aged 58 and above), Australia had the biggest gap between homeowners and non-homeowners in this age group with 83.3% of Australian Boomers owning a home compared to 16.5% who don’t.
Of course, on one hand, this is to be expected. The older you are, the more time you’ve had to save up money for a house. The problem is that house prices have outstripped wage growth,3 so those dreaming of owning a home are chasing a goal that’s getting further away from them every year.
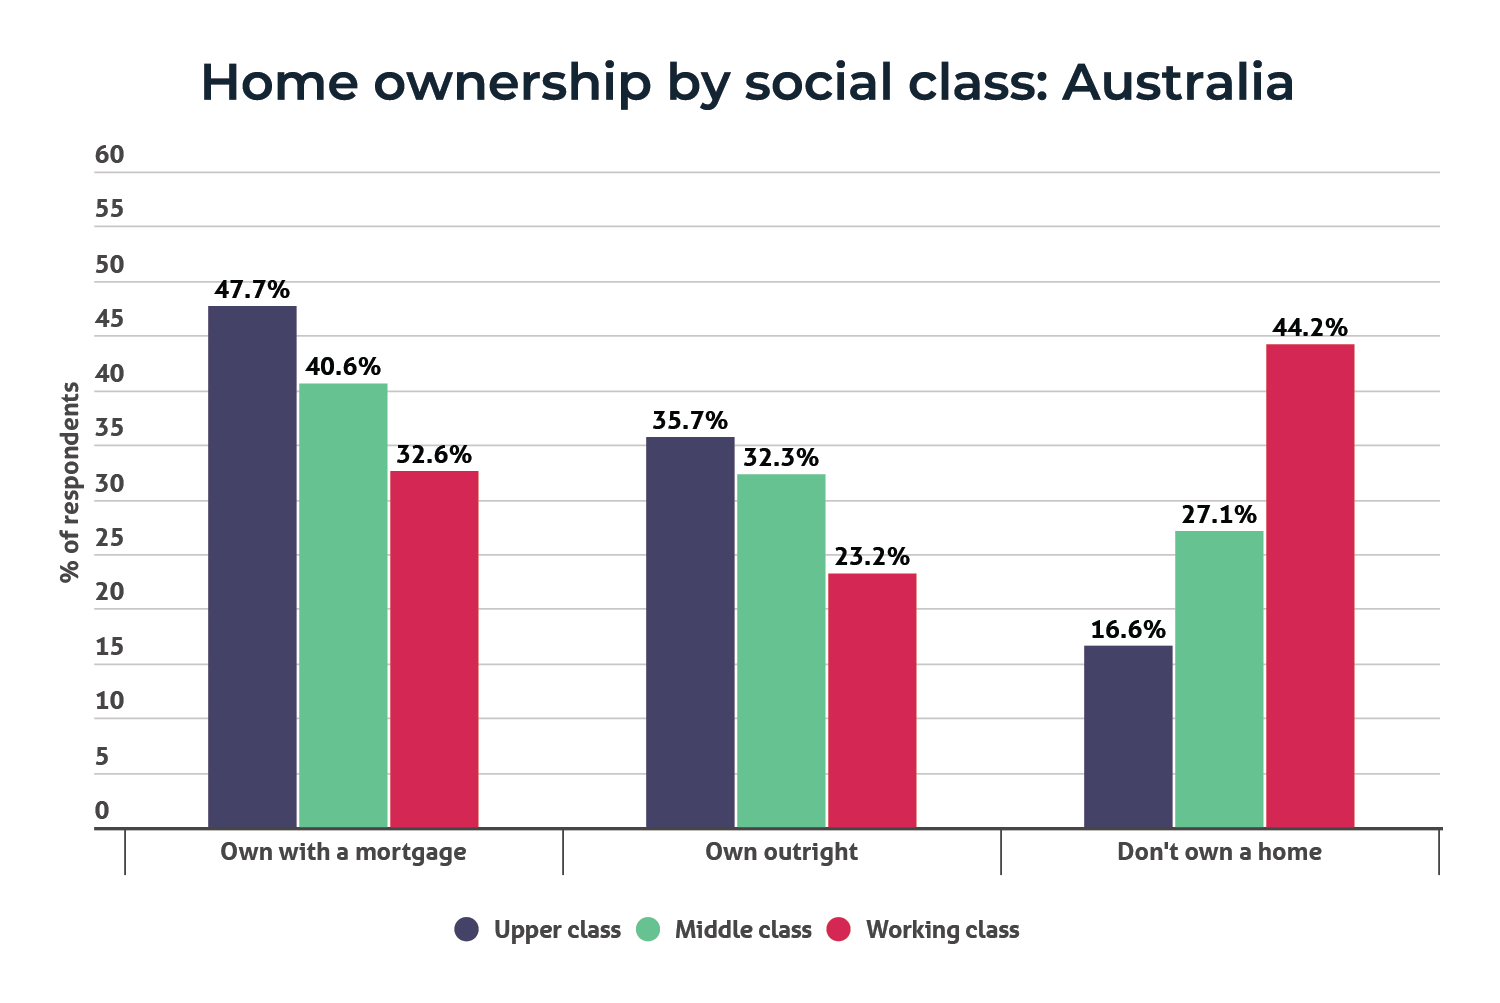
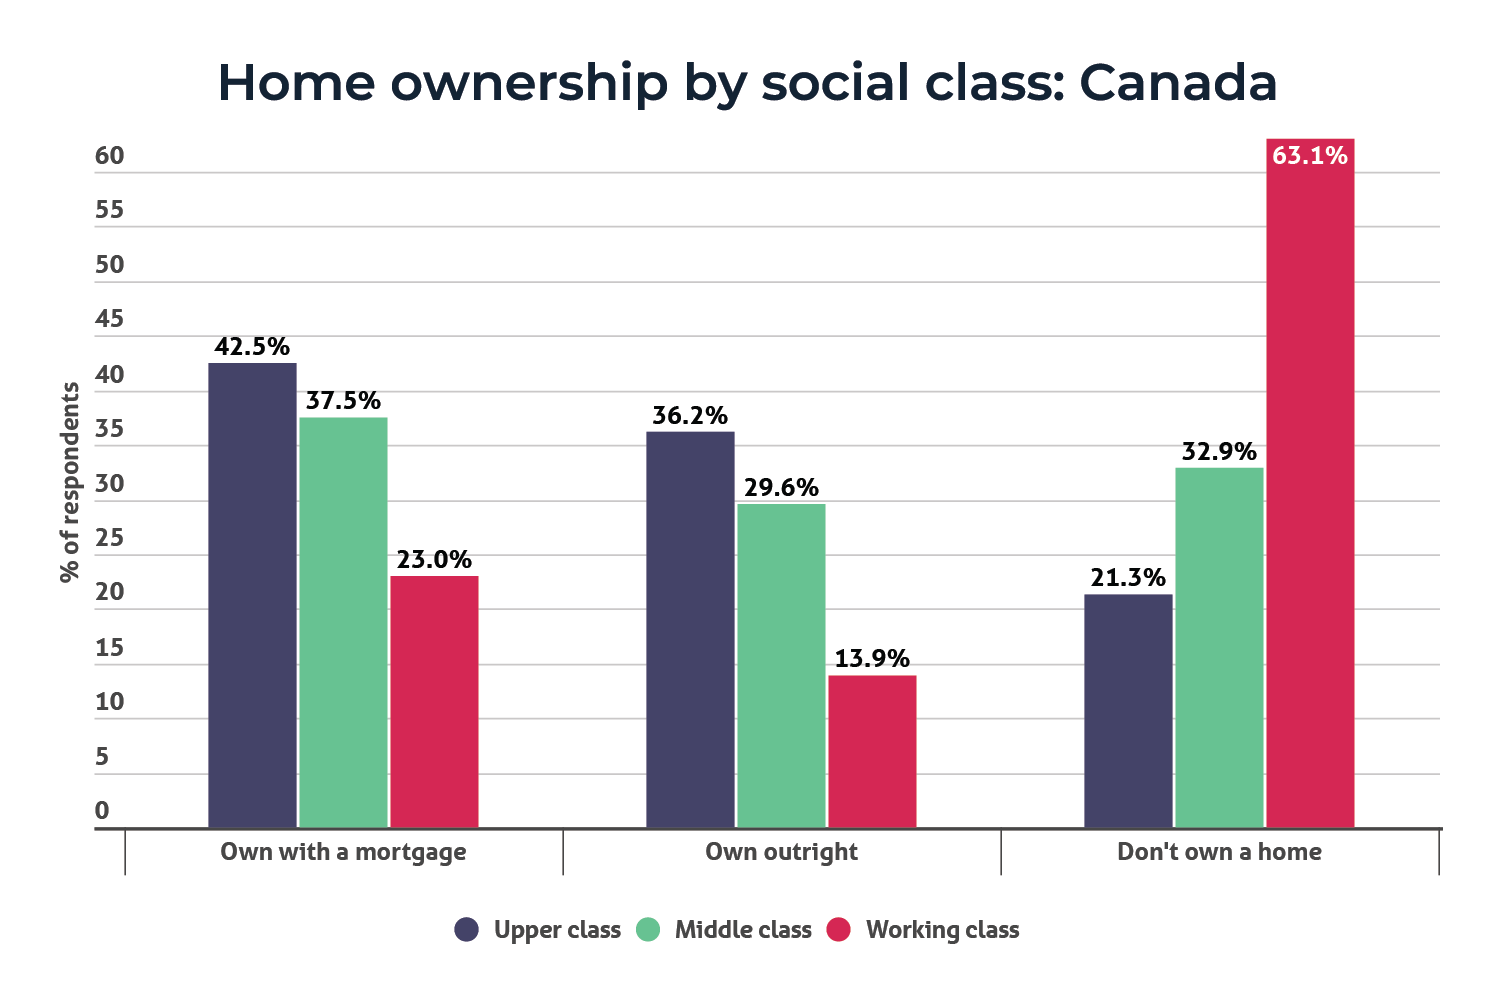
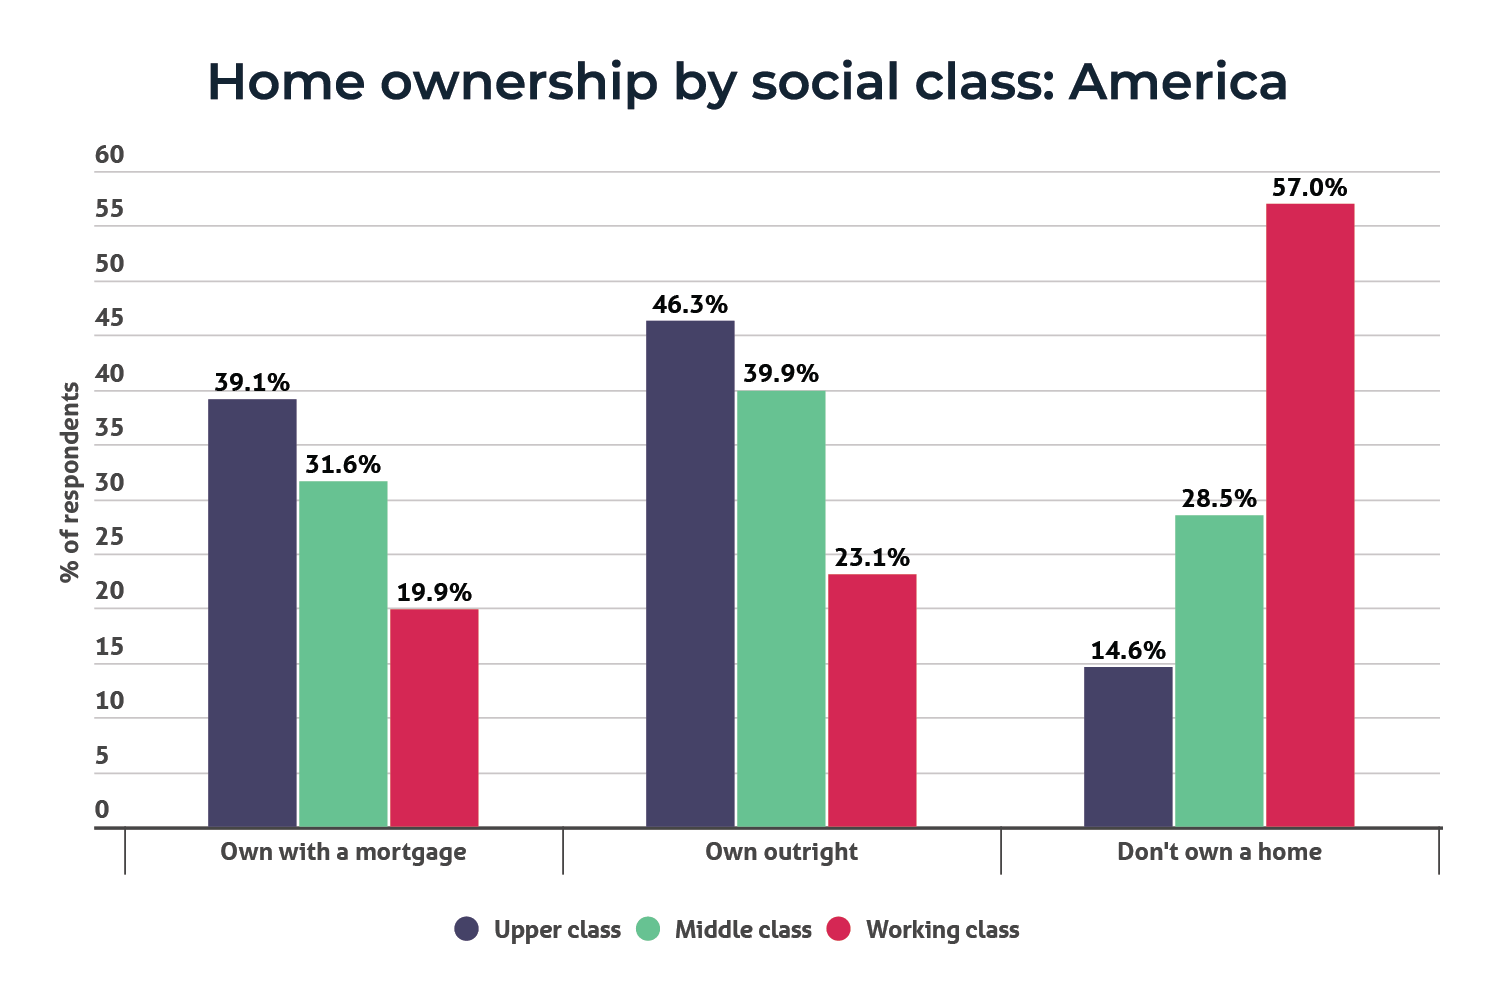
When breaking down home ownership by social class, the working class were more likely to say they didn’t own a home, while the other classes were more likely to own with a mortgage or outright.
In Australia, 44.2% of the working class don’t own a home, compared to 47.7% of the upper class and 40.6% of the middle class who own with a mortgage.
Canada had the biggest divide between the social classes, with 63.1% of the working class not owning a home, while 42.5% of the upper class and 37.5% of the middle class own with a mortgage.
In America, the upper and middle classes were most likely to say they owned their home outright (46.3% and 39.9% respectively), while 57.0% of the working class said they don’t own a home.
The charts below show the spread of results.
As our survey demonstrates, there are numerous factors behind people’s understanding of finances and money habits, but there is a clear wealth gap between the working class and middle/upper class – especially when it comes to home ownership.
It’s important to note – those who grew up in an upper class family weren’t invulnerable to sliding down the social ladder, and those who were raised in the working class were able to climb their way up. However, the survey shows there is a clear wealth gap in society, and this is most noticeable when it comes to home ownership as well as being taught about finances by parents, and how prepared people would be to teach future generations about money.
For those wanting to get a home loan, Compare the Market’s General Manager of Money Stephen Zeller said comparing a range of options can be beneficial.
“Comparing your options through a service like Compare the Market can help you get a better grip on available loan options and apply for one that meets your needs,” Zeller explained.
“Compare the Market only shows loan options that you can actually apply for, based on the information you provide.* Our results screen will list the interest rate, comparison rate, any application or ongoing fees, the repayment cost, and additional features like offset accounts and redraw facilities.
“Saving even just a small amount in terms of your interest rate can save you thousands of dollars over the course of the loan.”
Zeller also notes that there are other benefits and useful information users can get by using Compare the Market to review home loans.
“We have a team of mortgage specialists available to help applicants apply for a home loan so they can finance their property. They’re on hand to guide you through the process and answer any questions you have.
“Users can also calculate their borrowing power, receive a free credit score report and get free property reports for specific homes or suburbs to get a better understanding of the market,” Zeller said.
“On top of that, we have a range of pages on our website, expert spokespeople and content across social media to help educate and empower Australians to have a better understanding of home loans and finances.”
* Compare the Market’s home loan comparison service is only available to eligible Australian citizens or permanent residents purchasing property in Australia.
Compare the Market commissioned PureProfile to survey 1,003 Australian, 1,005 Canadian and 1,004 American adults in November 2023.