The Burrow
Nov 13, 2025
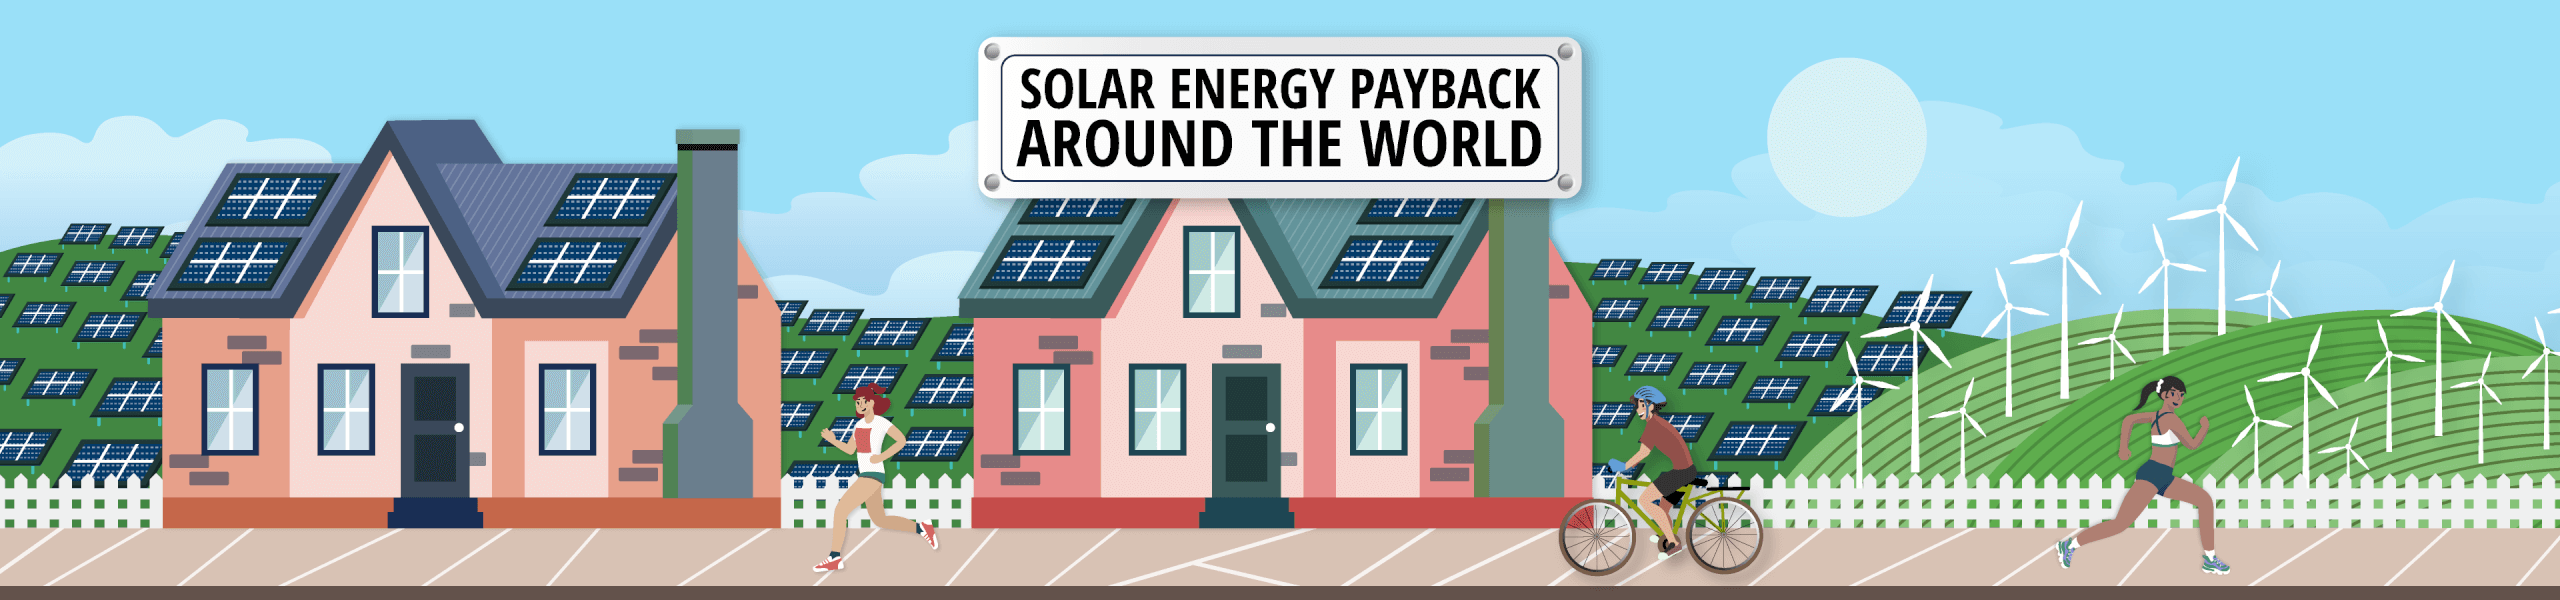
With energy prices consistently rising around the world and greater access to at-home renewable energy systems than ever before, solar panels have quickly shifted from a nice-to-have, energy-saving option to an essential property feature that many homeowners say they can’t do without.
Of course, some locations are naturally going to be more energy-efficient than others, and how soon you’re able to recoup the cost of your new investment all comes down to your solar payback rate; the length of time it takes your potential energy savings to recoup the initial installation cost.
So, to find out where in the world has the best solar payback rates, the energy comparison experts at Compare the Market analysed the solar efficiency rate for major cities in 20 of the world’s biggest countries, ranking them based on the annual solar output of panels, panel installation costs, and residential electrical prices, before breaking things down by region as well.
Find out what we discovered below.
Starting with the cities that have the greatest rate of solar payback, here are the top 5 locations for solar panel installation if you’re hoping to both save money on your energy bills, and pay back their installation costs asap:
Set towards the sunny southern tip of Australia’s western coast, Perth is by far the best city on our list for solar payback rates. Scoring 79.32 points and coming at or near the top of our city ranking for two of our core three factors, the so-called City of Lights stands unrivalled in its solar power-producing potential.
Specifically, Perth topped our list when it comes to cheap installation costs, with the average set of solar panels only costing residents AU$1,932.8 per kW capacity, while also coming at a respectable 12th out of the 126 cities we examined for annual solar output, with the average 1kW rooftop system in this city generating a substantial 1751.0 kWh per year.
In fact, the only area where Perth didn’t place as highly was in residential electricity costs, which came in at roughly AU$0.39 per kWh, pushing Perth all the way down to 40th in this area.
Overall, such lower residential rates are negligible when compared to Perth’s performance in all our other factors. Given how affordable panels are to install, and the amount of power they can potentially generate, they all combine to potentially help local homeowners rapidly pay off the costs of installation so they can start saving real money that much sooner.
Next up, we’ve another Australian city with Darwin. Nestled near the tip of the Northern Territory, the gateway to the Kakadu National Park wound up scoring 78.13 for its solar energy score – just 1.15 points behind Perth!
And like its Australian counterpart, Darwin isn’t far behind, matching Perth for the installation costs at AU$1,932.80, and ranking 17th for Annual Solar Output at 1711.5 kWh annually.
In fact, Darwin basically sits one step behind Perth in all regards, also coming 41st for residential energy costs with a similar average of around AU$0.39 per kWh, again making it very affordable.
For our third-place city, we finally move away from Australia and all the way over to the Spanish city of Málaga. Tucked away on the southern Mediterranean coast, Málaga managed to generate an overall solar payback score of 75.88, and once again performed very well in all factors.
Beginning with panel solar output, Málaga does better than Darwin, settling just behind Perth in 15th with an annual kWh total of 1716.2 for an average 1kW rooftop system. And the same is true for installation costs, with Spanish households paying a slightly higher price point of AU$2,076.25 per kW capacity.
Finally, for residential energy rates, Málaga is once more just a single step behind Perth and Darwin, totalling an average of AU$0.37 per kWh, but again, this still gives it a much better solar payback rate compared to two-thirds of our total ranking.
Staying in Spain for our fourth city, we move away from the coast and further inland to the historic city of Seville and its solar efficiency score of 75.60. And yet again, Seville shows off a very similar solar payback story to the rest of our top 5.
Case in point, Seville sits just behind Darwin in 18th for solar output, with city systems here generating 1706.8 kWh annually, before matching this trend for installation costs with installation prices at a matching AU$2,076.25.
It’s then once more a matching tale for residential energy prices as well, with locals paying AU$0.37 per kWh for their energy, all of which comes together to make Seville a solar payback hotspot.
Finally, to round out our top 5 cities, we’re back in Australia again, but over on the east coast this time, with the likes of Brisbane. Landing a final solar efficiency score of 74.61, as you’ll soon see, the one factor keeping Brisbane from a top 3 slot is its solar output potential.
Indeed, despite getting plenty of sunshine all year round, Brisbane panel systems generate a slightly lower rate of annual kWh’s compared to Perth and Darwin at 1595.0, though this is plenty more than many other cities on our list.
And residents looking to invest in solar panels in this area shouldn’t be too put off by this slightly lower rate of sunshine, as Brisbane still enjoys low installation costs of AU$1,932.80 (3rd lowest) and reasonable residential energy costs of AU$0.39 (42nd best), ensuring a healthy solar payback rate overall.
In stark contrast to the sunny sea and sands of Australia and Spain, there are some countries where the solar payback rate is much lower, and it’s honestly debatable whether solar panels would be worth the investment here.
For example, our worst-ranked city was Chengdu, China. Scoring just 26.81, it lands at the bottom of the index for annual panel solar output at 805.5 kWh, while also having very low residential rates of only AU$0.11 per kWh. And while installation costs are quite affordable at AU$2,550.24 (42nd best), the reality is that it will take a long time for homeowners to see the real financial benefits of their investment.
Further matching this sentiment, and scoring a similar efficiency rating of 27.07, Miskolc, Hungary has the unenviable spot of 2nd worst city for solar efficiency payback. While it does have a higher solar output of 1,209.0 kWh annually, high installation costs of AU$3,984.74 and low residential rates of AU$0.16 make recouping the cost of your panels in this city a lengthy process.
Stepping back to examine our solar payback index on a global level, we once again see that Spain and Australia dominate the top two spots (75.83 to 74.31, respectively).
With an excellent annual solar output of 1,589.4 kWh (6th best), the second-lowest panel installation cost behind Australia at AU$2,076.25 per kW capacity, and the 9th best residential costs at AU$0.37 per kWh, Spain really does come out just ahead of Australia thanks to the higher output of its panels.
But outside of our two competing countries, residents of Argentina, Chile, and the United States have fantastic stats when it comes to solar payback efficiency, with all three having a higher annual solar output than either Spain or Australia!
However, whether you will truly benefit from solar panels in these countries will depend on both your location and your budget. All three of these countries have high installation costs, with the United States costing an average of AU$4,228.00, while cities such as Seattle, Salta, and Temuco perform poorly in our rankings due to lower solar output and low residential energy costs in general.
Head of Energy at Compare the Market, Meredith O’Brien, notes that solar energy can be a compelling choice for any household.
“Although potentially expensive to install, solar panels are an investment. In almost all cases, it can take several years before your panels begin to pay for themselves,” Ms O’Brien said.
“However, solar panel installations can benefit you in many other ways besides saving money on your energy bills. For one thing, they could add value to your home by increasing its market price, with solar panels being a highly sought-after feature.
“Depending on your location, some energy providers may credit your energy bill for any solar energy you feed back into the grid. Although, these credits are reducing as the energy market is trying to encourage residents to use their solar generation and store excess usage in batteries. This is to help reduce the strain on the grid at peak times.
“When looking to sign up to or change energy plans, it’s important to compare your options to find an offer that suits your home and your lifestyle.”
This campaign ranks 20 countries (and their major cities) on how attractive solar power is for households, by combining the average installation costs, solar energy potential, and electricity prices into a standardised Solar Potential Score (0–100), to show where rooftop solar panels deliver the strongest financial return.
However, because reliable country-level residential solar cost data is scarce, we opted to use a transparent scientific estimation process to fill the gaps, producing results that are best-fit estimates rather than exact payback years.
The factors used were as follows:
From here, instead of calculating an exact payback period (which requires assumptions about self-consumption, export tariffs, O&M, and subsidies that vary widely), we built a Solar Potential Score where each factor (cost, solar output, electricity price) was normalised 0–100:
The three scores were then averaged to produce a final Solar Potential Score (0–100), at which point countries and cities were ranked from highest to lowest overall score and index based on the following:
Locations with low installation costs, strong solar resources, and expensive grid electricity rank highest. All metrics were normalised to ensure comparability across diverse markets. Results should be interpreted as relative attractiveness rather than literal payback years.
Currency conversions:
To aid accessibility, payback costs were provided in three currencies:
All data correct as of 2/10/2025.