The Burrow
Apr 2, 2026
As the cost of everyday essentials continue to climb, many households are becoming increasingly vulnerable to financial shocks. A single unexpected event, be it a burglary, fire, flood or accidental damage, can turn the task of replacing home contents into an overwhelming and costly burden.
For low-income households, the impact can be even more severe. Replacing belongings like furniture, electronics and appliances can drain savings, sometimes taking extended periods to financially recover. Despite this risk, many households remain underinsured, and emergency savings funds tend to be insufficient in absorbing such costs.
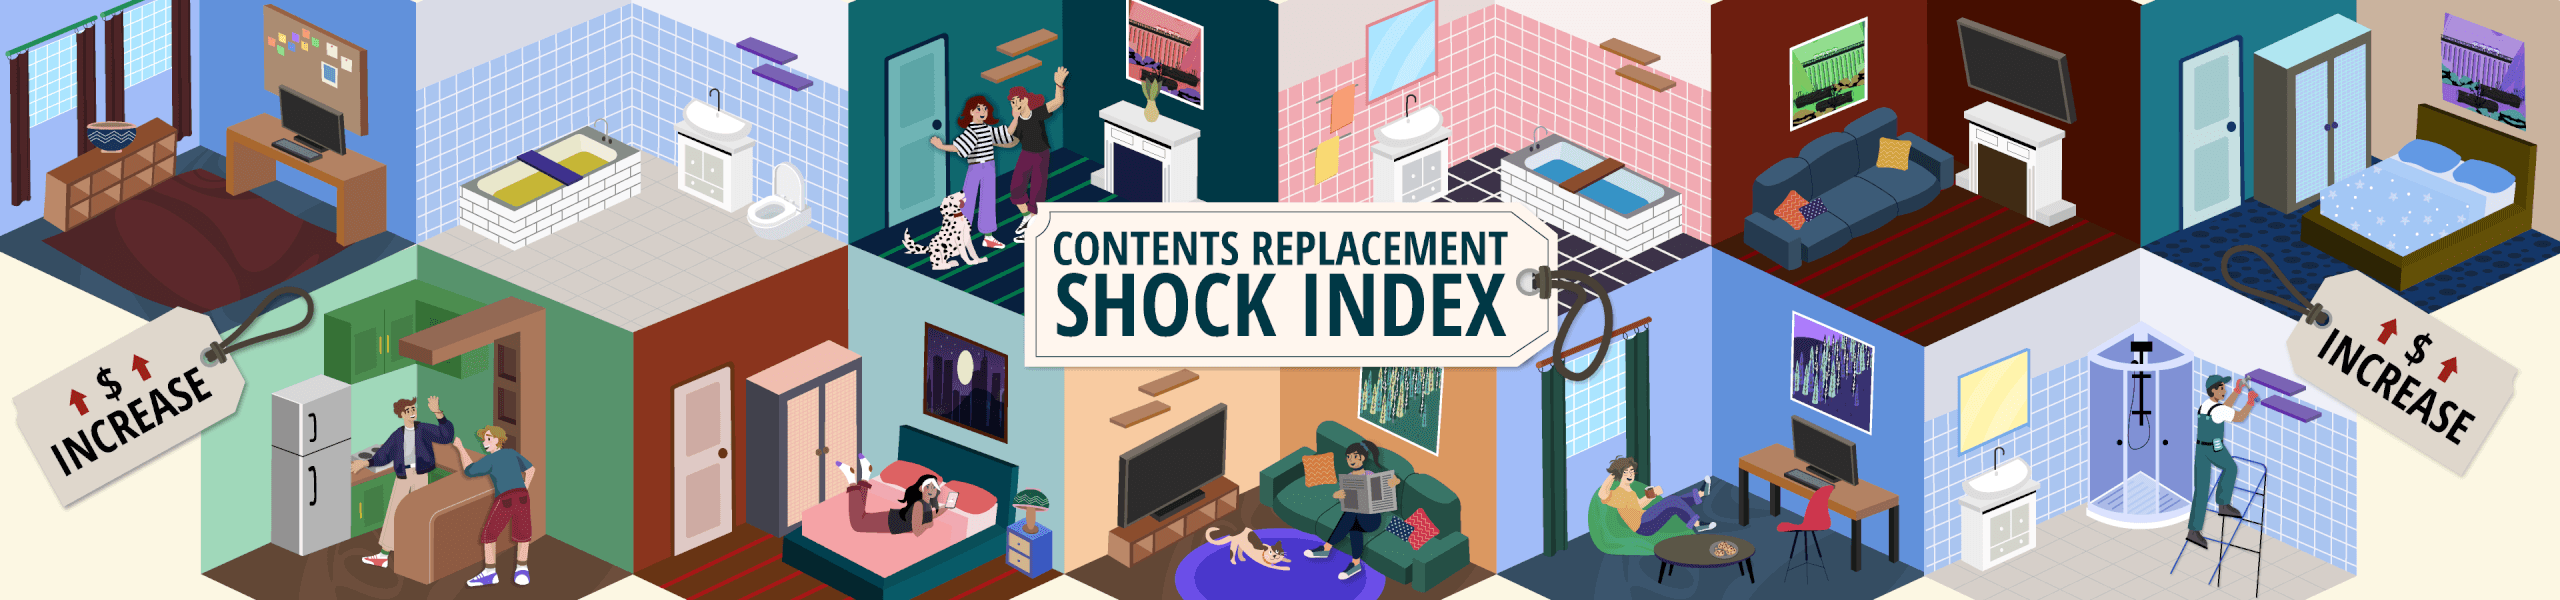
To find out which households are most exposed and where they’re more protected, the home and contents insurance comparison experts at Compare the Market analysed key financial and housing indicators across the US and Australia to create the Home Contents Replacement Exposure Index. The index ranks cities by how vulnerable households would respond to a $10,000 home contents replacement bill.
In Australia, the financial vulnerability of households to a $10,000 home contents replacement shock varies across cities, with wealthier locations generally better equipped to handle unexpected expenses.
Here’s a breakdown of the top-ranking cities, where households are more financially resilient and less at risk, alongside their indexed scores:
These cities are better off financially due to their higher median contents valuation, which reflects wealthier households with more disposable income.
In Canberra, the average amount of savings per household is particularly high, at AU$95,206. While rent costs in Canberra (31% of income) still create some financial pressure, the substantial savings helps residents to recover more easily from a financial shock.
In Perth and Brisbane, although renters may face pressure, these cities also benefit from either relatively high contents valuation or higher savings rates. Stronger financial buffers contribute to lower risk in these areas, despite the potential strain on renters.
In contrast, cities such as Bendigo (VIC), Sunshine Coast (QLD), Central Coast (NSW) rank at the bottom of the index, meaning they generally are at higher risk. These cities face more financial pressure due to generally higher rent burdens, which can make it harder for residents to recover from the cost of replacing their belongings.
Below is a breakdown of the cities where residents are better equipped financially and less at risk:
These cities rank at the top of our index, meaning households in these areas are generally better able to cope with the cost of replacing lost or damaged items. The cities at highest risk for home contents replacement in the US are:
Across the board, the average amount of savings was moderate, and fewer households were renting than in the top-ranking cities, with insurance searches being the lowest. However, the time taken to pay off a $10k replacement bill still takes significant time. In El Paso, Texas it is expected to take 8.69 weeks, the longest across America, closely followed by Memphis at 7.63 weeks, indicating these areas are at higher risk.
Cities with a higher number of renters can experience greater financial strain when it comes to replacing home contents. Often, renters can have less disposable income after paying rent, leaving fewer resources for insurance and building up a savings buffer.
Despite San Francisco’s high renter share of 44.9%, and residents spending 21.6% of their income on average on rent, the city ranks highly because of strong savings habits. With average savings per household of US$17,046 and a relatively quick recovery time (just 3.84 weeks to pay off a $10k replacement bill), San Franciso’s residents are far better equipped to bounce back quickly compared with other cities in the index.
Chicago has a much lower renter share of 34.1% as well as a lower proportion of income spent on rent (19.4%). Here, it takes an average household 5.73 weeks to recover from a $10k contents replacement bill.
New York, with a 48.8% renter share, ranks 5th from the bottom in the index and is more at risk than most cities in the index. With an average savings amount of US$11,697, it takes households in New York an average of 5.21 weeks to recover from the same $10k replacement bill. Here, the high renter share and the high cost of rent create significant financial strain, making recovery more difficult compared to higher-ranking cities.
Adrian Taylor, Executive General Manager of General Insurance at Compare the Market Australia, said, “Replacing the contents of a home can be far more expensive than people expect. When households are already juggling high rents or mortgage repayments alongside limited savings, home and contents insurance can easily fall down the priority list.
Our findings highlight how important it is to have a level of cover that reflects the value of what’s inside your home. A great policy can offer reassurance and financial support, helping households recover more quickly and with potentially less stress when the unexpected occurs.”
Before purchasing a home and contents insurance policy, make sure to read the Product Disclosure Statement (PDS) and Target Market Determination (TMD) so that you understand any limits, exclusions or restrictions of the cover.
Factors & Sources:
Methodology:
This dataset ranks the 20 most populated cities in Australia & the 30 most populated cities in the US, based on their ability to deal with a contents replacement shock, by using 6 key factors. Each factor’s data was collected and normalised to a score between 0 and 1. If data was missing, a score of 0 was given. These scores were then combined to give each city a total score out of 100, and cities were ranked from highest to lowest.
The factors used are as follows:
The factors were weighted as follows:
The factors were indexed as follows:
All data is correct as of 09/02/26. The ranking data shown is a compilation of multiple data sources and may not be representative of real life. All data is accurate with regards to the sources provided.