

Stagnant wage growth combined with near-record high house price growth may just put the debate over housing affordability to bed once and for all.
New research by McCrindle, titled ‘The Fading Australian Dream’ shows sharp increases in the cost of buying a home relative to incomes over the past 40 years.1
From 1981 to 2021, Australian adults’ average full-time total earnings increased 5.9 times from $15,800 in 1981 to $93,500 in November 2021.
That may seem like a lot, but not compared to home prices: over the same period, median house and unit values rose by roughly 14.8 times on average, from $46,101 in 1981 to nearly $678,000 this year.
Across Australia’s seven biggest capital cities, the average dwelling price/annual earnings ratio increased from 2.81 times to 7.27 times over the four decades to 2021.
“Young people today need almost three times the purchasing power that their parents needed to buy the average place,” McCrindle Principle, Mark McCrindle told Compare the Market.
“Interest rates were higher back then, but the relative impact of the interest rates on mortgage repayments are less than the total house price and the price to earnings ratio.
“While today there are factors helping people buy, like more supply and better access to loans, these are fairly minor compared to what helped previous generations.”
Where have house prices outpaced income growth the most?
While house and unit prices increased faster than income all over Australia, the most significant difference was seen, unsurprisingly, in Sydney.
In real purchasing power terms, Sydney units are now twice as expensive in relative terms (9.0 times earnings) compared to 1981 (4.3 times earnings); For houses, the difference changed from 5 times earnings to a whopping 14.3 times earnings.
The most affordable units are in Adelaide (4 times annual earnings) and the best-priced houses are in Perth (5.9 times average annual earnings).
Melbourne houses cost 10.4 times annual incomes while units cost 6.7 times income.
Canberra meanwhile has the second-most expensive houses in relative terms at 10.5 times the average annual income.
While new lending each month has spiked overall in recent months, this is primarily due to cheap interest rates, which Mr McCrindle says does not actually help with housing affordability at all.
“Back then you might’ve only needed one income, but now you need three incomes (based on price increases). When we take the current generations earnings and today’s house prices and compare it to their parents, it is harder today than it’s ever been before,” he said.
“People still have problems actually accessing the money they need to buy a home.”
Cost of living adding to housing pressures
It’s not just rising house prices that are making it harder to save for one; living in general has become more expensive too.
2021 Research paper ‘Generation Stressed’ by think tank Per Capita, calculated the total cost of a mortgage over the life of a standard 30-year term by comparing home prices, mortgage rates and wage changes.2
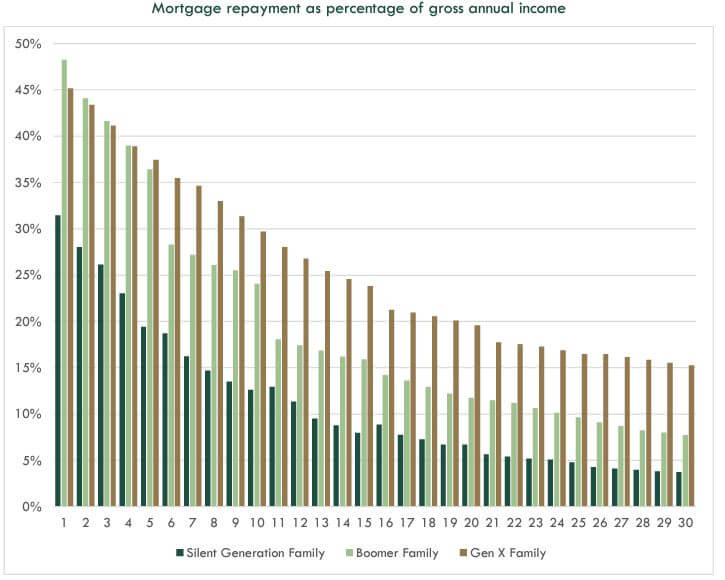
By calculating the portion of the median income is put towards covering the median mortgage, Per Capita found the lifetime cost of owning a home over 30 years has increased by 130%.
According to the research:
- For a Silent Generation family buying in 1970, the average repayment cost over the course of the mortgage was 11.2% of their gross income.
- For a Baby Boomer family buying a home in 1985, the average repayment cost over the life of the mortgage came out at 19.5% of gross income.
- For a Generation X family though, who bought in 2000 and have approximately nine years left to go on their mortgage, they will spend 25.5% of their gross income on servicing mortgage debt.
“It may seem counterintuitive that a home is significantly more unaffordable for current mortgagees, given that the Boomer Family had to pay double-digit interest rates in eight of the first 11 years of their mortgage, while the Gen X family have ridden the wave of low interest rates since the Global Financial Crisis (GFC),” the report’s lead author Matt Lloyd-Cape said.
“The fact is, though, judging housing affordability solely on the basis of interest paid is a crude measure.
“Low interest rates may appear to benefit households, but they contribute to spiralling house prices and reflect a failure of monetary policy to balance the economy over successive decades in order to effectively keep critical asset prices in line with wage growth.
“The Great Australian Dream of homeownership is now under significant strain.”
Source: Per Capita
Homebuyers looking to the regions to find affordable properties
While strategies like living at home for longer, using the bank of mum and dad, looking to buy in less desirable suburbs and buying units over houses can be useful for some, they don’t really help to drive prices down.
According to Mr McCrindle, what can help drive prices down in major cities is the trend towards regional property.
“We’re seeing significant internal migration (to the regions) and we expect that to continue,” he said.
“We’re solving the affordability problem by changing where we live and changing where we work, and just going to where the affordability equation actually works.”
In October, the latest Regional Movers Index – a partnership between the Regional Australia Institute (RAI) and Commonwealth Bank – showed regional net migration jumped 14% in the September quarter 2021, with people moving away from capital cities accounting for 6.2% of all moves.3
Sydney and Melbourne, the two most expensive cities in terms of median prices, are seeing the largest number of people moving away.
“Sydney was in lockdown for the entire September quarter and Melbourne for two-thirds of it and still we see an increase in the overall number of people choosing a regional lifestyle,” RAI CEO Liz Ritchie said.
“This only underlines what our research has found – that Australians have woken up to the huge range of job and lifestyle opportunities available in our regions.”
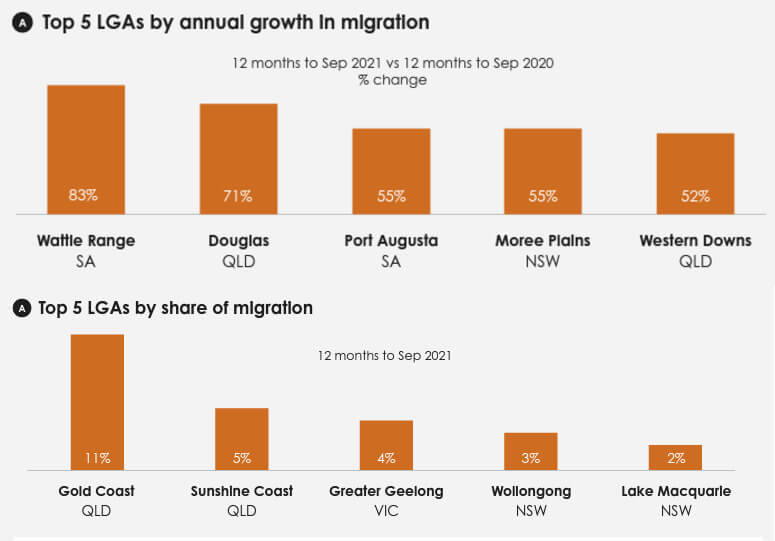
Local government areas (LGAs) seeing the highest annual growth in migration include Wattle Range in South Australia (+83%), Douglas in Queensland (+71%) and Port Augusta in South Australia (+55%).
However, the most popular destinations by share of migration continue to be high population coastal centres relatively close to capital cities, such as the Sunshine Coast in Queensland.
Source: Regional Australia Institute (RAI) and Commonwealth Bank.
Sources
Images via Shutterstock
- McCrindle Research, November 2021. The Fading Australian Dream (supplied).
- Per Capita, 22 July 2021. Generation Stressed: House Prices and the Cost of Living in the 21st Century.
- Commonwealth Bank and the Regional Australia Institute (RAI), 28 October 2021. ‘Increase in people choosing a regional lifestyle despite Sydney and Melbourne lockdowns’.