Fuel Crisis
Levers to pull at the pump
Key takeaways
- Australians spent an average of $55.98 a week on fuel in 2026, equal to $242.58 a month or $2,910.96 a year, which was $25.48 a week lower than in 2025.
- Compare the Market tracking found the national average price of Unleaded 91 peaked at $2.58 a litre during the Middle East crisis and again exceeded $2 after the full fuel excise rate returned in August.
- 31% of drivers said they had used fuel comparison apps; petrol prices can vary because of local competition, fuel-price cycles and broader economic conditions.


Despite surging global oil prices, Australians say they’re spending less on fuel. On average, Aussies spent $55.98 filling their car each week, equal to $242.58 a month or $2,910.96 a year – down $25.48 on 2025.
Fuel is a more flexible household expense compared to fixed costs like insurance premiums. Many drivers can control their spend by reducing their time on the roads, carpooling, and taking public transport.
Fuel excise cuts have also helped shield motorists from some of the worst price shocks.
Average monthly fuel spend by state
| Average monthly fuel spend by state | |
|---|---|
| National | $242.58 |
| NSW | $259.82 |
| ACT | $255.14 |
| VIC | $249.21 |
| WA | $228.58 |
| QLD | $227.28 |
| SA | $220.43 |
| TAS | $217.10 |
Nearly a third (31%) of drivers say they’ve used fuel comparison apps to look for savings.
Why don’t all Australians pay the same price for petrol?
Petrol prices can vary significantly across Australia due to fuel pricing cycles, local competition and broader economic factors. According to the ACCC, prices in major cities typically follow a cycle where prices gradually fall before rising sharply again.
Retailers set their own prices, which means motorists can often save by comparing local fuel prices and timing their fill-up.
Key factors influencing fuel prices include:
- Global oil prices: Higher crude oil prices generally increase wholesale fuel costs.
- Exchange rates: A weaker Australian dollar can make imported fuel more expensive.
- Fuel excise: The Federal Government’s fuel excise is incorporated into the price motorists pay at the pump.
For many households, understanding local fuel cycles and shopping around for cheaper fuel can help reduce annual transport costs.
Middle East crisis
Motorists were hit with a double whammy when the first fuel price shock struck just as regular fuel-price cycles were peaking across the country.
Compare the Market tracking shows the national average price of Unleaded 91 peaked at $2.58 a litre during the crisis.
Prices began falling after a temporary halving of the fuel excise took effect. It took until 21 April for the national average price to fall below the painful $2-a-litre mark.
When the excise cut ended in full at the start of August, the average price once again exceeded $2 a litre.
Average fuel price trends
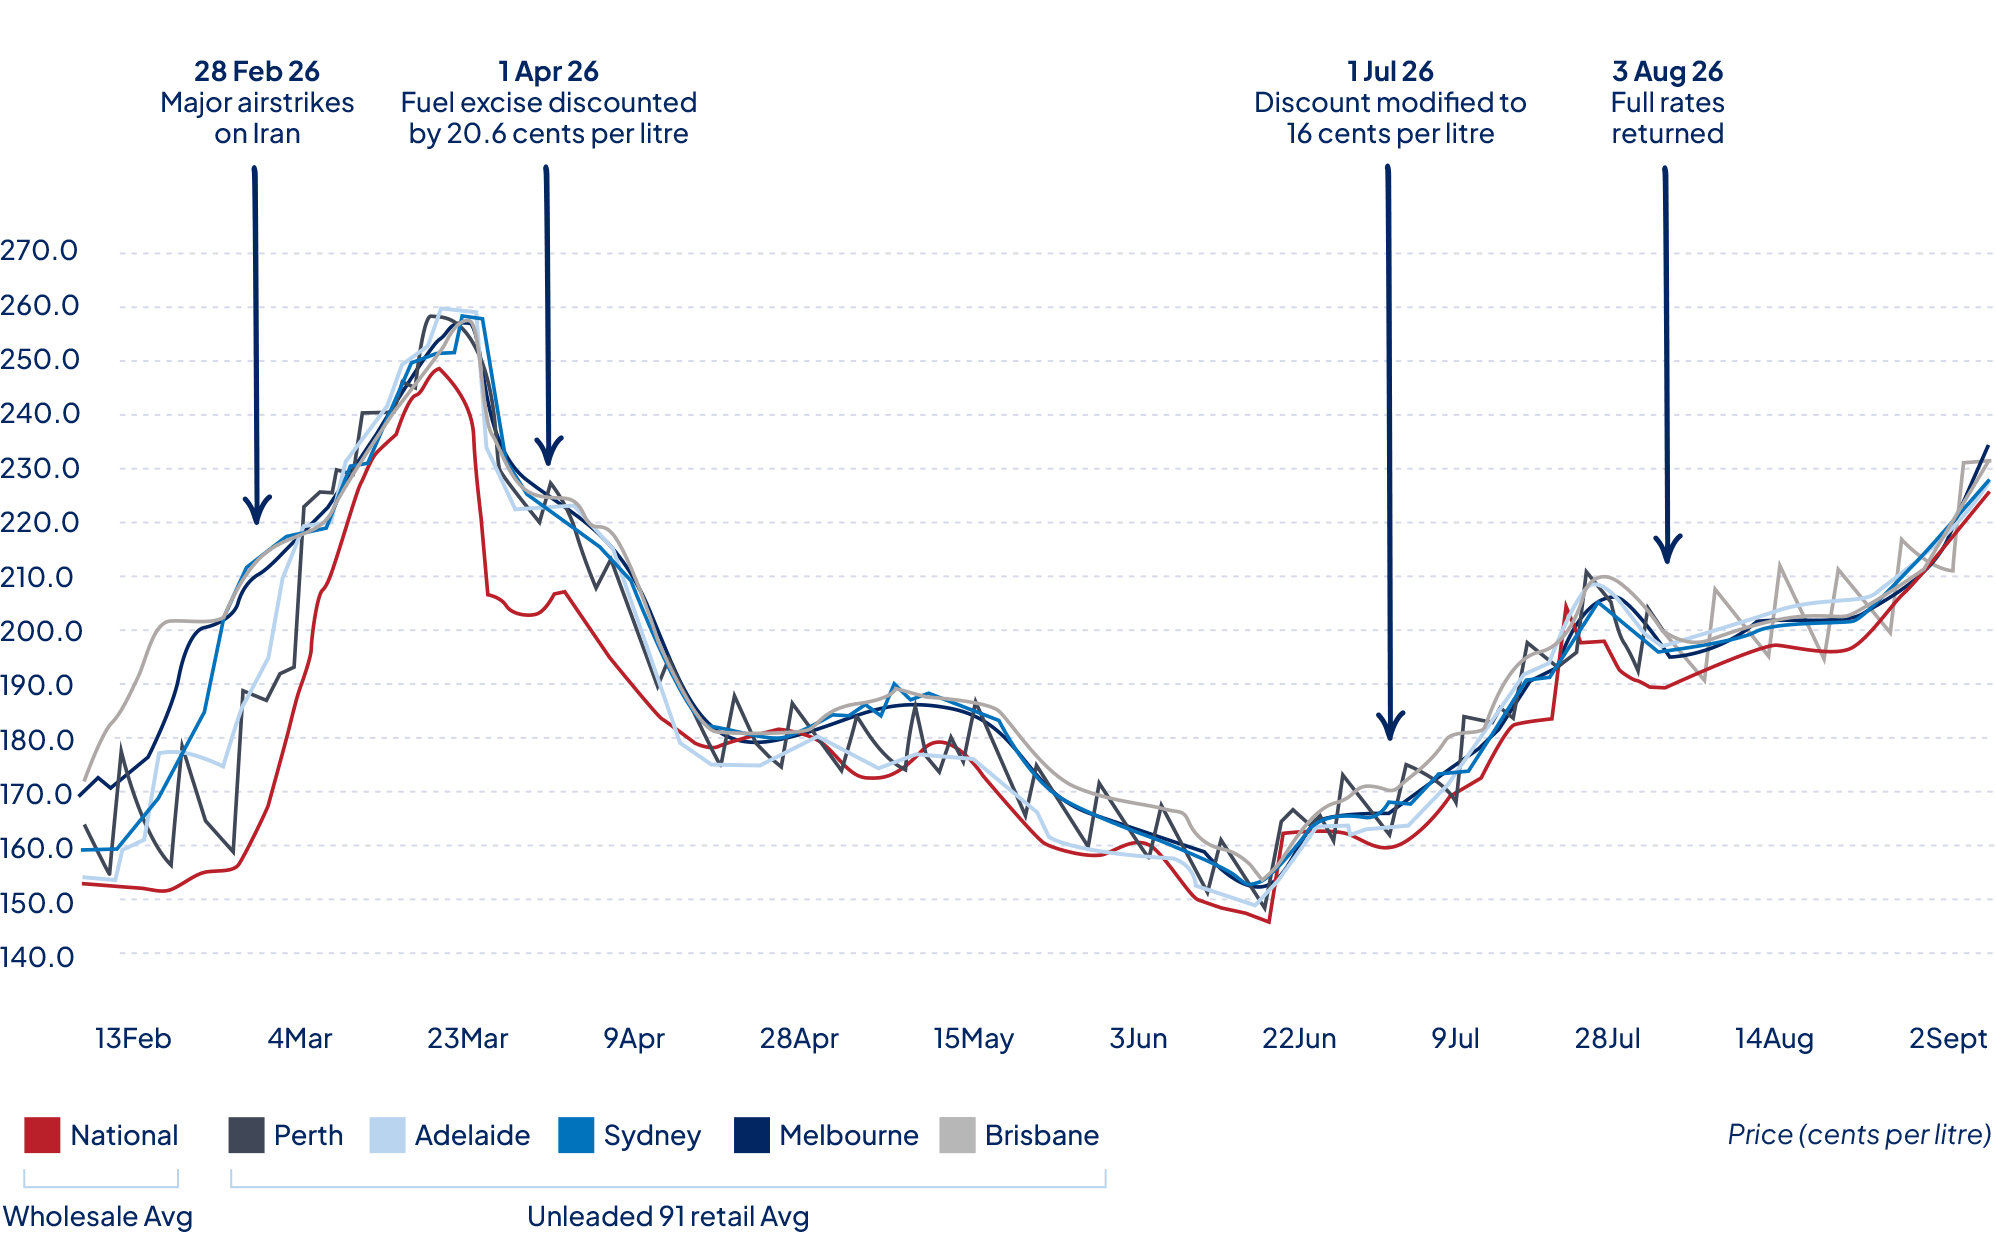
| Date | Average price per litre for Unleaded 91 across five major capitals in 2026 ($) |
|---|---|
| 13-Feb | 164.08 |
| 16-Feb | 164.56 |
| 17-Feb | 164.66 |
| 18-Feb | 170.90 |
| 19-Feb | 171.06 |
| 20-Feb | 172.12 |
| 23-Feb | 177.46 |
| 24-Feb | 179.02 |
| 25-Feb | 186.02 |
| 26-Feb | 185.96 |
| 27-Feb | 185.86 |
| 2-Mar | 188.20 |
| 3-Mar | 190.64 |
| 4-Mar | 201.14 |
| 5-Mar | 202.78 |
| 6-Mar | 204.72 |
| 9-Mar | 209.58 |
| 10-Mar | 211.28 |
| 11-Mar | 219.70 |
| 12-Mar | 221.22 |
| 13-Mar | 222.24 |
| 16-Mar | 229.34 |
| 17-Mar | 230.14 |
| 18-Mar | 234.08 |
| 19-Mar | 238.10 |
| 20-Mar | 240.82 |
| 23-Mar | 244.92 |
| 24-Mar | 247.90 |
| 25-Mar | 252.20 |
| 26-Mar | 254.90 |
| 27-Mar | 255.50 |
| 30-Mar | 258.36 |
| 31-Mar | 257.24 |
| 1-Apr | 240.48 |
| 2-Apr | 232.28 |
| 3-Apr | 227.98 |
| 6-Apr | 225.32 |
| 7-Apr | 224.02 |
| 8-Apr | 225.30 |
| 9-Apr | 224.58 |
| 10-Apr | 222.06 |
| 13-Apr | 217.88 |
| 14-Apr | 216.24 |
| 15-Apr | 215.54 |
| 16-Apr | 210.84 |
| 17-Apr | 206.40 |
| 20-Apr | 199.52 |
| 21-Apr | 194.98 |
| 22-Apr | 191.84 |
| 23-Apr | 186.74 |
| 24-Apr | 183.14 |
| 27-Apr | 180.74 |
| 28-Apr | 179.36 |
| 29-Apr | 181.50 |
| 30-Apr | 180.42 |
| 1-May | 179.44 |
| 4-May | 178.96 |
| 5-May | 178.48 |
| 6-May | 182.28 |
| 7-May | 181.92 |
| 8-May | 181.94 |
| 11-May | 181.84 |
| 12-May | 181.08 |
| 13-May | 182.50 |
| 14-May | 181.84 |
| 15-May | 180.84 |
| 18-May | 183.54 |
| 19-May | 182.78 |
| 20-May | 185.34 |
| 21-May | 183.42 |
| 22-May | 182.70 |
| 25-May | 183.48 |
| 26-May | 182.42 |
| 27-May | 183.58 |
| 28-May | 181.32 |
| 29-May | 179.18 |
| 1-Jun | 175.98 |
| 2-Jun | 173.38 |
| 3-Jun | 173.32 |
| 4-Jun | 170.34 |
| 5-Jun | 168.26 |
| 8-Jun | 166.26 |
| 9-Jun | 165.20 |
| 10-Jun | 166.66 |
| 11-Jun | 165.44 |
| 12-Jun | 164.44 |
| 15-Jun | 163.54 |
| 16-Jun | 162.76 |
| 17-Jun | 163.86 |
| 18-Jun | 162.34 |
| 19-Jun | 160.84 |
| 22-Jun | 158.30 |
| 23-Jun | 156.34 |
| 24-Jun | 157.20 |
| 25-Jun | 155.72 |
| 26-Jun | 154.30 |
| 29-Jun | 152.14 |
| 30-Jun | 151.52 |
| 1-Jul | 158.18 |
| 2-Jul | 160.70 |
| 3-Jul | 162.32 |
| 6-Jul | 166.14 |
| 7-Jul | 165.66 |
| 8-Jul | 167.62 |
| 9-Jul | 167.12 |
| 10-Jul | 166.72 |
| 13-Jul | 167.30 |
| 14-Jul | 166.72 |
| 15-Jul | 169.74 |
| 16-Jul | 170.76 |
| 17-Jul | 172.12 |
| 20-Jul | 174.48 |
| 21-Jul | 175.06 |
| 22-Jul | 179.00 |
| 23-Jul | 180.78 |
| 24-Jul | 182.66 |
| 27-Jul | 187.80 |
| 28-Jul | 189.64 |
| 29-Jul | 193.64 |
| 30-Jul | 194.00 |
| 31-Jul | 194.28 |
| 3-Aug | 198.80 |
| 4-Aug | 202.34 |
| 5-Aug | 207.52 |
| 6-Aug | 208.54 |
| 7-Aug | 207.66 |
Hear from Compare the Market's Economic Director, David Koch
“Fuel is one bill where motorists can often take small, immediate actions to help reduce the price they pay at the pump, whether that is comparing nearby prices or timing the fill-up. Using fuel comparison Apps, like the Simples App, is quick and easy to compare fuel around you, whether a lower price is one suburb or even one street away. The key is to focus on the levers households can control, because global oil prices, exchange rates and fuel excise will continue to move around them.”