
Insurance Quotes Surge
Insurance has become one of the biggest pressures on household budgets
Key takeaways
- Average indicative home and contents insurance quotes across Australia’s five largest capitals rose 26% over two years to September 2026, an increase of $599.54 for the report’s standardised property profile.
- Average indicative comprehensive car insurance quotes rose 21% over the same period, an increase of $375.88 for the standardised driver and vehicle profile; combined, the increases were close to $1,000.
- Only 11.5% of homeowners felt confident they knew the current cost to rebuild their home, while 15.4% worried they could be underinsured and 14.8% were unsure whether they had the right level of cover.


Quoted premiums in the country’s five largest capitals have increased by an average of 26% in the two years we have been tracking prices. In dollar terms, that’s an extra $599.54 for a typical four-bedroom home.
Meanwhile, car insurance quotes increased 21%, up $375.88, in the same time period.
Combined, this represents close to $1,000 more on average for these household staples.
The pressure hasn’t gone away, but the pace appears to be easing. The line graph shows most of the rapid premium growth occurred in 2025, with increases slowing over the past 12 months.
Sydney remains the most expensive of the major capitals for insurance and saw the biggest dollar increase in the home category, with quotes increasing $652.13 on average.
Melbourne saw the biggest percentage increases in both home (+30%) and car (+25%) cover, which the Insurance Council of Australia attributes at least in part to crime rates and higher levels of claims.
After starting from a lower base, Adelaide also saw above average increases in home and contents cover, which could also reflect rising building costs.
Combined average car and home insurance quotes
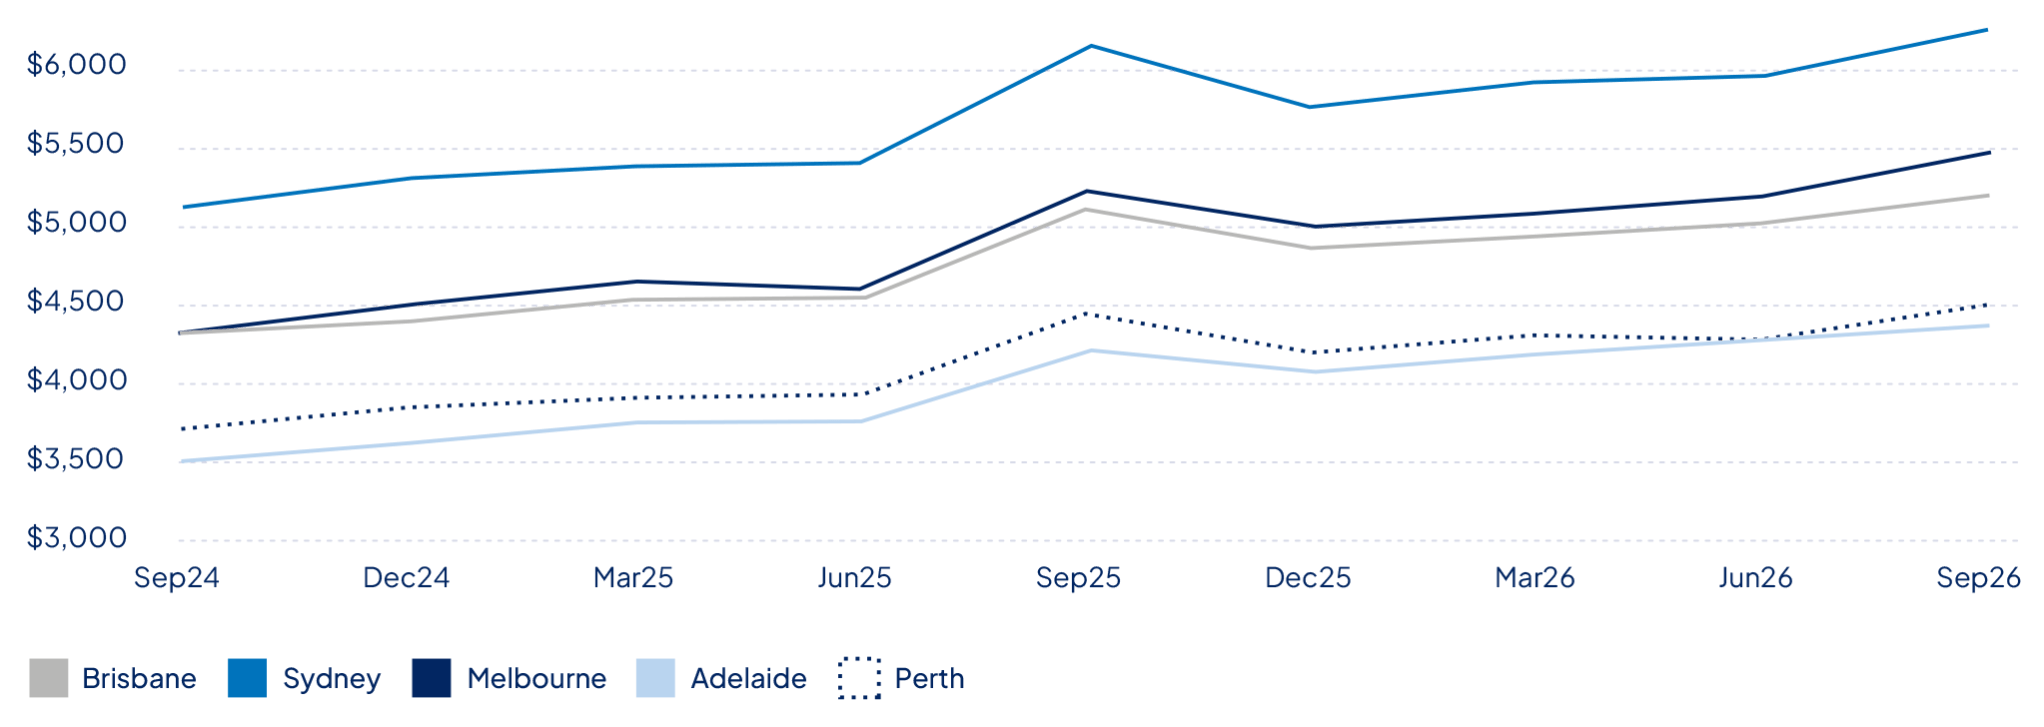
Combined average car and home insurance quotes
| Brisbane | Sydney | Melbourne | Adelaide | Perth | |
|---|---|---|---|---|---|
| Sep-24 | $4,232.43 | $5,062.41 | $4,238.68 | $3,407.15 | $3,615.70 |
| Dec-24 | $4,327.25 | $5,242.28 | $4,437.21 | $3,526.41 | $3,779.38 |
| Mar-25 | $4,446.66 | $5,302.20 | $4,560.53 | $3,666.57 | $3,831.95 |
| Jun-25 | $4,484.18 | $5,334.79 | $4,519.67 | $3,672.31 | $3,850.31 |
| Sep-25 | $5,042.86 | $6,096.54 | $5,152.30 | $4,128.51 | $4,361.38 |
| Dec-25 | $4,780.43 | $5,702.32 | $4,940.41 | $3,994.27 | $4,123.16 |
| Mar-26 | $4,871.33 | $5,853.36 | $5,019.53 | $4,102.00 | $4,225.29 |
| Jun-26 | $4,947.68 | $5,894.54 | $5,125.81 | $4,179.69 | $4,200.75 |
| Sep-26 | $5,125.11 | $6,187.45 | $5,396.94 | $4,292.10 | $4,427.66 |
Average quoted premiums September 2024 vs 2026
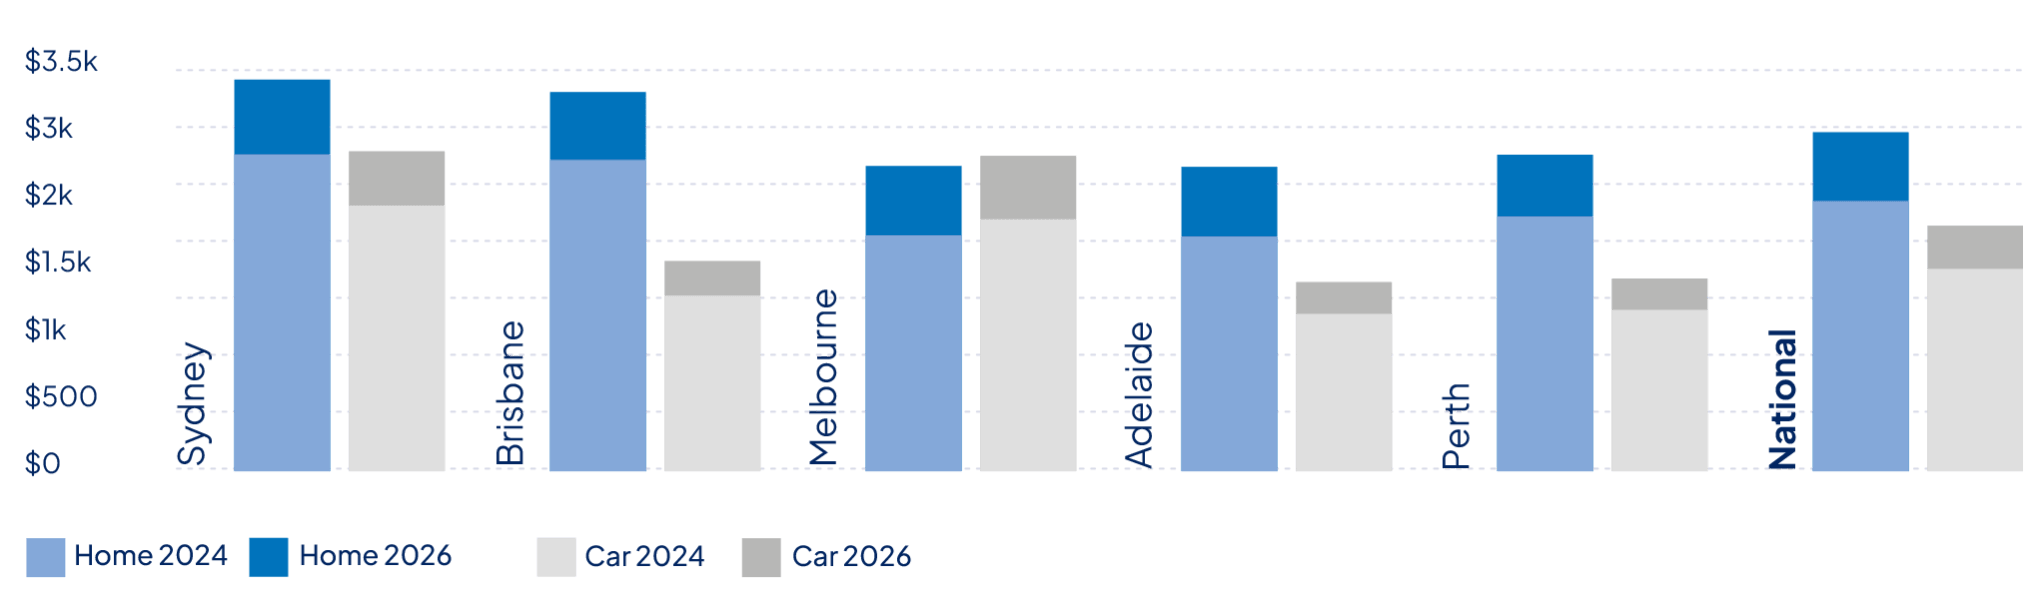
Two-year change in quoted home and contents insurance premiums
| City | September 2024 | September 2026 | % increase | $ increase |
|---|---|---|---|---|
| Sydney | $2,753.09 | $3,405.22 | +24% | $652.13 |
| Brisbane | $2,706.00 | $3,297.28 | +22% | $591.28 |
| Melbourne | $2,048.49 | $2,654.25 | +30% | $605.76 |
| Adelaide | $2,039.09 | $2,646.83 | +30% | $607.74 |
| Perth | $2,213.37 | $2,752.12 | +24% | $538.75 |
| National | $2,348.33 | $2,947.87 | +26% | $599.54 |
| Based on average indicative home and contents insurance quotes available from Compare the Market and also from selected popular industry brands. Quotes for a typical low-set, 4 bedroom 2 bathroom, freestanding brick veneer home with tiled roof, insured for $700,000 with $80,000 in contents with a target excess of $1,000 for both home and contents. Our home owner was a 30 year old male who lives alone with no previous claims. Quotes collected every three months or as close as possible from a start date of 30/08/2024 – 01/09/2024.Your quotes will vary depending on your unique circumstances. | ||||
Two-year change in quoted car insurance premiums
| City | September 2024 | September 2026 | % increase | $ increase |
|---|---|---|---|---|
| Sydney | $2,309.32 | $2,782.23 | +20% | $472.91 |
| Brisbane | $1,526.43 | $1,827.83 | +20% | $301.40 |
| Melbourne | $2,190.19 | $2,742.69 | +25% | $552.50 |
| Adelaide | $1,368.06 | $1,645.27 | +20% | $277.21 |
| Perth | $1,402.33 | $1,675.54 | +19% | $273.21 |
| National | $1,758.93 | $2,134.81 | +21% | $375.88 |
| Based on average indicative comprehensive car insurance quotes available from Compare the Market and also from selected popular industry brands. We used a target excess of $1,000 or as close as possible where this was not available. Quotes for a white 4-door 2020 Toyota Corolla driven 12,000 km on average per year by a 30 year old male driver. See notes for further information relevant to the pricing of the policies. Quotes collected every three months or as close as possible from a start date of 30/08/2024 – 01/09/2024. Your quotes will vary depending on your unique circumstances. | ||||
Hear from Compare the Market's Chief Executive of General Insurance, Adrian Taylor:
“Insurance is a necessary household protection, but renewal increases should still be scruntised. Compare your options, review the cover and excess, and use a rebuild-cost calculator for home insurance so any reduction in premium does not come at the expense of being properly protected.”

Rebuild costs
Just one in nine homeowners (11.5%) feel confident they know what it would cost to rebuild their home at today’s construction prices, highlighting a concerning knowledge gap that could leave thousands of Australians underinsured.
34.7% of homeowners did not feel confident setting a rebuild value for their property, while 53.6% said they had a rough idea but did not feel completely sure.
When asked to describe their current level of insurance coverage, 15.4% of respondents worried they could be underinsured and 14.8% were unsure whether they had the right amount of cover, while around a quarter (24.6%) felt they could be overinsured or paying for features they did not need.
Only 45% of respondents believed they had the right level of cover.
The rebuild cost of a home can differ significantly from its market value, because it is based on the cost of materials, labour, professional fees and demolition or debris removal — not the value of the land it sits on.
Homeowners are encouraged to use free rebuild-cost calculators to improve their estimate.