Compare the Market has launched its 2026 Household Budget Barometer report, offering a detailed look at the financial pressures facing Australian households and how consumers are responding after years of rising living costs.
Now in its fourth year, the report brings together consumer research, spending trends and Compare the Market analysis across major household expenses, including insurance, groceries, fuel, energy, housing and private health insurance. This year, the report tracks both state and local insights, providing a comprehensive look at where Aussies are being hit the hardest by rising costs and how they’re coping.
The Household Budget Barometer is an annual pulse check on how Australians are coping with the cost of living. It monitors spending trends, tracks insurance quote prices and examines Australians’ financial habits, concerns and goals to understand the major pressures on household budgets.
It also examines the wider financial issues shaping Australian households, including debt, access to home ownership, financial education, wealth transfer and concerns about the future of work.
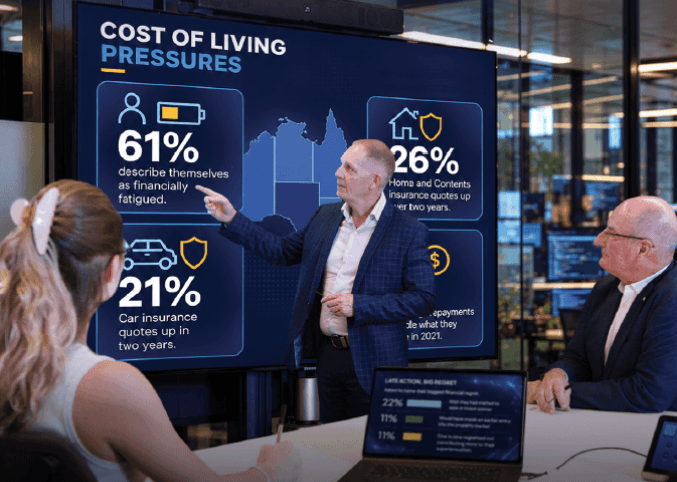
This year’s report puts the spotlight on Australia’s growing financial fatigue, with 61% of respondents saying they feel financially fatigued and less able to make proactive money decisions.
A further 85% say inflationary pressures have lasted longer than expected, while only 9% believe the cost of living is improving.
Compare the Market Economic Director David Koch said the findings painted a picture of Australian households worn down by years of financial pressure.
“Australians are financially fried. They’ve spent years juggling higher grocery bills, insurance premiums, mortgage repayments and everyday expenses, and many are understandably running out of steam,” Mr Koch said.
“What stands out in this year’s report is that the pressure isn’t only hurting people’s hip pockets. It’s also affecting their ability to make proactive decisions with their money.
“When you’re tired of thinking about bills and price rises, it’s easy to put reviewing your finances in the too-hard basket. The problem is that staying put can mean paying more than you need to.
“Economic indicators can tell us inflation is rising or falling, but they don’t always show what is happening around the kitchen table.
“The Household Budget Barometer looks at what Australians are spending, where they’re feeling pressure, what they’re worried about and what they’re doing to fight back.
“By bringing those insights together, we can build a clearer picture of the financial health of Australian households and identify the areas where consumers may still have the power to take back some control.
“Australians are rightly frustrated about rising prices, but that doesn’t mean they’re completely powerless. The new research shows that there is value in putting those major household expenses under the microscope and shopping around.
“It might only take a few minutes to compare, but the impact of finding a better deal could last much longer.”
This year’s report features exclusive research to support journalists, politicians and policymakers in understanding pricing practices, including:
- More than 4 in 5 Australians surveyed reporting inflationary pressures had lasted longer than they expected
- 61% describing themselves as financially fatigued and less able to make proactive money decisions
- Fewer than 1 in 10 Australians believing the cost of living was improving
- The average Australian spending $186.23 a week on groceries
- Australians spending an average of $55.98 a week on fuel
- A 26% jump in home and contents insurance costs over two years and car insurance up 21% across the five largest capitals.
Data and figures from the report will also feature across Compare the Market’s social media channels and other customer communications over the next 12 months.
The full report is live and available here: https://www.comparethemarket.com.au/household-budget-barometer/
For further insights, stats and analysis, view the report in full here. Compare the Market can also break down data at a state level, by generation, household size and gender.